Williams %R: The Percent Range
Williams %R tells you where today's close landed inside the recent high-low range, drawn on a flipped scale that runs from 0 down to minus 100. Mathematically it is the stochastic's %K line turned upside down: take the %K value, subtract 100, and you have Williams %R. Nothing else changes.

Think of a stadium countdown clock. It shows the same sixty seconds a stopwatch shows, just drawn from the other end, and nothing about the game changes. Larry Williams built the same measurement that stochastic-using peers were already reading, then printed it counting down from zero instead of up to one hundred.
That identity matters for how you study it. The stochastic lessons earlier in this level own the range-position math and its reading. This lesson teaches the flip, the scale conventions, and the handful of places where %R genuinely differs in practice.
The Formula: The Stochastic, Mirrored
The formula is: highest high minus the close, divided by highest high minus lowest low, multiplied by minus 100. The default lookback is 14 bars, same as the standard stochastic.
Walk one example. Say the highest high over 14 bars is 60 and the lowest low is 40. The close is 50. Highest high minus close is 10. The range is 20. Ten over twenty is 0.5, times minus 100 gives minus 50. The close sat exactly mid-range, and %R reads minus 50.
Now compare with the stochastic's %K, which is close minus lowest low, over the range, times 100. Same numbers: 50 minus 40 is 10, over 20, times 100, gives 50. The %R reading of minus 50 is exactly %K minus 100. That identity holds at every point on every bar.
The numerator is the only conceptual difference. %K measures how far the close sits above the low. %R measures how far the close sits below the high. Same position, measured from opposite walls.
Reading the Negative Scale
Zero means the close sits at the very top of the 14-bar range. Minus 100 means it sits at the very bottom. Everything else falls between.
The overbought zone runs from 0 to minus 20. The oversold zone runs from minus 80 to minus 100. Those bands mirror the stochastic's 80-and-above and 20-and-below zones exactly.
The mental flip trips everyone once. On this scale, a large absolute number means a weak close. Minus 90 looks dramatic, feels like a big reading, and it is: it is a big statement about weakness, because the close hugged the bottom of the range. A reading near zero, which looks small and quiet, actually means the close pinned the top.
Train yourself to read the number as distance below the high. Minus 15 means the close finished 15 percent of the range away from the top. That framing keeps the direction straight without translating back to the stochastic every time.
Reversal Signals on %R
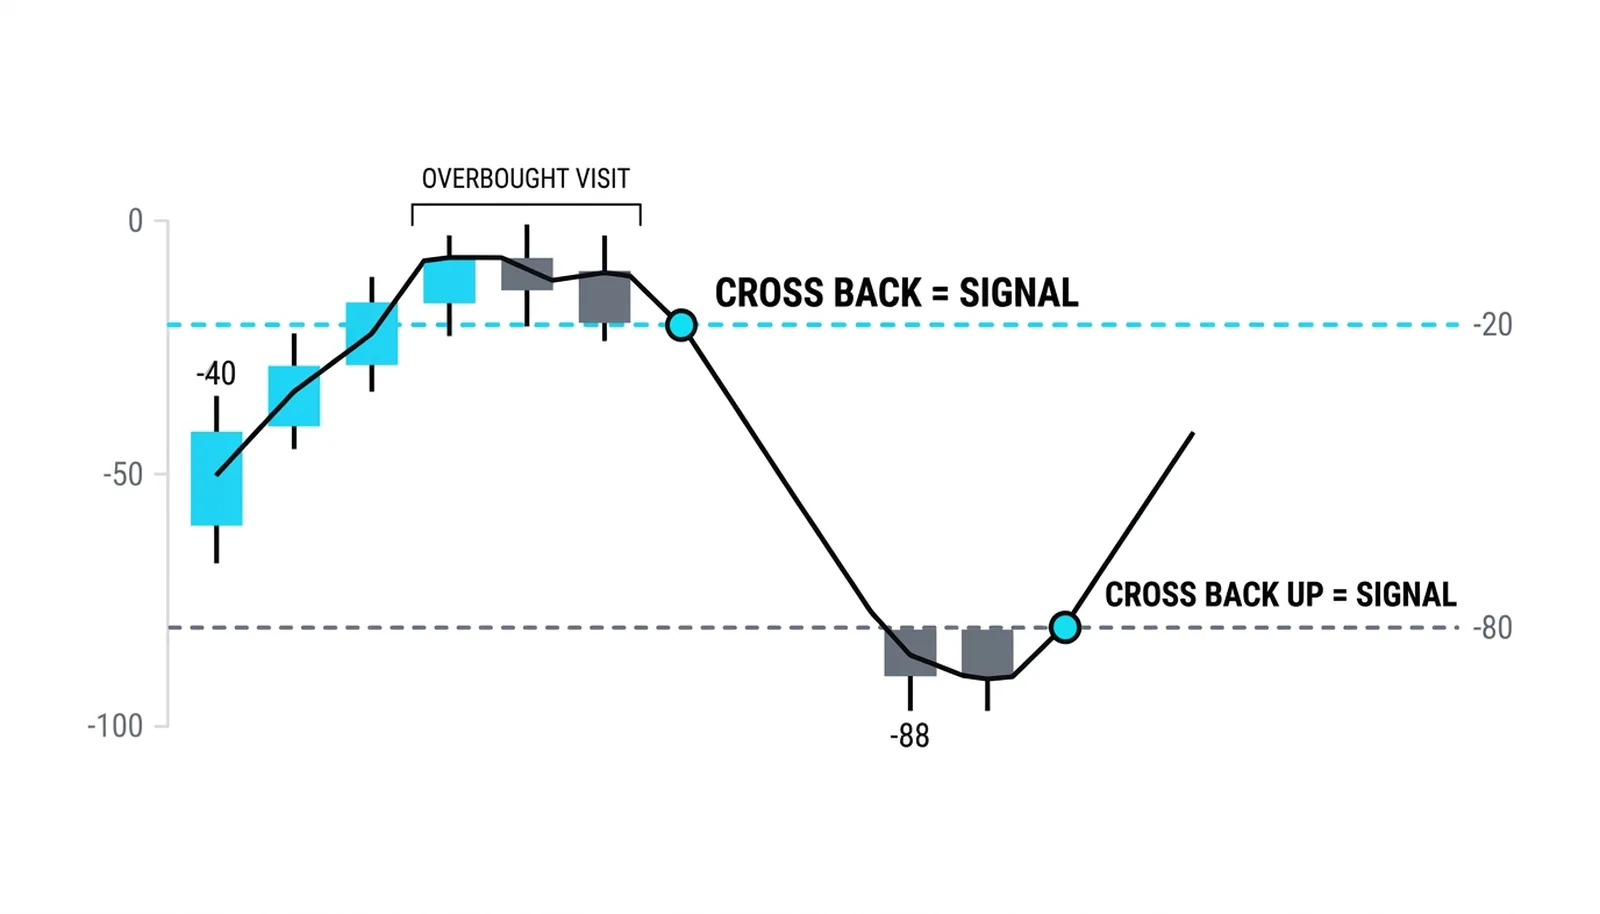
The standard framework uses the minus 20 and minus 80 lines. A push above minus 20 marks an overbought stretch; a drop below minus 80 marks an oversold stretch. The signal most traders watch is the exit, not the entry: %R crossing back down through minus 20 after an overbought visit, or back up through minus 80 after an oversold visit.
Divergence works in the mirror. Price prints a higher high while %R prints a lower peak, meaning each new high closes a little further from the top of its own range. The pattern is identical to stochastic divergence, just upside down, so the stochastic divergence lessons transfer one to one.
Failure swings transfer the same way. The RSI version of that structure, where the indicator fails to reach its prior extreme and then crosses its own midpoint, has a direct %R equivalent around the minus 50 line. The earlier lessons on failure swings carry the full mechanics; the shape is unchanged here.
The regime filter still decides which signals count. The RSI zones lesson owns that logic, and one line covers it: pins in trends behave identically here. In a strong uptrend, %R can live above minus 20 for weeks, and every "overbought" exit signal is noise. In a downtrend, oversold readings stack up without producing bounces. Range-position indicators measure location, and location means different things in different regimes.
Why Use It When the Stochastic Exists
The honest answer: there is no informational edge. %R and %K carry the same data, computed from the same three prices, over the same window. A trader who reads the stochastic fluently gains nothing by switching, and a trader who reads %R fluently loses nothing by ignoring the stochastic.
What actually differs is convention. Some platforms default to Williams %R in their indicator lists, some default to the stochastic, and charting templates inherited from other traders often carry one or the other. You will encounter both, so you need to read both.
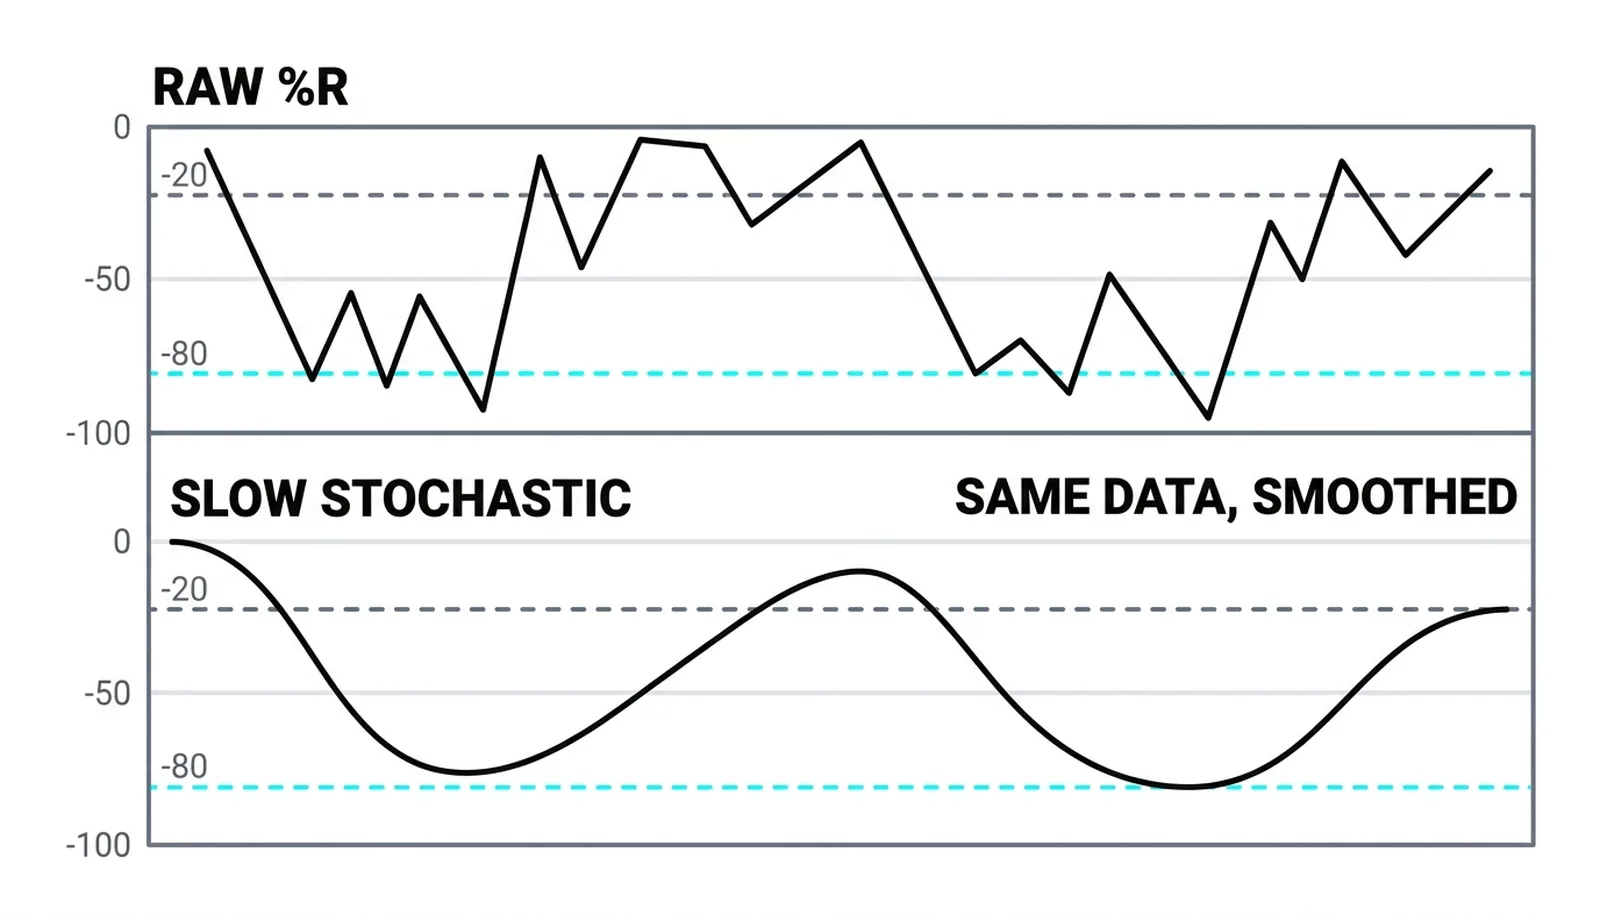
One real difference exists. %R is the raw, unsmoothed line. The stochastic most charts show by default is the slow version, where %K has been smoothed and a signal line added. Raw %R is twitchier than the slow stochastic: it reaches its zones more often, whipsaws more, and produces more false exits. If you compare a %R chart against a slow stochastic and conclude %R "gives earlier signals," you are comparing raw against smoothed, not one indicator against another. Fast stochastic and %R match bar for bar.
One historical footnote worth knowing. Williams's original book printed the value on a positive 0 to 100 scale. Software later standardized on the negative scale, and some platforms add 100 back, which reproduces %K exactly. Before you compare readings across platforms, or against anything written down, check which convention the chart uses. A "75" on one platform and a "minus 25" on another are the same close.
One Reading, Flipped
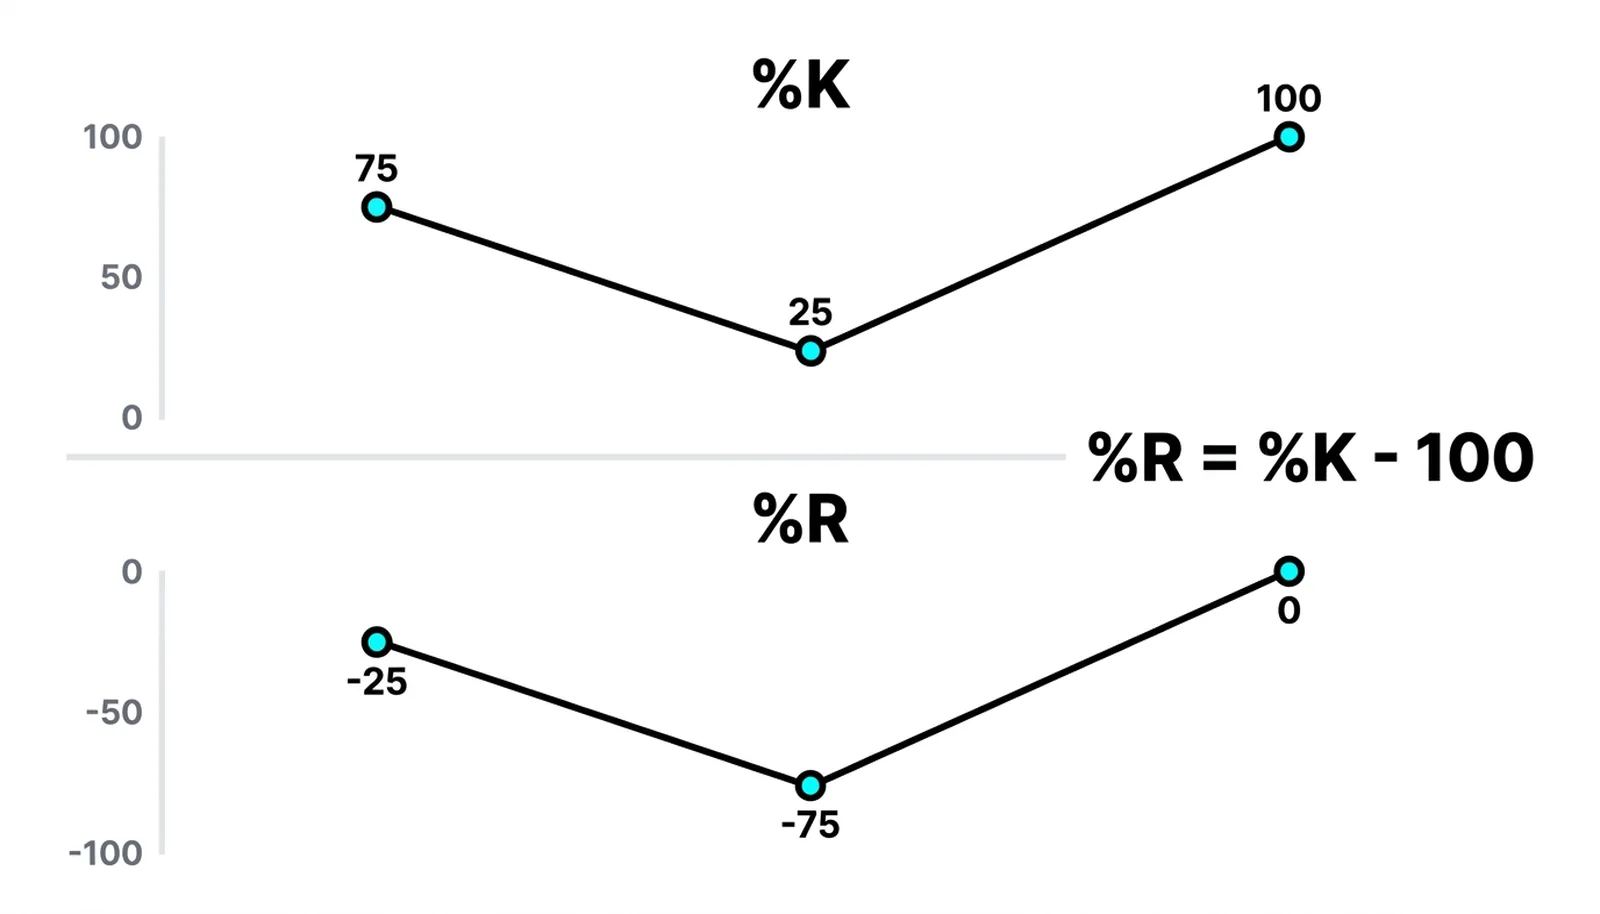
All numbers here are invented and round, purely for illustration. Take a 14-bar window with a highest high of 52 and a lowest low of 44. The range is 8.
The close is 50. Highest high minus close is 2. Two over eight is 0.25, times minus 100 gives a %R of minus 25. The close finished near the top of the range, just inside the upper quarter.
Drop the close to 46. Highest high minus close is 6. Six over eight is 0.75, times minus 100 gives minus 75. The close finished near the bottom, just above the oversold band.
Close at 52, the high itself, and the numerator is zero. %R pins at 0.
Now run the same three closes through the stochastic's %K. Close 50 gives 75. Close 46 gives 25. Close 52 gives 100. Every %R reading is the %K reading minus 100. The mirror is exact.
| %R zone | What the close did | Regime caveat |
|---|---|---|
| 0 to minus 20 | Closed in the top fifth of the 14-bar range | Normal and persistent in strong uptrends; not a sell by itself |
| Minus 20 to minus 50 | Closed in the upper half, off the highs | Neutral territory; watch direction of travel, not the level |
| Minus 50 to minus 80 | Closed in the lower half, off the lows | Neutral territory; a cross of minus 50 often acts as a midline signal |
| Minus 80 to minus 100 | Closed in the bottom fifth of the range | Persistent in strong downtrends; oversold is not a buy by itself |
Williams %R, Answered
What does Williams %R tell you?
It tells you where the latest close sits inside the recent high-low range, on a scale from 0 at the top to minus 100 at the bottom. A reading of minus 30 means the close finished 30 percent of the range below the highest high.
Is Williams %R the same as the stochastic?
Yes, mathematically. %R equals the stochastic's %K minus 100, computed over the same window from the same prices. The practical differences are the flipped scale and the fact that %R is usually shown raw while the stochastic is usually shown smoothed.
What does a reading of minus 95 mean?
The close finished almost exactly at the bottom of the 14-bar range, 95 percent of the way down from the high. It signals an extremely weak close, deep in oversold territory, but in a falling market that condition can repeat for many bars.
What period does Williams %R use?
The default lookback is 14 bars, matching the standard stochastic. Shorter windows make the line faster and noisier; longer windows smooth it and slow its zone entries.
The momentum block closes here. The lessons ahead move from single indicators to stacking them, where the question stops being what one line says and becomes which readings agree, which conflict, and how much weight each deserves.