The Momentum Indicator, Explained
Momentum, as an indicator, is the simplest oscillator you will ever put on a chart: today's close minus the close N bars ago, plotted as a single line around zero. One subtraction. No smoothing, no averaging, no ceiling, no floor. What you see is the raw arithmetic of how far price has traveled over a fixed lookback.

Think of a bike coasting after a push. How much further it rolls each second tells you whether the push is still working or already spent. The momentum line does that for price: it measures the distance covered per fixed stretch of time, and the answer tells you whether the force behind the move is alive or fading.
You already own the concept. The earlier lesson on momentum in price taught you to read thrust and follow-through straight off the candles. This lesson is the plotted version of that idea, the same observation turned into a line so you can read it at a glance and compare it bar by bar.
The One Formula
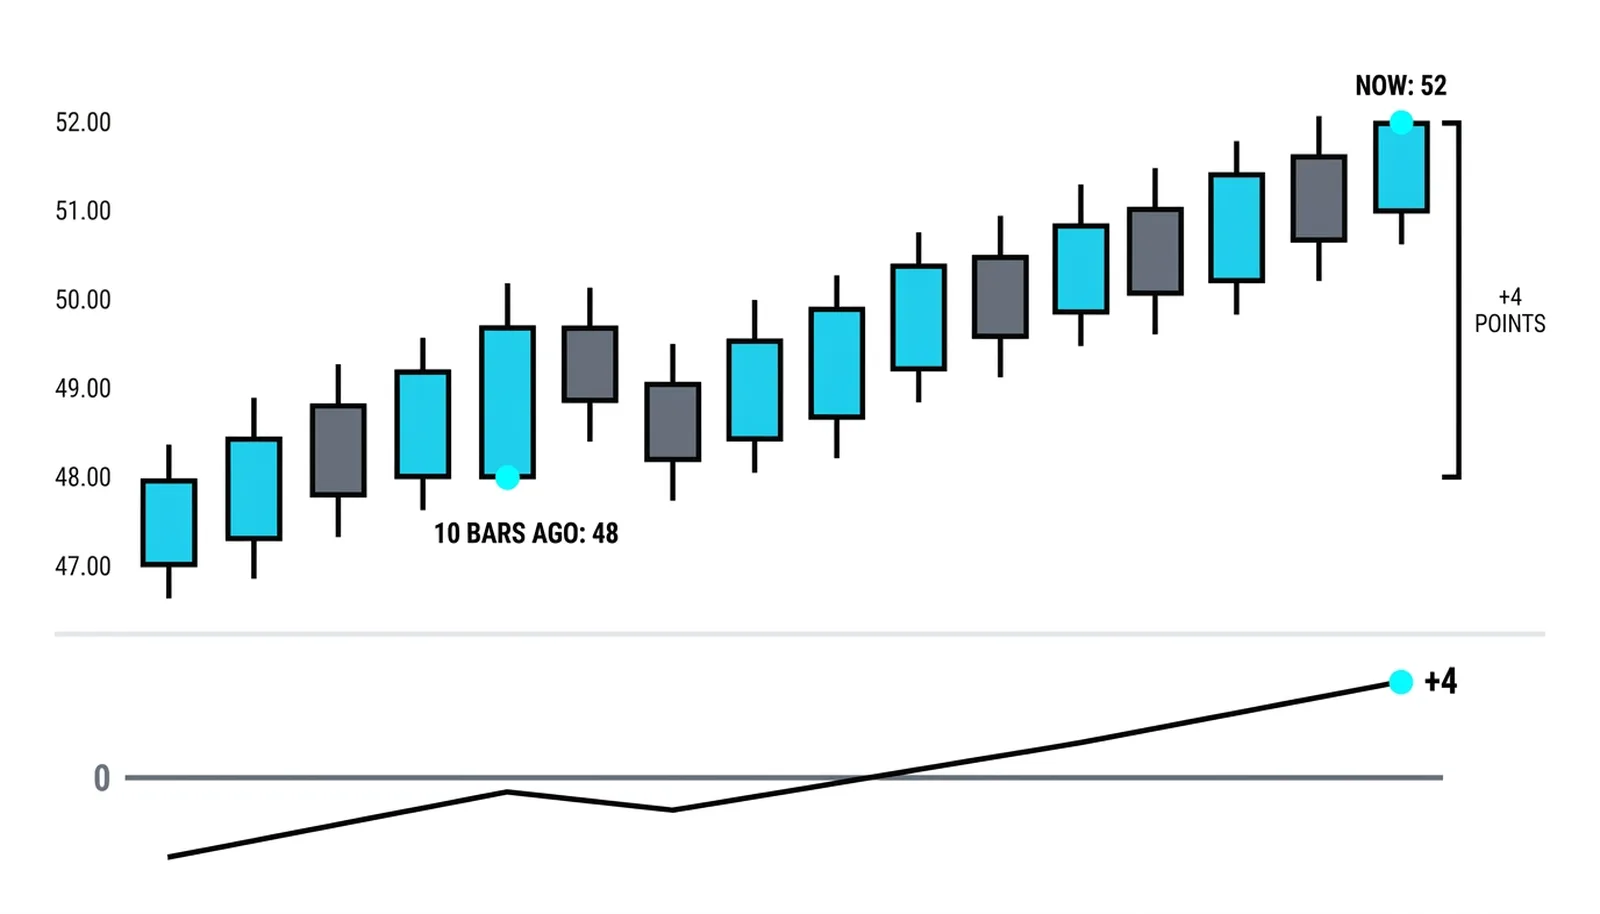
The formula is close today minus the close 10 bars ago, with 10 being the common default period. That is the complete calculation. If the close now is 52 and the close 10 bars back was 48, the indicator prints plus 4. If the close now is lower, the print goes negative.
The output is in price units, and that matters more than most traders realize. A reading of plus 2 on a 20-dollar stock means price climbed 10 percent over the window. A reading of plus 2 on a 200-dollar stock means 1 percent. Same number on the indicator panel, wildly different facts underneath.
This is the limitation the next lesson fixes. Rate of change takes the identical measurement and expresses it as a percentage, which makes readings comparable across markets and across time. Keep this lesson's raw version in mind as the honest ancestor, and let the next one handle the translation.
The Zero Line Does the Work
The zero line is the entire frame of reference. Above zero, the current close sits higher than the close N bars ago, so the net force over the window points up. Below zero, the close sits lower, and the net force points down.
Zero-line crosses mark force flips. When the line moves from negative to positive, the market has gone from lower closes over the window to higher ones. That is a shift in who won the last stretch of bars, stated in the plainest possible terms.
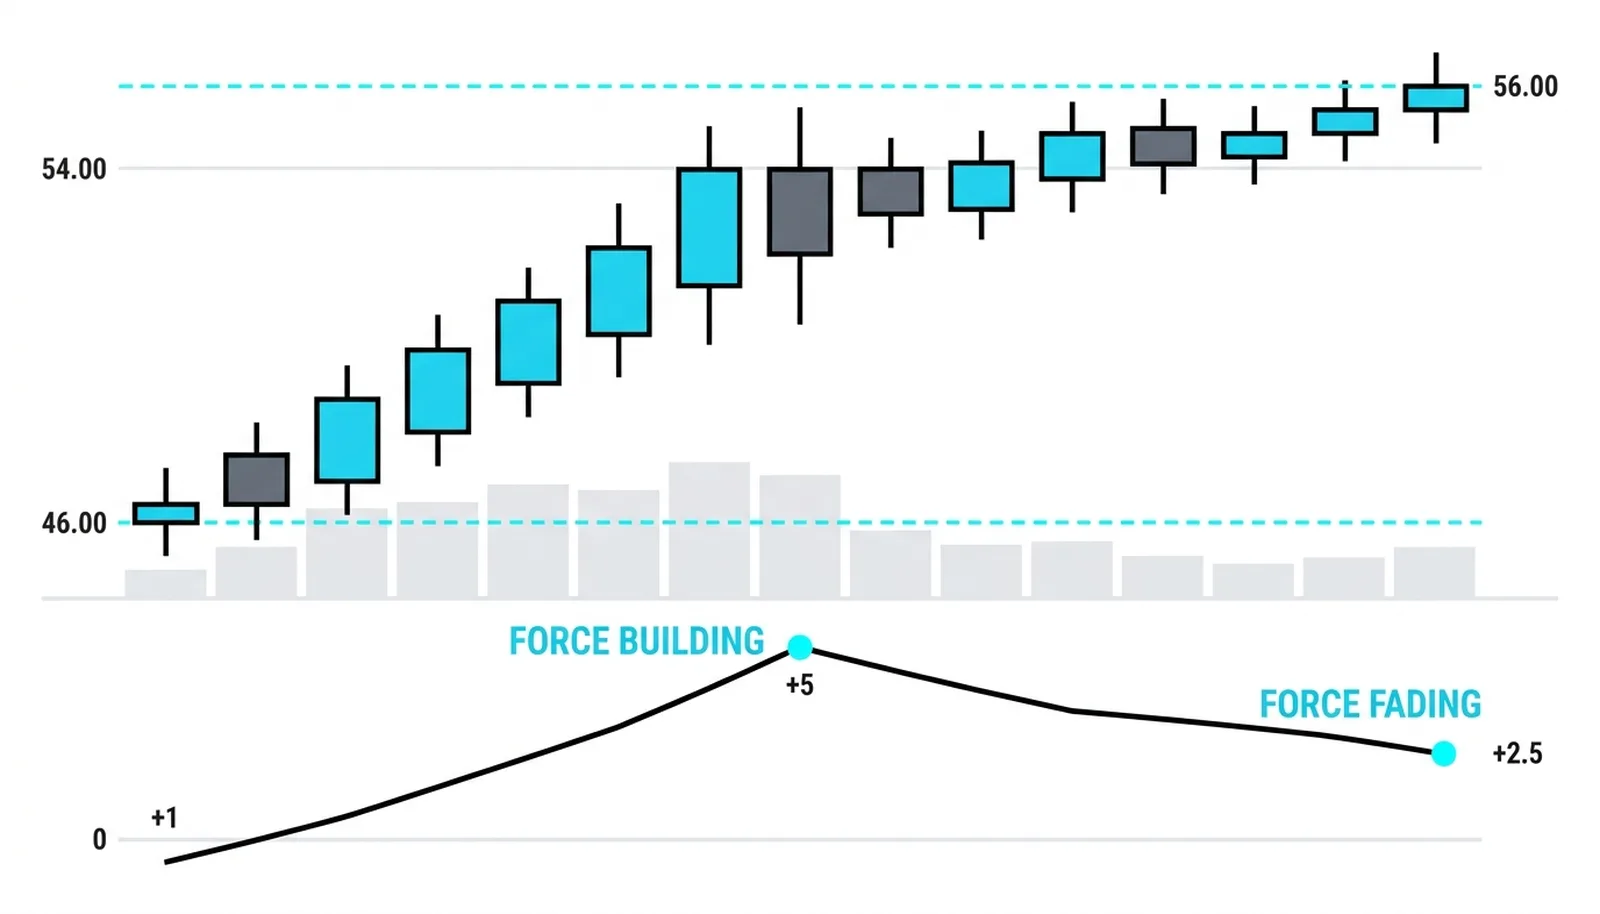
The slope of the line itself is the second read, and many traders skip it. A rising line above zero means force is building: each new bar covers more ground than the one dropping off the back of the window. A falling line above zero means force is fading even while price still climbs. Price up, thrust down. That combination is an early warning, not a sell signal by itself, but it changes how much trust you put in the next push higher.
Momentum Peaks and Divergence
Strong trends often show their hardest push early. The first surge off a low produces the biggest 10-bar gain, and later pushes, even to higher prices, cover less ground per window. The result is a line printing lower peaks while price grinds to new highs.
That mismatch is divergence, and the reading transfers directly from the RSI lesson. Price makes a new high, the momentum line makes a lower high, and the gap between the two is the market telling you the move is running on stored energy rather than fresh force. The divergence lesson's pattern applies to this line one-for-one, so if you worked through that material, you already know the drill.
One related pointer: the MACD histogram you studied earlier is essentially smoothed momentum of the MACD lines, the same idea of measuring force changes, run through averages. What the histogram does with layers of smoothing, this line does naked. Reading one well makes the other easier to trust.
Where the Raw Version Bites
The indicator is unbounded and price-scale dependent, and those two traits bite in practice. There is no 70 or 30 to lean on, no fixed band that means overbought. A single gap bar can spike the reading to a number that looks extreme and means almost nothing, because one close landed far from the close 10 bars back.
Thresholds never transfer between markets. A reading that counts as a hard push on one stock is routine noise on another, and meaningless on a currency pair quoted in fractions. Any level you mark on this indicator belongs to that instrument, that timeframe, and that period of history. Nothing else.
So why do traders keep it? Because nothing stands between you and the subtraction. There is no smoothing lag delaying the signal, and no normalization hiding the size of the move behind a tidy 0-to-100 scale. When the line jumps, you know exactly which two closes produced it, and you can check them with your eyes. Some traders would rather handle a blunt honest tool than a polished one that quietly reshapes the data.
One Subtraction, Read Three Ways
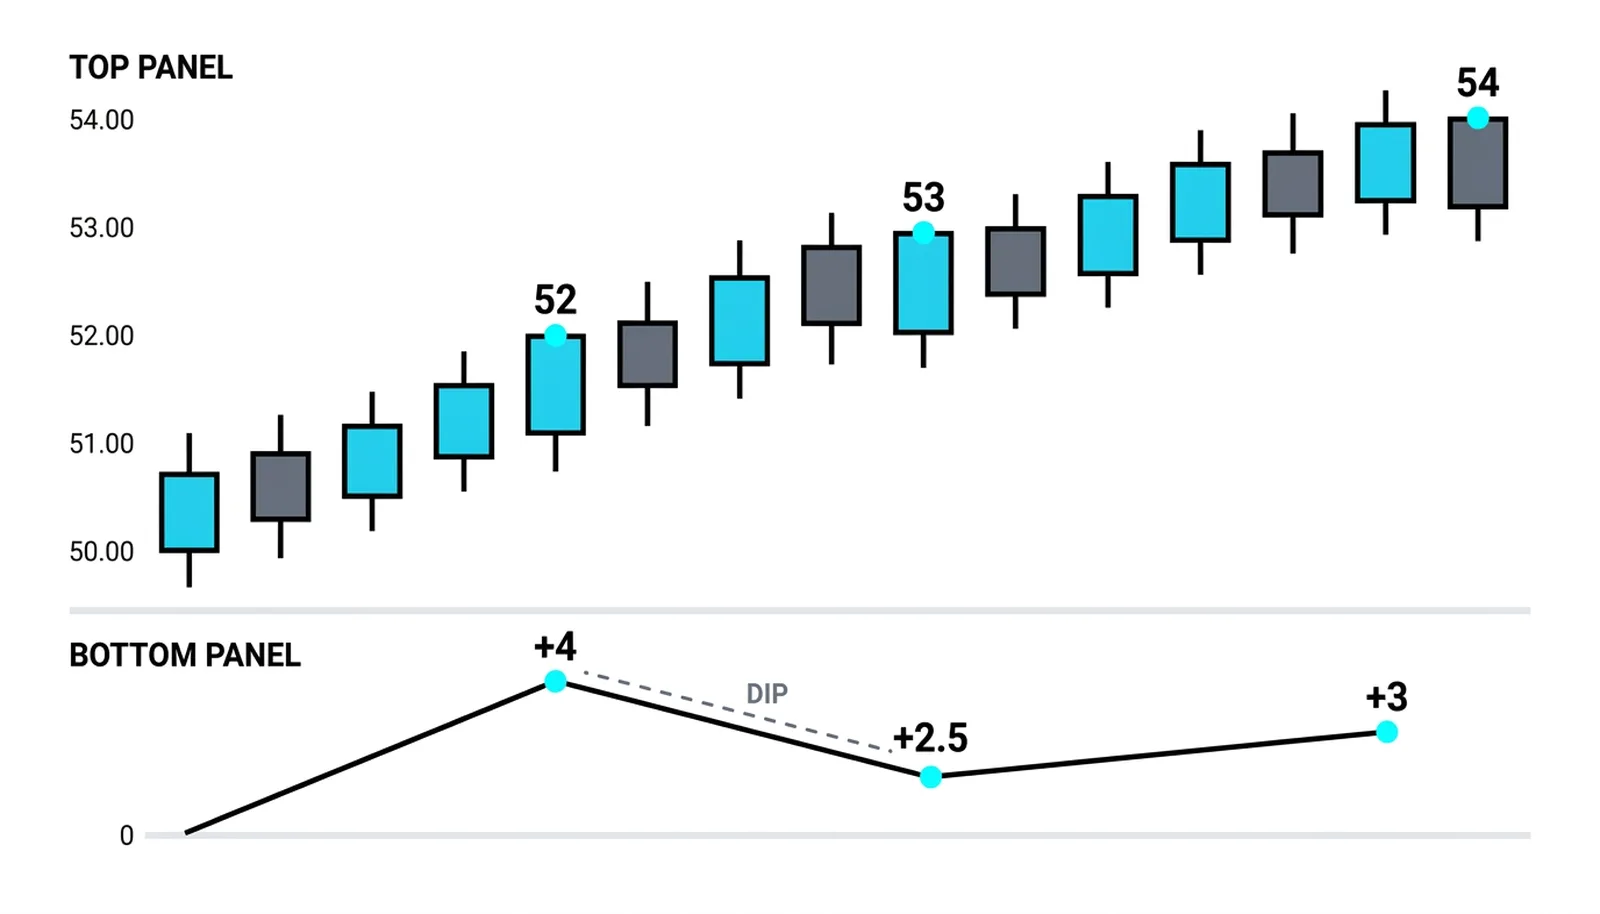
All numbers here are invented round figures for illustration. Take a stock that closes at 52, with a close of 48 ten bars ago. Momentum prints plus 4. Force is clearly positive.
Two bars later the close is 53, and the close 10 bars back is now 50.5. Momentum prints plus 2.5. Price made a higher high, but the line fell. Force is fading while price still climbs, the exact setup from the slope read.
Then the close prints 54 against 51 ten bars back. Momentum is back to plus 3. Force re-accelerated, and the new high now has fresh push behind it instead of leftover energy. Notice that price rose through all three reads while the line fell, then recovered. The line told you something price alone did not.
Finally, picture a long decline. The line has been negative for weeks. Then a series of stabilizing closes lifts it through zero to plus 0.5. That tiny positive print ends a long minus streak and marks the first window in weeks where closes net out higher. Small number, large information.
| Momentum line | What price is doing | What the force says |
|---|---|---|
| Above 0 and rising | Climbing, gains per window growing | Force building, trend has fresh push |
| Above 0 and falling | Still climbing, gains per window shrinking | Force fading, move running on stored energy |
| Below 0 and falling | Declining, losses per window growing | Downside force building |
| Below 0 and rising | Still lower, losses per window shrinking | Selling force fading, possible base forming |
Momentum, Answered
What does the momentum indicator measure?
It measures the raw distance between today's close and the close N bars ago, in price units. It answers one question: how much ground did price cover over the lookback window, and in which direction.
What does a zero-line crossover mean?
A cross above zero means closes now net out higher than they did N bars ago, so the force over the window has flipped positive. A cross below zero means the opposite. It is a regime change in the simplest possible terms, not a guaranteed entry.
Is momentum the same as rate of change?
They measure the same thing in different units. Momentum subtracts and reports the difference in price terms; rate of change divides and reports it as a percentage. The percentage version is what allows fair comparison across markets, and it gets its own lesson next.
What period does the momentum indicator use?
Ten bars is the common default, but there is no magic in it. Shorter periods react faster and whipsaw more; longer periods smooth the read and respond slower. Whatever you choose, keep it fixed while you learn how the line behaves on your market and timeframe.
Next up is rate of change, the same measurement wearing percentage clothing. Once you can read both, raw units for honesty and percent for comparison, the momentum block of this level is complete and you will know exactly which version to reach for and why.