Stochastic Divergence, Explained
Divergence is the single most useful thing an oscillator can show you, and the stochastic shows it more often than any other common indicator. Stochastic divergence is the same mismatch the RSI lesson covered: price prints a new extreme, the oscillator refuses to confirm it. What changes here is the math underneath, and the math changes the behavior.

Think of two reporters filing the same story from different desks. The facts match, but the framing differs, and the framing tells you who got ahead of the news. The RSI and the stochastic are those two reporters. The RSI lesson in this batch covered the divergence pattern itself; this lesson covers what the stochastic adds to it and where it lies to you. The intro and %K/%D lessons explained the lines; the one detail that matters here is saturation, which we will get to. Later mastery lessons in this level generalize divergence across every oscillator, treating it as one family of signal rather than five separate tricks.
Bearish and Bullish, On This Oscillator
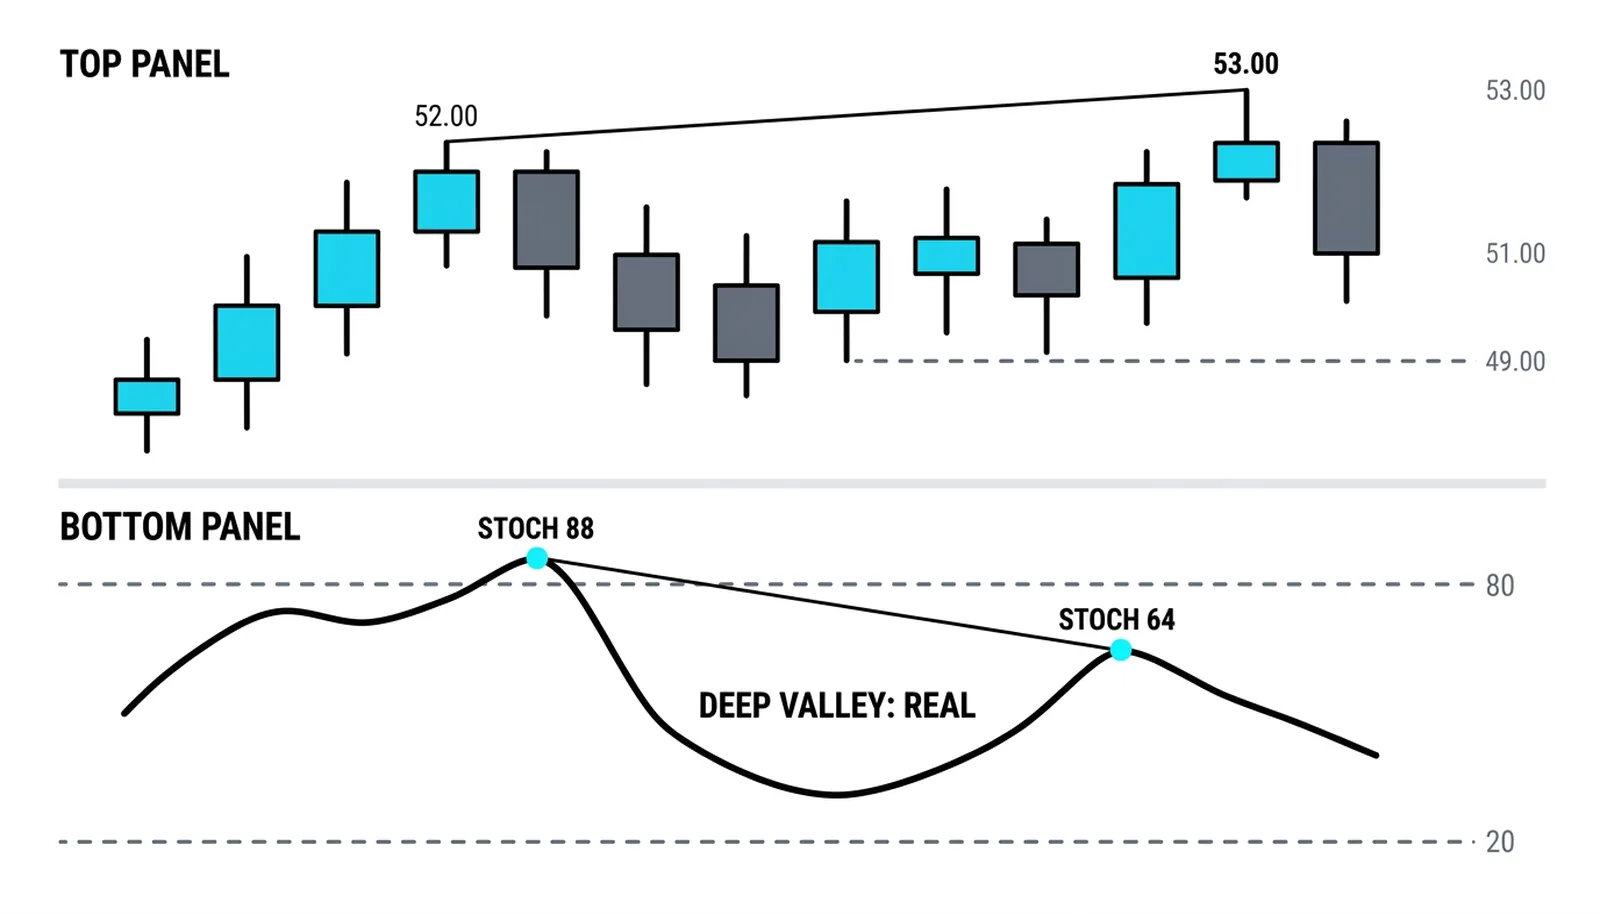
Bearish stochastic divergence looks like this: price makes a higher high, but the stochastic makes a lower high below the 80 line. The buying pushed price further, yet each close sat lower within its own recent range. Position ran out before price did.
Bullish divergence is the mirror. Price makes a lower low, but the stochastic makes a higher low above the 20 line. Sellers pushed price to a new extreme while the closes crept up inside their ranges. The selling was losing quality before it lost the headline number.
That phrase, position running out before price, is the core mechanic. The stochastic does not measure how far price traveled. It measures where the close sits inside the recent high-low range. A market can print a new high on a close that is weak relative to its own bar, and the stochastic catches that immediately.
Bluntly: divergence is a warning, never an entry. Price confirms or the signal is decoration.
Why It Diverges Earlier
The stochastic reacts to range geometry as much as direction. That is why its divergences arrive earlier and sharper than RSI divergences on the same chart.
Picture a market grinding upward in a tightening range. Each new high is a little smaller than the last push. The closes, even on the higher highs, land in the middle of their bars instead of at the top. The stochastic reads that instantly and prints a lower peak, while the RSI, which weighs the size of up-moves against down-moves, may still look healthy.
This is a genuine edge in slow, rolling tops, the kind where price keeps making marginal new highs for weeks. The stochastic often flags the exhaustion several bars before anything else does.
The cost of that sensitivity is noise. An indicator that reacts to small changes in range geometry will also react to meaningless ones. You trade early warnings for a higher false-alarm rate, and you should accept that trade consciously rather than discover it in your P&L.
The Saturation Problem
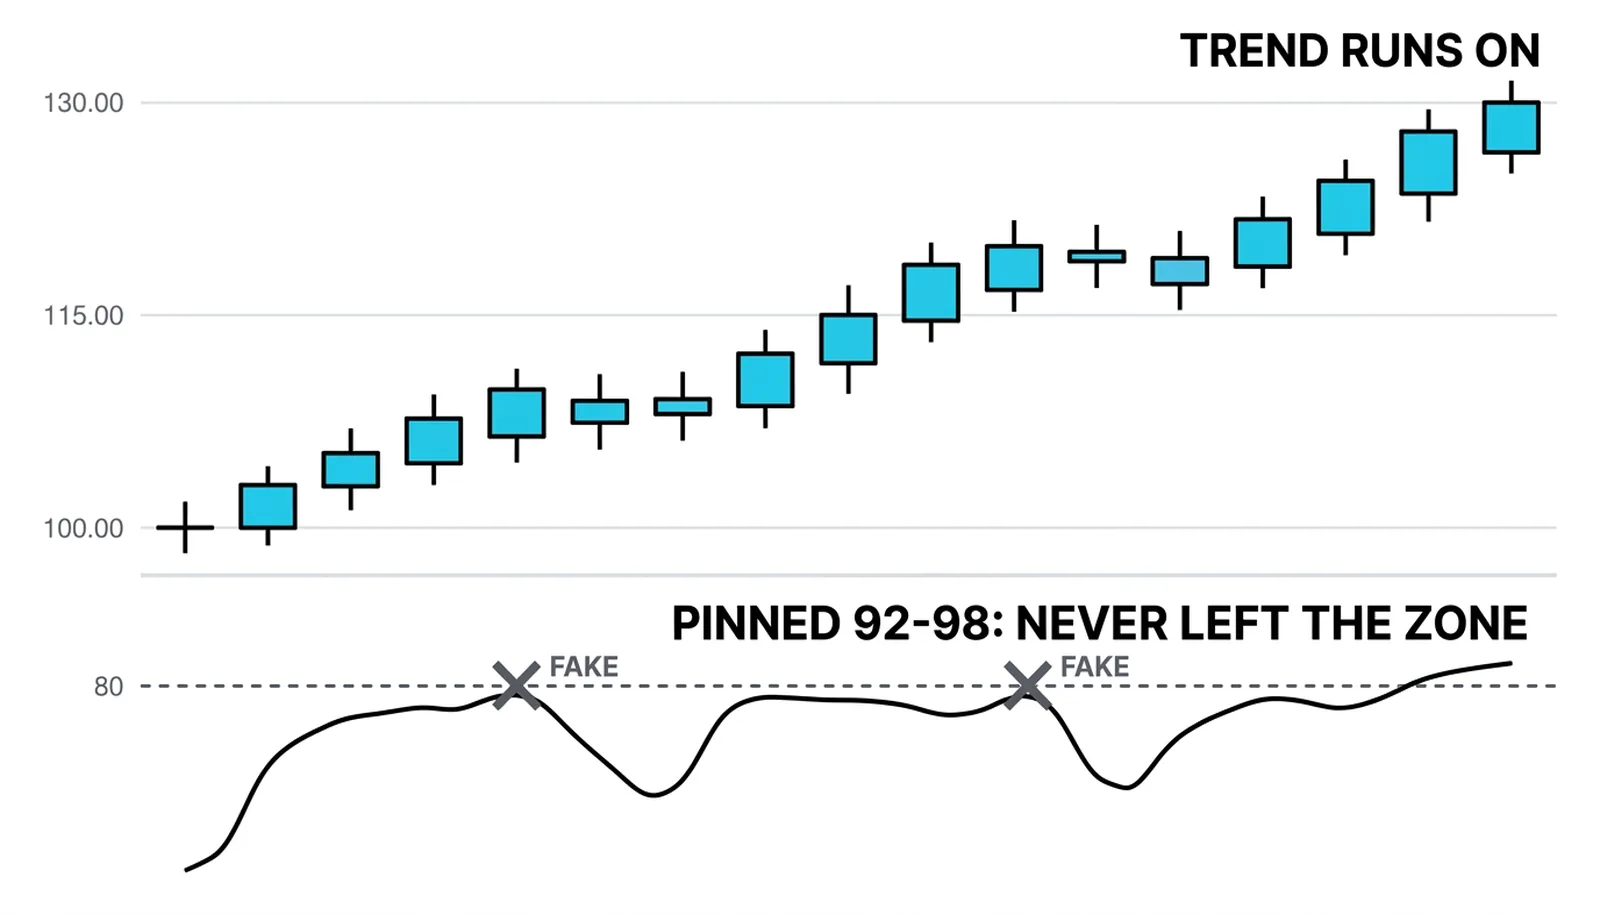
In a runaway trend, the stochastic pins at the extreme and stays there. During a vertical rally it can sit at 95 or above for bar after bar, because every close lands near the top of its range. That is what the indicator is supposed to do in a strong trend.
The trap is what happens next. Every minor pause, every single soft close, drags the %K line down a few points while price barely flinches. Then price pushes to another new high and the stochastic recovers to a slightly lower reading. On paper, that is a textbook bearish divergence. In practice, it is a strong trend breathing.
These fake divergences stop traders out of good positions and sucker them into countertrend shorts. A pinned oscillator will generate them repeatedly, and each one looks cleaner than the last.
The filter is simple: only read a divergence when the oscillator actually left the extreme zone between the two peaks. If the stochastic dipped from 96 to 88 and back, that is saturation noise. If it fell from 88 to 55 and then failed to reclaim 80 on the next price high, that is a real loss of position. The depth of the valley between the two oscillator peaks is what separates signal from static.
Using Both Oscillators Together
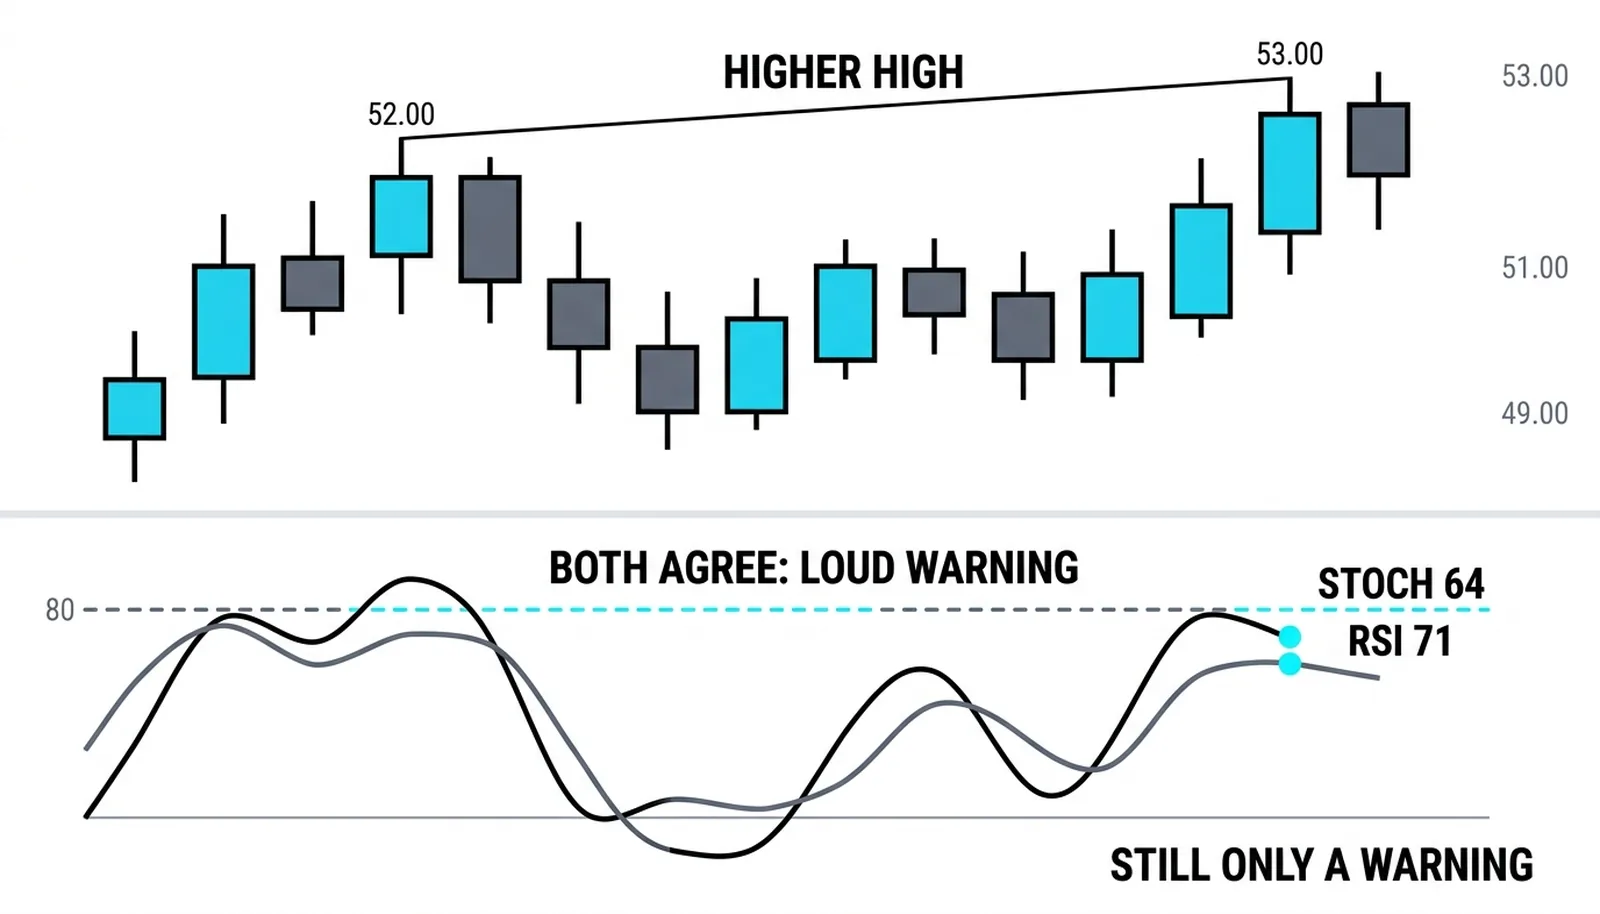
RSI and the stochastic diverging on the same bars is a louder warning than either one alone. They measure different things, so agreement between them means the weakness shows up in both momentum and range position. That overlap filters out most of the stochastic's hair-trigger fakes.
Disagreement usually means noise. If the stochastic prints a lower high but the RSI confirms price's new high with one of its own, the default read is that the trend is intact and the stochastic twitched. You can note it and wait, but you do not act on it.
Keep the order of operations fixed: warning first, price trigger second. Divergence, from one oscillator or two, only ever earns the right to watch for a trigger. The trigger is price behavior, a break of a short-term low, a failed retest, a close back inside the old range. Traders who short the divergence itself are betting on a forecast. Traders who wait for price to agree are betting on evidence.
A Tightening Top, Caught Twice
Everything below is a hypothetical illustration with round numbers.
A stock rallies and peaks at 52, with the stochastic reading 88. Over the next two weeks it drifts in a range between 49 and 51. Then buyers push it to a new high of 53, but the close is mid-bar, and the stochastic prints 64. Higher high in price, lower high in the oscillator, with a deep valley between the two peaks. That is a clean bearish divergence.
The RSI on the same bars reads 79 at the first peak and 71 at the second. Both oscillators agree. The warning is now loud, but still only a warning. The trigger arrives when the stock closes back below 49, the floor of the drift range. A trader acting on that sequence, divergence, agreement, trigger, is short with a defined invalidation above 53.
Now the counter-case. A different stock is in a vertical run. The stochastic pins between 92 and 98 for ten straight bars. Twice during that run, a single soft close drags the oscillator down a few points and price's next high prints a marginally lower stochastic reading. Two textbook divergences. A trader who shorted either one gets stopped out as the trend continues. When the real turn finally comes, the oscillator has already fallen near 40 on the first genuine break, and the entry signal comes from price structure, not from any divergence at all.
| Pattern | What it looks like | The honest read |
|---|---|---|
| Bearish divergence | Price higher high, stochastic lower high below 80, deep valley between peaks | Position ran out before price; watch for a downside trigger |
| Bullish divergence | Price lower low, stochastic higher low above 20 | Selling lost quality; watch for an upside trigger |
| Pinned-at-extreme fake | Oscillator stuck above 90, shallow dips on tiny pauses | Saturation noise in a strong trend; ignore it |
| Both oscillators agreeing | Stochastic and RSI both print lower highs against price's higher high | Loud warning; still requires a price trigger before acting |
Stochastic Divergence, Answered
What does stochastic divergence look like?
Price makes a new high or low while the stochastic fails to make its own matching extreme. Bearish divergence is a higher high in price against a lower stochastic high below 80. Bullish divergence is a lower low in price against a higher stochastic low above 20. The deeper the oscillator's dip between the two peaks, the more meaningful the signal.
Why does the stochastic diverge more often than RSI?
Because it measures where the close sits inside the recent range rather than comparing average gains to average losses. Small shifts in close location, which mean little to the RSI, move the stochastic sharply. That sensitivity produces earlier signals and more false ones, in equal measure.
Is stochastic divergence reliable in strong trends?
No, and this is its biggest weakness. In a runaway trend the oscillator pins at the extreme and prints repeated fake divergences on ordinary pauses. Only trust a divergence when the stochastic clearly left the extreme zone between peaks, and even then, wait for price to confirm.
Should I confirm stochastic divergence with RSI?
Yes, when both are on your chart anyway. Agreement between the two filters out most saturation fakes and raises the quality of the warning. Disagreement usually means the stochastic twitched on noise. Either way, the final confirmation is always price itself breaking structure.
With both oscillators now in your toolkit, the next lessons move from reading indicators one at a time to stacking them into confluence, where divergence becomes one vote among several rather than a standalone call.