How to Use RSI Overbought and Oversold
Overbought and oversold are the two most misread labels on any indicator: they do not mean sell and buy. They mark where momentum has stretched relative to recent history, nothing more. The same reading means opposite things depending on the regime. In a strong trend, an overbought print is usually the trend working. In a range, it is often the edge doing its job.

Think of a car tachometer. The redline marks strain, but cruising at high revs in top gear on an open highway is just the engine doing its job. The number only becomes a warning when the context says the engine should not be working that hard.
The earlier RSI lesson covered the construction, where the 70 and 30 lines came from, and the range shift between 40-80 in uptrends and 20-60 in downtrends. This post is about what to do with the zones once you can read them.
What Overbought Actually Says
An overbought reading says momentum has stretched to the upside. Buyers have pushed hard, and few sellers have shown up to push back. That is a description of the recent past, not a prediction of the next candle.
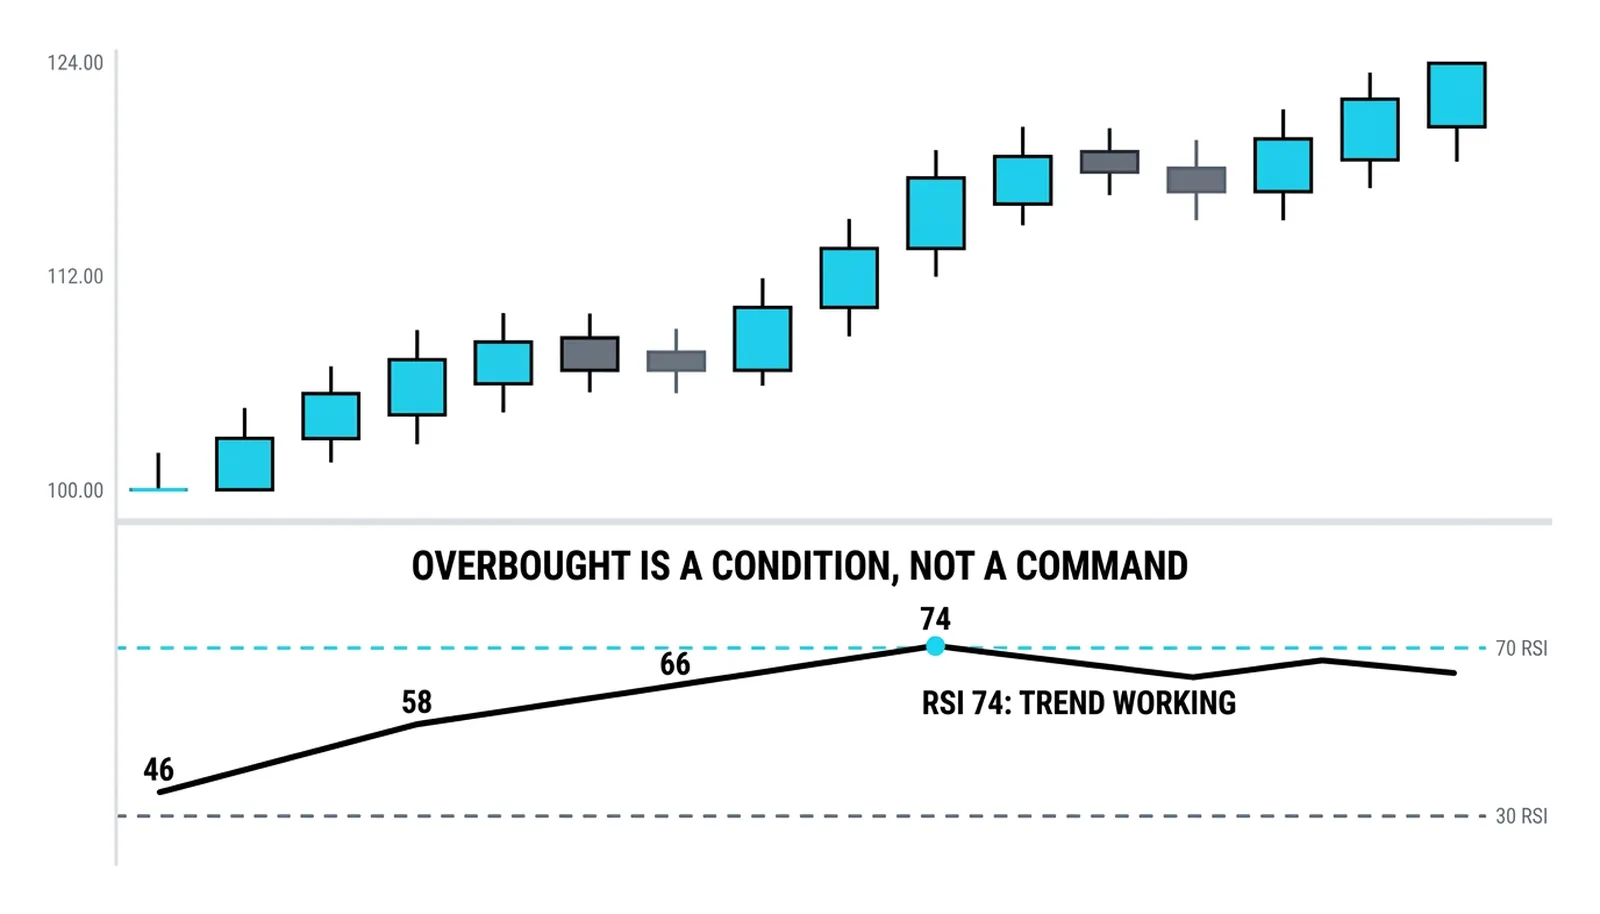
Inside an uptrend, an RSI of 75 is usually the trend expressing itself. Strong trends live in the upper half of the scale. Price rises on most sessions, gains outsize losses, and the formula keeps printing high numbers. The reading is a confirmation, not a warning.
Traders who treat 70 as an automatic sell learn an expensive lesson. They exit a winning position early, watch the trend continue without them, and often re-enter higher out of frustration. The indicator did its job. The interpretation failed.
The blunt version: overbought is a condition, not a command.
The Range Rule: Where the Lines Earn Their Keep
The 70 and 30 lines earn their keep in sideways markets. In a range, price oscillates between a floor and a ceiling, and momentum stretches at the edges where the excursion is about to be capped. That is where an extreme reading carries real information.
The logic is structural. A range exists because buyers and sellers have agreed, roughly, on a band of fair value. When price reaches the top of that band and RSI prints 70 or higher, two things are true at once: momentum is stretched, and price is at the level where sellers have historically appeared. The reading and the level agree.
This is where the support and resistance lessons connect. An extreme RSI reading means most when price is also at a level. The zone alone is weak evidence. The zone plus a range edge is a tradeable setup, because the range edge gives you a defined place to be wrong.
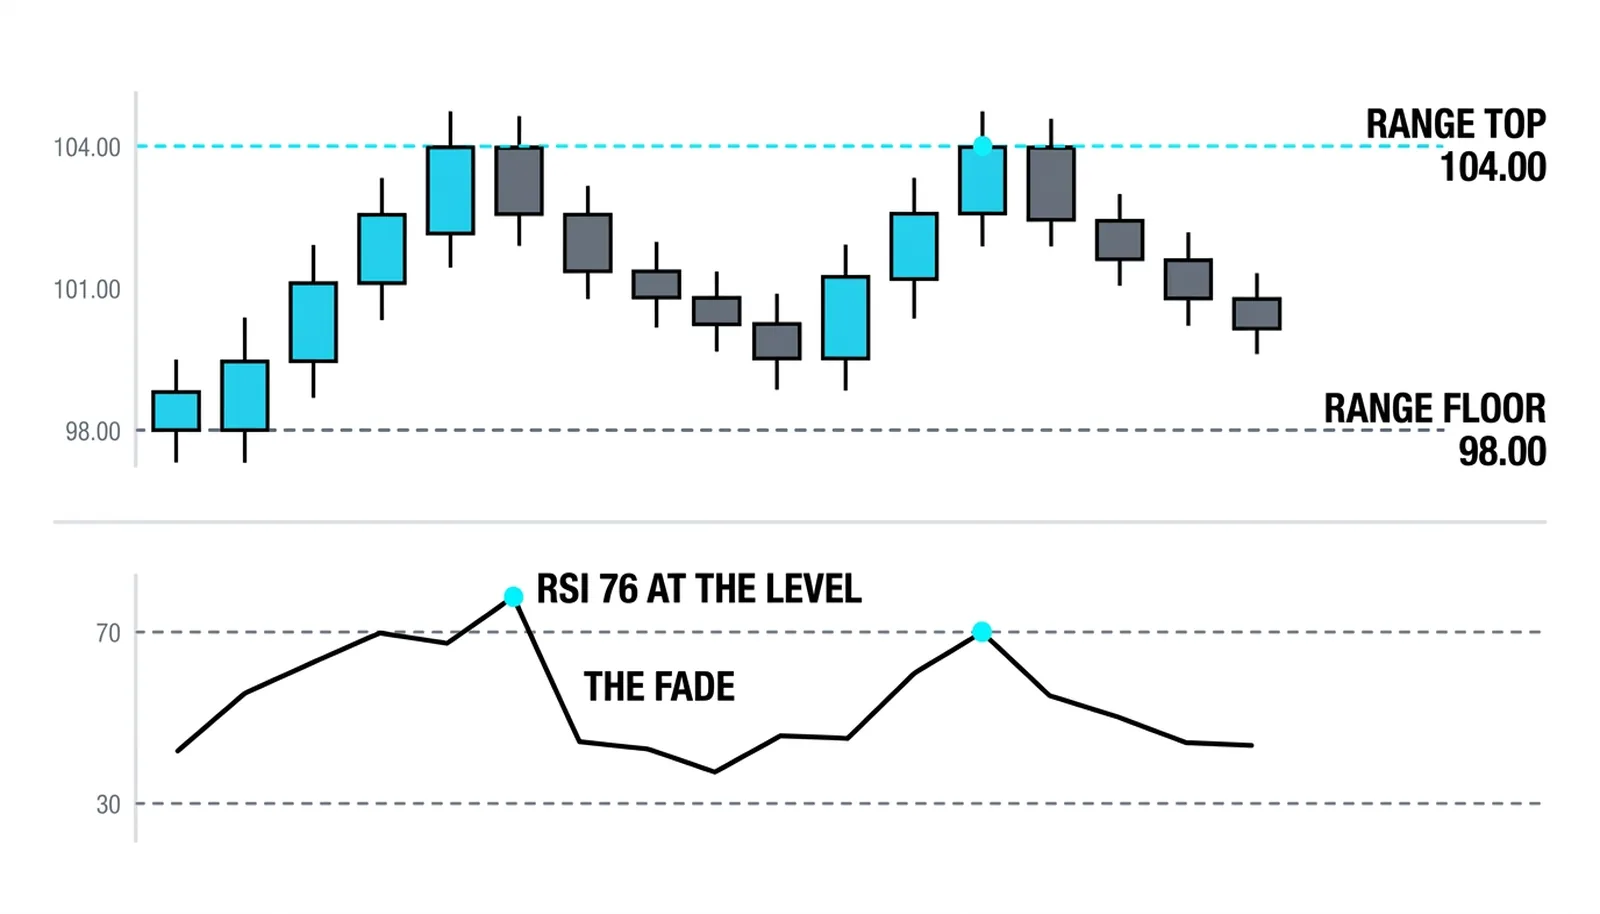
In practice, the fade works like this: price tags the range high, RSI pushes above 70, and the trader sells against the level with a stop just beyond it. The range does the heavy lifting. RSI is the timing layer.
The 50 Line: The Trend Filter
The middle of the scale gets ignored, and that is a mistake. The 50 line is a simple regime filter. Above 50, buyers control the recent average. Below 50, sellers do.
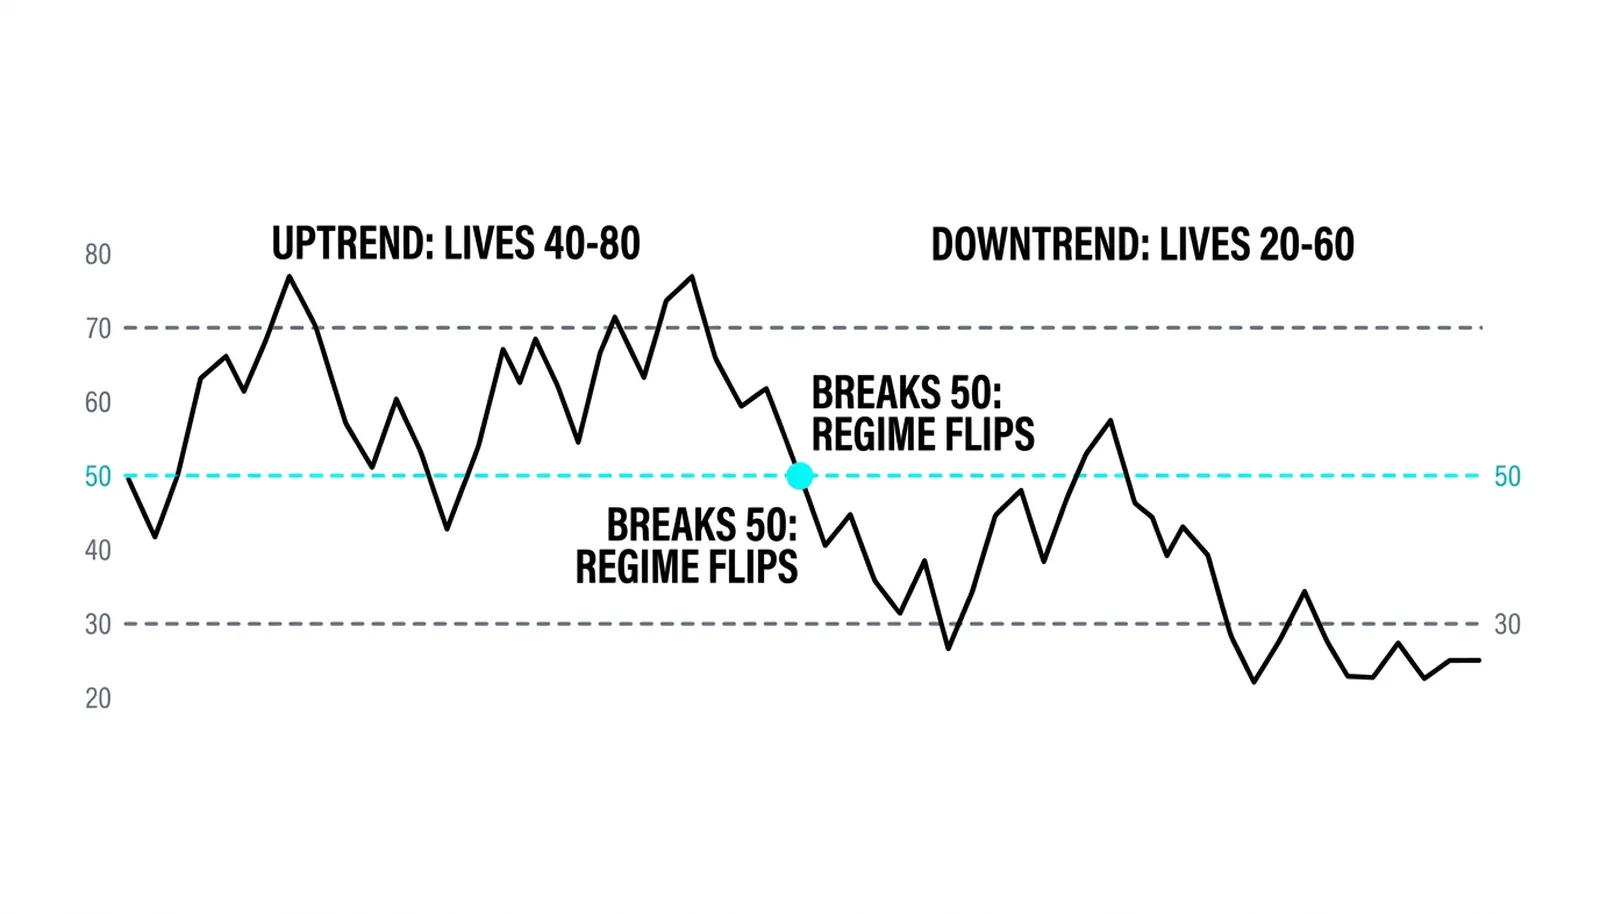
Combine that with the range shift from the earlier lesson. In an established uptrend, RSI tends to hold between roughly 40 and 80. Pullbacks dip toward the 40-50 zone and stall. Rallies push past 70 without consequence. So the interesting moment in an uptrend is not the overbought print. It is the dip toward 40-50, where momentum has cooled but the trend's floor is intact.
In a downtrend the picture flips. RSI lives between roughly 20 and 60. Rallies stall near 50-60, and that is the zone where sellers reload. The 50 line tells you which side of the scale deserves your attention.
Before you interpret any extreme reading, check where RSI has been living. The zone it respects tells you the regime. The regime tells you what the extreme means.
The Mistakes the Zones Invite
The first mistake is fading a 75 in a strong trend. The trader sees the number, assumes a reversal, and sells into momentum that has no obligation to stop. Trends can hold overbought readings for weeks. The reading was stretched the whole way up.
The second mistake is treating 70 and 30 as symmetric truths in every regime. In an uptrend, 30 may never be reached and 70 may be routine. In a downtrend, the reverse. Applying one fixed map to every market is how a useful tool becomes a loss generator.
The third mistake is reading the number before reading the chart. Regime comes first. Is price trending or ranging? Only then does the RSI print mean anything. A trader who checks the indicator before the structure has the order backwards.
One more honest point: a reading is context, not a trigger, and the lesson on why indicators alone are not a strategy already made that case in full.
One Reading, Two Markets
These numbers are invented and round, purely to illustrate the point.
Stock A is in a clean uptrend. Over several weeks, RSI walks from 46 to 58 to 66 to 74, then holds in the high 60s for two more weeks while price keeps climbing. A trader who sold at 74 exited a working trend. The RSI floor near 40 never broke, so the regime never changed. The overbought print was the trend doing its job.
Stock B is in a range between 98 and 104. Price rallies to 104, the range top, and RSI spikes to 76. Within days, RSI snaps back to 48 and price retreats toward the middle of the band. The fade at the range top worked. Same indicator, same reading, opposite outcome.
The regime decided both results. In the trend, the extreme was noise. In the range, the extreme plus the level was the trade.
| RSI Zone | Inside an Uptrend | Inside a Range |
|---|---|---|
| Above 80 | Strong trend acceleration; normal in powerful moves, not a sell signal by itself | Rare; price likely testing or exceeding the range high, watch the level closely |
| 60 to 80 | The trend's home territory; pullbacks that hold here keep the trend intact | Upper half of the swing; momentum stretched only meaningful near the range top |
| 40 to 60 | Pullback zone; dips toward 40-50 are where trend entries often set up | The dead middle; no edge, price is between the levels that matter |
| 20 to 40 | Warning; uptrends rarely visit here, a break below 40 suggests regime change | Lower swing zone; oversold readings matter near the range low |
| Below 20 | Trend likely broken; treat the uptrend assumption as failed until proven otherwise | Extreme stretch at or below the range floor; potential fade zone with the level |
Overbought and Oversold, Answered
Does overbought mean the price will fall?
No. Overbought means momentum has stretched upward relative to recent history. In a trend, price can stay overbought for weeks while continuing to rise. Only in a range, ideally at a level, does the reading carry fade potential.
What should I do when RSI crosses 70?
Check the regime before doing anything. If price is trending up, a cross above 70 is usually confirmation, not a sell signal. If price is ranging and sitting at the range high, the cross is a candidate fade with a defined stop beyond the level.
Why do traders use 80 and 20 in trends?
Because trends shift the whole scale upward or downward. In a strong uptrend, RSI rarely reaches 30, so 70 loses its meaning as an extreme. Moving the lines to 80 and 20 re-marks where genuine exhaustion sits inside that regime.
Can the zones be combined with support and resistance?
Yes, and they work better that way. An extreme RSI reading at a known level is far stronger evidence than the reading alone, because the level gives the trade structure and a clear invalidation point.
The next lessons take the same momentum logic further: RSI divergence, where price and the indicator disagree, and failure swings, where the indicator's own structure breaks before price does. Both build directly on the regime thinking covered here.