CCI: The Commodity Channel Index
The CCI, short for Commodity Channel Index, measures how far today's typical price sits from its own recent average, scaled by how much the price usually deviates from that average. Donald Lambert introduced it in 1980, and the output is best read as a statistical surprise meter: a big number means today is unusual relative to recent behavior, a small number means today is ordinary.

That makes CCI a different tool from the position dials you met earlier in this level. The Stochastic lessons own the question of where price sits inside its recent range. CCI asks a different question entirely: how far has price drifted from its own average, in units of its own normal wobble. Think of it like a test graded on a curve, where what matters is how far your score sits from the class average relative to how spread out the class usually is. One average, one yardstick, one distance.
CCI belongs to the momentum family from the four categories lesson, and it behaves like a momentum tool in every way that follows.
The Formula: Deviation, Scaled
The calculation has four steps, and each one earns its place.
First, compute the typical price for each bar: high plus low plus close, divided by three. This gives a single representative price per bar that weights the whole bar rather than only the close.
Second, take the difference between today's typical price and its 20-bar simple moving average. That difference is the raw deviation, the part that answers "how far from normal."
Third, divide that difference by the mean absolute deviation of the typical price over the same window. This is the scaling step. A market that normally swings wide gets a wide yardstick, so a big absolute move in a jumpy market scores lower than the same move in a quiet one.
Fourth, multiply by 1 over 0.015. Lambert chose that constant so that roughly 70 to 80 percent of readings would land between minus 100 and plus 100. The constant is calibration, nothing more. It makes the output readable, not magical.
The result is unbounded. Nothing in the math caps the reading at 100 or floors it at minus 100. The 100 lines are reference marks printed on an open-ended scale.
Lambert's Plus and Minus 100: Trend Lines, Not Walls
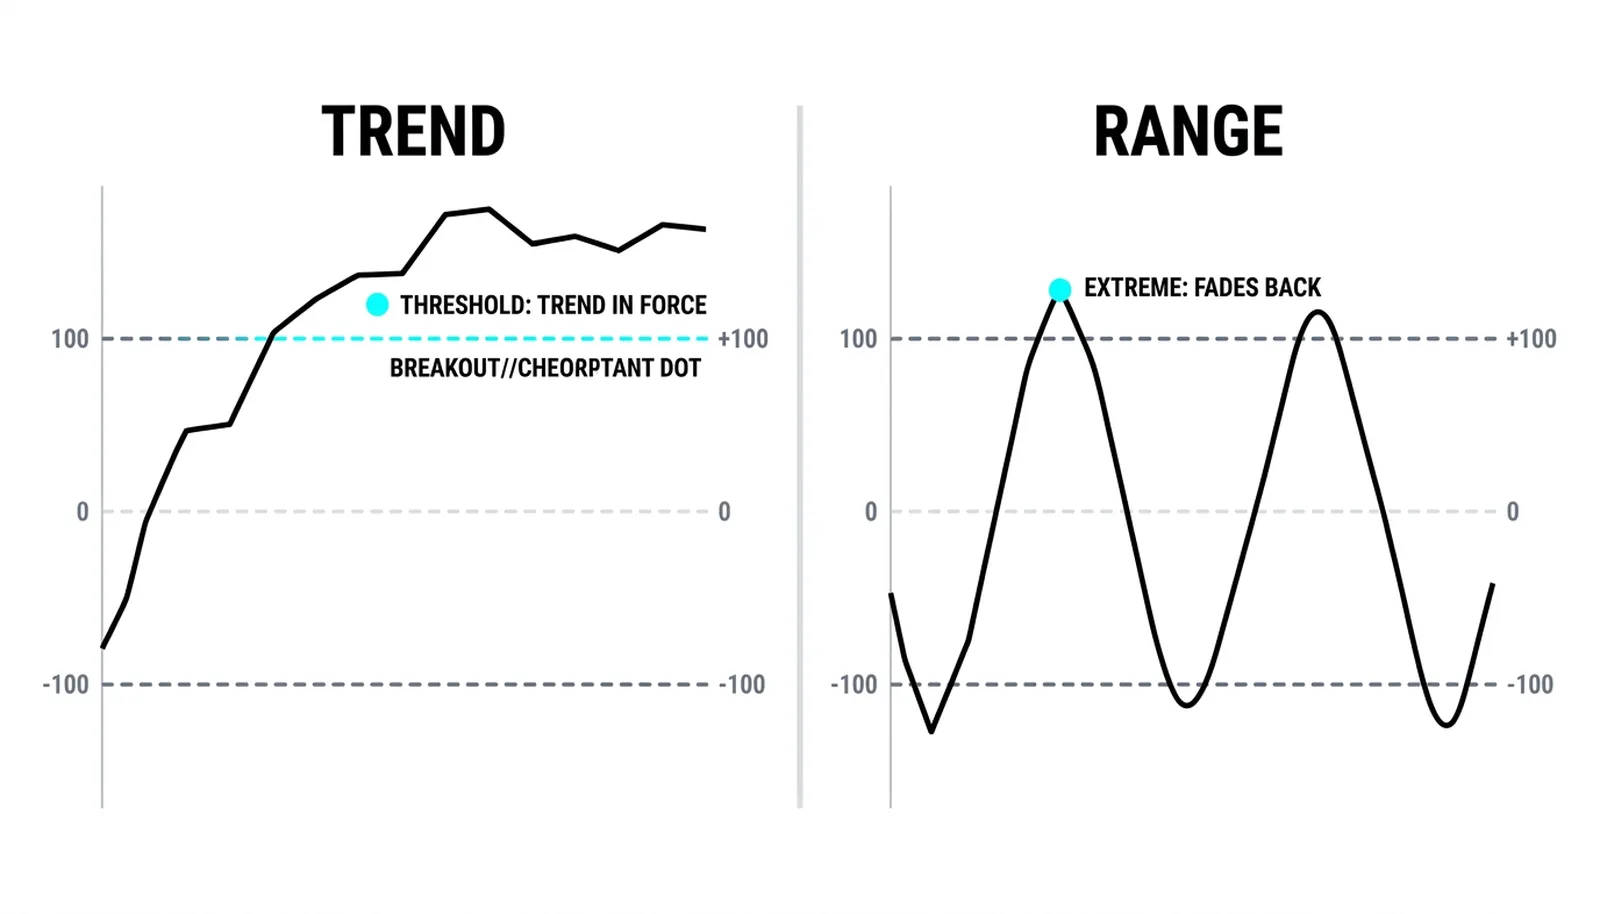
Lambert designed the plus and minus 100 lines as trend thresholds. In Lambert's writing, a sustained move beyond plus 100 flagged an unusually strong uptrend, and a sustained move beyond minus 100 flagged an unusually strong downtrend. The lines marked where strength begins, not where it ends.
The common misread runs the other way. Many traders see CCI at plus 150 and treat it as exhausted, then fade the move. That reading contradicts the design. A plus 150 print says the trend is statistically hot, and hot trends keep running more often than beginners expect. Fading strength because a number looks big is how accounts shrink.
There is a legitimate second use, though. In a sideways market with no trend, the lines do behave more like extremes, and readings beyond them often precede a drift back toward the mean. The two uses contradict each other, so you cannot hold both at once.
The regime check from the RSI zones lesson decides which reading applies. Trending regime: the lines are thresholds, trade with them. Range regime: the lines are extremes, treat them as stretch marks. CCI itself will not tell you which regime you are in.
What Makes CCI Different
Three traits separate CCI from the other momentum tools in this level.
- Unbounded output. Strong trends print 200, 300, and beyond without breaking anything. The scale stretches to fit the move, which is exactly what a deviation measure should do.
- Built from typical price. Because the input blends high, low, and close, one dramatic bar with a wide range moves the reading hard, even if the close alone looked tame.
- Faster and spikier than RSI. RSI smooths gains against losses over its window and stays pinned between 0 and 100. CCI responds to a single unusual bar immediately and whips more in choppy conditions.
- Position-blind. Unlike the stochastic, CCI says nothing about where price sits inside its recent high-low range. It only knows distance from the average.
None of these traits makes CCI better or worse. They make it a different instrument that answers a different question.
Using It Without Overtrading It
Start with the calmest signal CCI offers: the zero-line cross. Because zero sits at the average itself, a cross from below to above says typical price has moved from under its average to over it. That is a slow, structural statement, and it filters out most of the noise the spiky readings create.
Next, watch for divergence. If price prints a higher high while CCI prints a lower peak, the latest push traveled less far from the average than the one before it. The move is losing statistical force. The same logic inverted applies at lows, where a higher CCI trough against a lower price low hints the selling is weakening.
Then there is the trend-filter use near the lines, true to Lambert's intent. When CCI holds above plus 100, treat long setups as favored and short setups as fighting the tape. When it holds below minus 100, flip the bias. Between the lines, the tool has little to say, and forcing a read there manufactures trades.
A CCI reading alone is a distance from average, not an instruction.
Every signal above still needs structure from the earlier levels: a level, a trend, a reason. CCI adds evidence. It never carries the case by itself.
One Deviation, Computed
All numbers here are invented round figures for illustration.
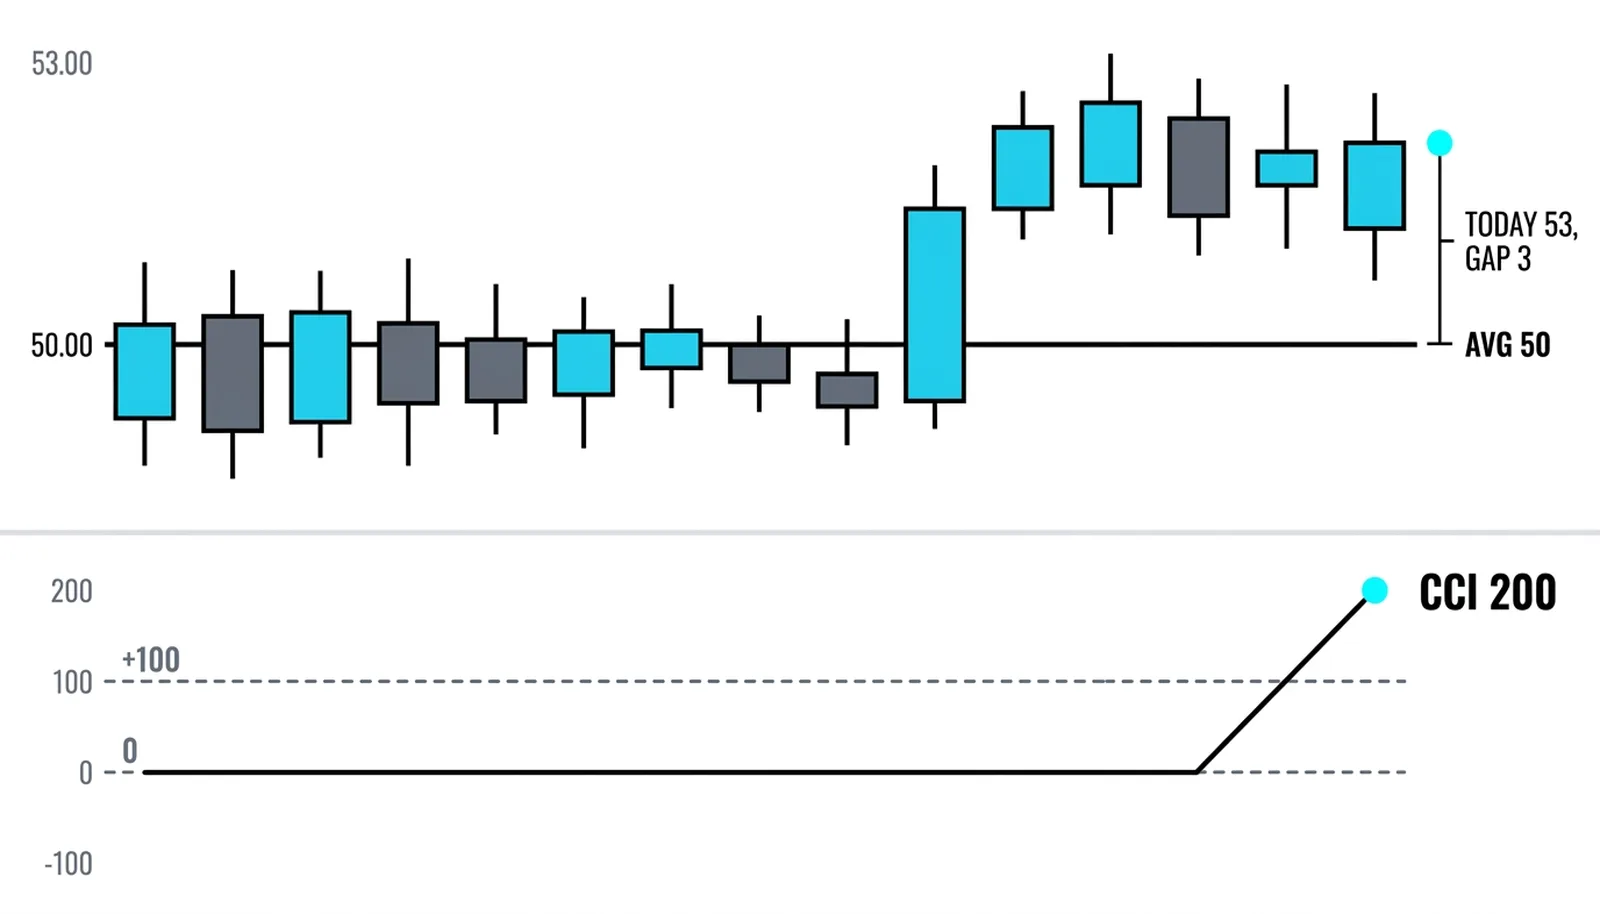
Suppose the 20-bar average of typical price is 50, and the mean absolute deviation over that window is 1.0. Today's typical price prints at 53.
CCI equals 53 minus 50, divided by 0.015 times 1.0. That is 3 divided by 0.015, which gives 200. A reading of 200 says today sits three full normal deviations above the average, well past Lambert's plus 100 trend threshold.
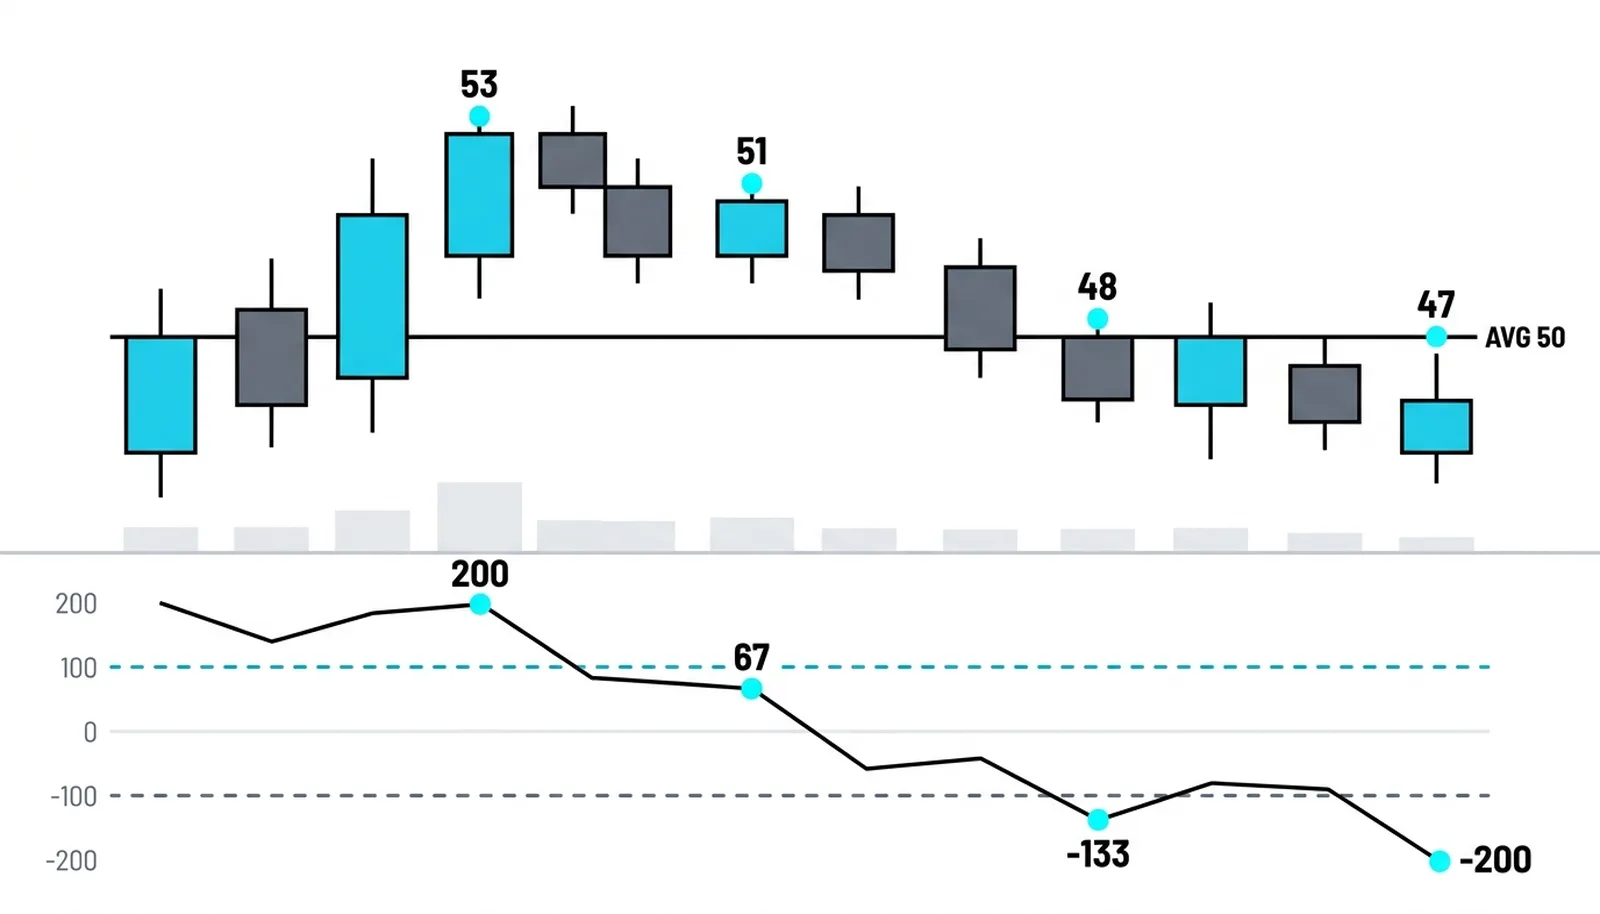
Now a quieter day: typical price of 51. CCI equals 1 divided by 0.015, roughly 67. Noticeable, but inside the band where most readings live. Nothing unusual happened.
The stretched case on the downside: typical price drops to 48 while the average and deviation stay the same. CCI equals minus 2 divided by 0.015, about minus 133, and if price fell to 47 the reading would approach minus 200. Symmetric math, symmetric interpretation: unusually strong downward pressure.
| CCI zone | Lambert's trend reading | Common range misread |
|---|---|---|
| Above +100 | Strong uptrend in force | "Overbought, fade it" |
| 0 to +100 | Mild upward bias, no trend signal | Treated as meaningful anyway |
| Near 0 | Price at its average, no information | Treated as a signal on its own |
| 0 to −100 | Mild downward bias, no trend signal | Treated as meaningful anyway |
| Below −100 | Strong downtrend in force | "Oversold, buy the dip" |
CCI, Answered
What does the CCI actually measure?
It measures how far today's typical price sits from its own 20-bar average, expressed in units of how much price normally deviates. A high reading means today is statistically unusual compared with recent behavior.
What does a CCI above 100 mean?
In Lambert's design, a sustained reading above plus 100 flags an unusually strong uptrend. Whether you treat it as a trend confirmation or a range extreme depends on the regime check, not on the number itself.
What period does CCI use?
The standard setting is 20 bars, matching the original formulation. Shorter periods make it faster and noisier; longer periods smooth it at the cost of lag.
Is CCI the same as the stochastic oscillator?
No. The stochastic measures where the close sits inside the recent high-low range. CCI measures deviation from an average and ignores the range position entirely.
With CCI in place, the momentum block of this level is complete: RSI, the stochastic family, and now the deviation tools. The next lessons move from measuring momentum to putting these pieces together, where the real skill is knowing which question each indicator answers and refusing to ask it any other.