The Stochastic Oscillator, Explained
The Stochastic oscillator, from the stochastics framework, ignores how far price traveled and measures only where the close landed inside the recent high-low range. A close near the top of the range reads near 100. A close near the bottom reads near 0. That is the complete instrument.

Picture an elevator in a fourteen-story building: the reading is the floor where today's close parked, the top floor means buyers paid up to the top of the recent range, the basement means sellers pressed it to the bottom. Nothing about the speed of the ride matters. Only the final floor counts.
If you worked through the RSI lessons earlier in this level, hold that distinction. RSI averages the ratio of up-moves to down-moves, while the stochastic locates the close inside the raw range. They are built on different inputs, so when they disagree, they disagree for real reasons, not because one is broken.
And as the four-categories lesson placed it, the stochastic sits squarely in the momentum family. It answers the momentum question by measuring position instead of pace.
The One Formula Behind It
The formula is: the close minus the lowest low, divided by the highest high minus the lowest low, times 100. The standard lookback is 14 bars. Every charting platform computes it for you, but you should be able to walk the arithmetic once, by hand, so the number on your screen never feels like magic.
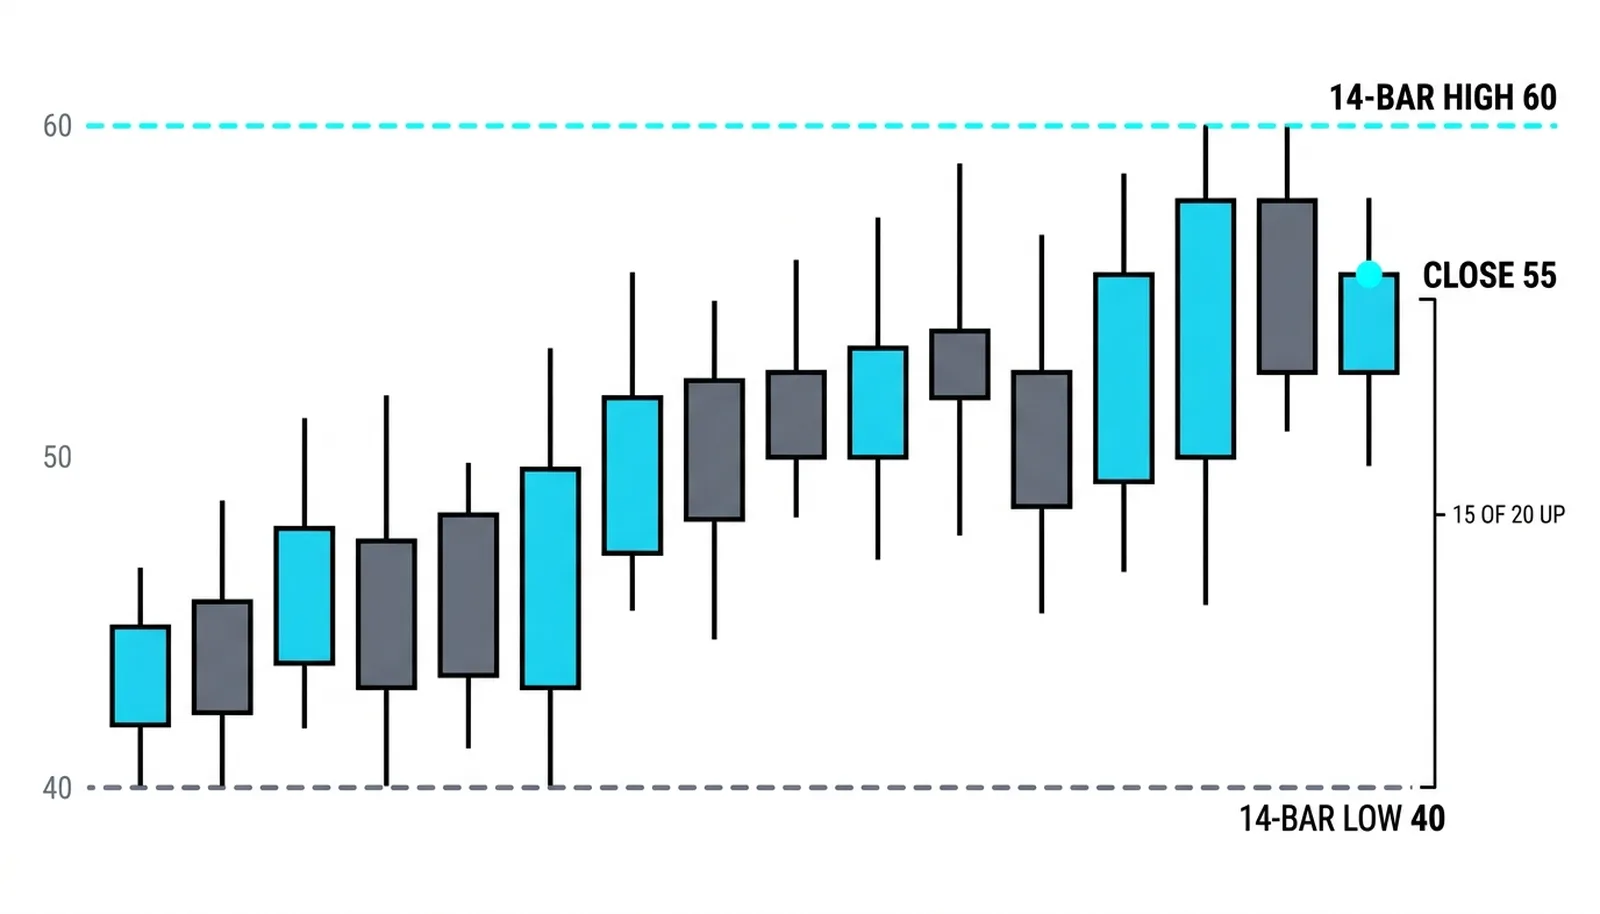
Say the highest high over the last 14 bars is 60 and the lowest low is 40. The range is 20 points wide. Today's close is 55. Subtract the low: 55 minus 40 is 15. Divide by the range: 15 over 20 is 0.75. Multiply by 100 and you get a reading of 75.
Notice what the output is. It is a percentage position, not a price. A reading of 75 does not mean the instrument rose 75 percent or sits at 75 dollars. It means the close landed three-quarters of the way up the recent range. The unit is position, and position is all it will ever tell you.
This is also why the stochastic reacts so quickly. Change the close and the numerator moves immediately. Push the range wider with one dramatic bar and the denominator moves too. The whole calculation is built from three numbers, and two of them can shift on any bar.
What 80 and 20 Are Telling You
Above 80, the close keeps landing near the top of the recent range. Below 20, it keeps landing near the bottom. The zones lesson from the RSI section applies here directly: the stochastic carries its own 80 and 20 lines with the same regime logic, so nothing about the interpretation framework is new.
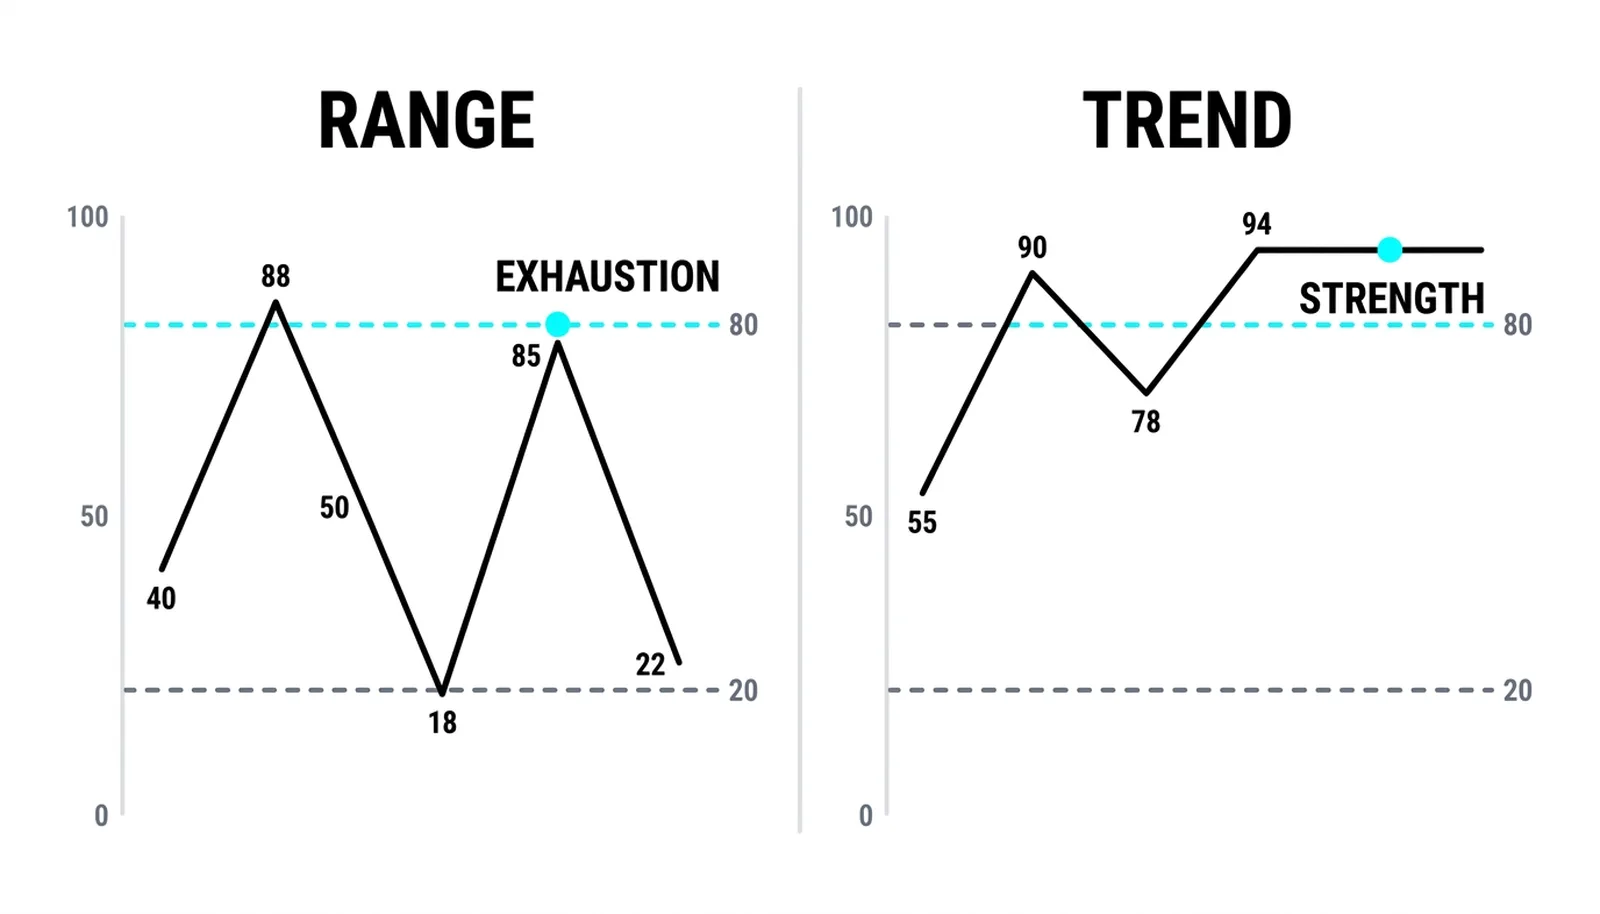
What changes is the meaning depending on the market's state. In a range, a push above 80 often marks exhaustion. Buyers have pressed the close to the top of a range that has been holding, and the range itself argues the move will stall. A dip below 20 mirrors that: sellers pressed to the floor of a floor that has held before.
In a trend, the same readings flip meaning. A strong uptrend pins the stochastic above 80 for long stretches because every close genuinely does land near the top of a rising range. That is strength confirming itself, not exhaustion. Selling a pinned reading in a trend is one of the most common ways new traders donate money to the market.
So the zones are real, but they are not instructions. They are descriptions of where the close has been parking, filtered through whatever regime the chart is actually in.
How It Differs From RSI
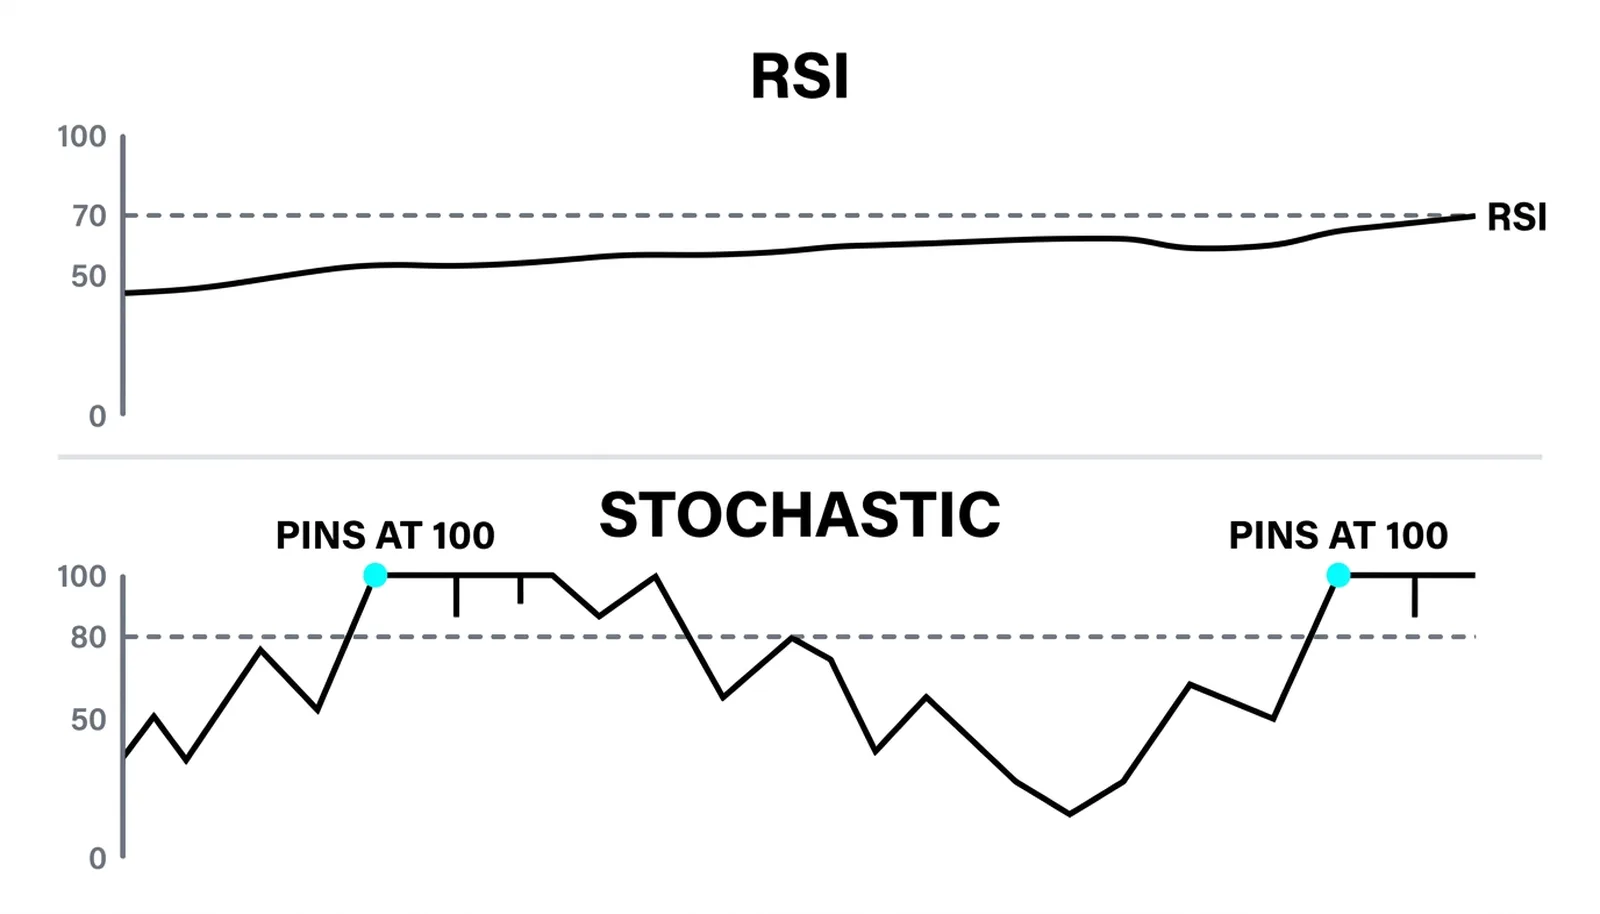
RSI smooths and weights the path. It averages gains against losses over the lookback, so a single dramatic close gets diluted into the average. The stochastic does no smoothing of that kind in its raw form. It reads position directly off the current bar against the raw range.
The practical consequence is speed. The stochastic turns faster, reaches extremes faster, and saturates harder. It will hit 100 on a single close at the high. RSI, by construction, climbs more gradually toward its own ceiling.
Saturation cuts both ways. A stochastic pinned above 90 for days is trend behavior, not a sell signal. The reading is doing exactly what the formula says: closes keep landing near the top of a rising range. Treating that as overbought-and-due is a category error, the same error traders make with RSI, just faster and more often.
Choose between them by temperament of the tool, not by which is "better." RSI is the steadier read on momentum. The stochastic is the twitchier one, better suited to timing inside a structure you have already mapped.
Reading It in One Glance
Because it turns fast, the stochastic earns its keep as a timing tool. Inside a range you have already drawn, a reading washing down toward 20 near range support is a useful alert. The structure says where; the stochastic says when the close has been pressed to the cheap end of the recent range.
But every reading is regime-dependent. The same 15 means one thing at the bottom of a six-week range and something else entirely on the third day of a breakdown. The number does not carry its context with it. You supply the context from the chart work you already know how to do.
A stochastic reading alone is a position, not an opinion.
Traders who respect that sentence use the tool well. Traders who treat the number as a verdict get whipsawed by the fastest oscillator on their screen.
Locating the Close
Here is a worked example with round numbers, all hypothetical. Suppose the 14-bar high is 52 and the 14-bar low is 44. The range is 8 points wide.
Day one: the close is 50. Subtract the low: 50 minus 44 is 6. Divide by the range: 6 over 8 is 0.75. Times 100 gives a reading of 75. The close parked three-quarters of the way up the range.
Day two: the close slips to 46. Now 46 minus 44 is 2, and 2 over 8 is 0.25, so the reading drops to 25. Same range, weaker close, much lower position.
Day three: the close lands exactly on the high at 52. Then 52 minus 44 is 8, and 8 over 8 is 1, so the reading pins at 100. Three closes, three positions, one formula. Nothing about the path between those closes entered the calculation at all.
| Reading | What it says | Regime caveat |
|---|---|---|
| Near 100 | The close landed at or near the top of the 14-bar range | In an uptrend this confirms strength and can persist for many bars |
| Near 50 | The close landed mid-range, neither side pressing | Common in chop; carries little information on its own |
| Near 0 | The close landed at or near the bottom of the range | In a downtrend this confirms weakness, not an automatic buy |
| Pinned at an extreme for many bars | Closes keep parking at one end of a moving range | Signature of a trend, not exhaustion; fading it is fighting the tape |
The Stochastic Oscillator, Answered
What does the stochastic oscillator actually measure?
It measures where the latest close sits inside the recent high-low range, expressed as a percentage. A reading of 80 means the close landed 80 percent of the way up from the lowest low to the highest high over the lookback, typically 14 bars. It measures position, never distance or speed.
What do the 80 and 20 levels mean?
Above 80, closes are consistently landing near the top of the recent range; below 20, near the bottom. In a range those zones often mark exhaustion, and in a trend they mark persistence. The levels describe location, and the regime decides what that location implies.
Is the stochastic the same as RSI?
No. RSI averages the ratio of up-moves to down-moves over the lookback, smoothing the path price took. The stochastic ignores the path and reads the close's raw position inside the range. That is why the stochastic turns faster and pins at extremes more easily, and why the two can legitimately disagree on the same chart.
What does it mean when the stochastic stays above 80?
It means closes keep landing near the top of a rising range, which is the signature of a healthy uptrend. A pinned reading is trend behavior, not an automatic sell. The tool is reporting persistent strength, and the mistake is reading persistence as exhaustion.
Next in this family, the oscillator splits into its two lines, %K and %D, and the slowing between them starts to carry its own signal. That is where the raw position you have just learned turns into a timing relationship.