RSI Failure Swings: A Reversal Signal
A failure swing is RSI calling a reversal on its own, with no need to compare anything against the price chart. RSI pushes into an extreme zone, pulls back, tries again, fails to reach its first extreme, and then breaks the pullback's turning point. That four-step sequence is the signal. Price can be doing anything while it forms. The oscillator's own structure carries the whole message.

Think of a player attempting a second run at their own high score and falling short. Nobody checks the other machine in the arcade. Falling short of your own best is the story. RSI works the same way here: the second push is measured against the first push, not against price.
Construction and the zone boundaries were covered in the earlier RSI lesson, so this one assumes you know how the 0 to 100 scale is built. The 70 and 30 lines matter here because they give the swing its frame. A failed retest in the middle of the range means little. A failed retest after a trip into an extreme zone is where the signal lives.
The Bearish Failure Swing, Step by Step
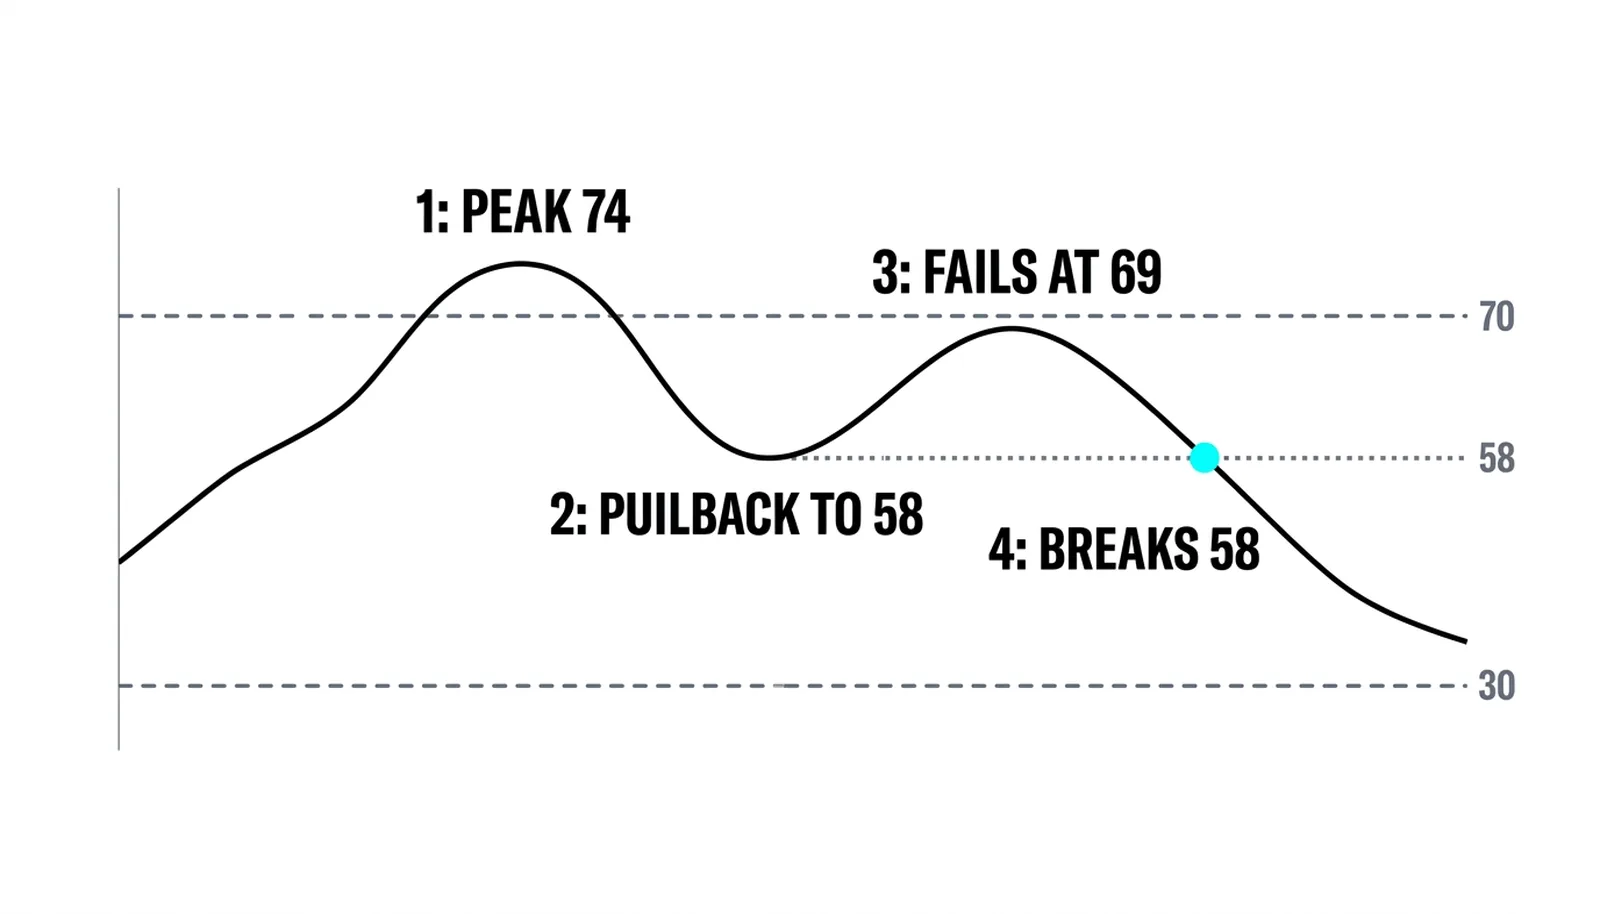
The bearish version unfolds in four moves. First, RSI rises above 70 and prints a peak inside the overbought zone. Second, it drops back, forming a pullback low somewhere below the peak. Third, it rallies again but stalls below the first peak, never retaking its own high. Fourth, it breaks below the pullback low. The break is the trigger.
The failed retest is the tell. When RSI cannot match its own high on the second attempt, momentum has already weakened, even if price still looks firm. The break of the pullback low then confirms the structure has rolled over. Until that break happens, you have a suspicion, not a signal.
Order matters. Traders who short the moment RSI fails to make a new high are front-running step four. The pullback low is the line that separates a tired rally from a completed failure swing. Wait for the close below it.
The Bullish Failure Swing in a Mirror
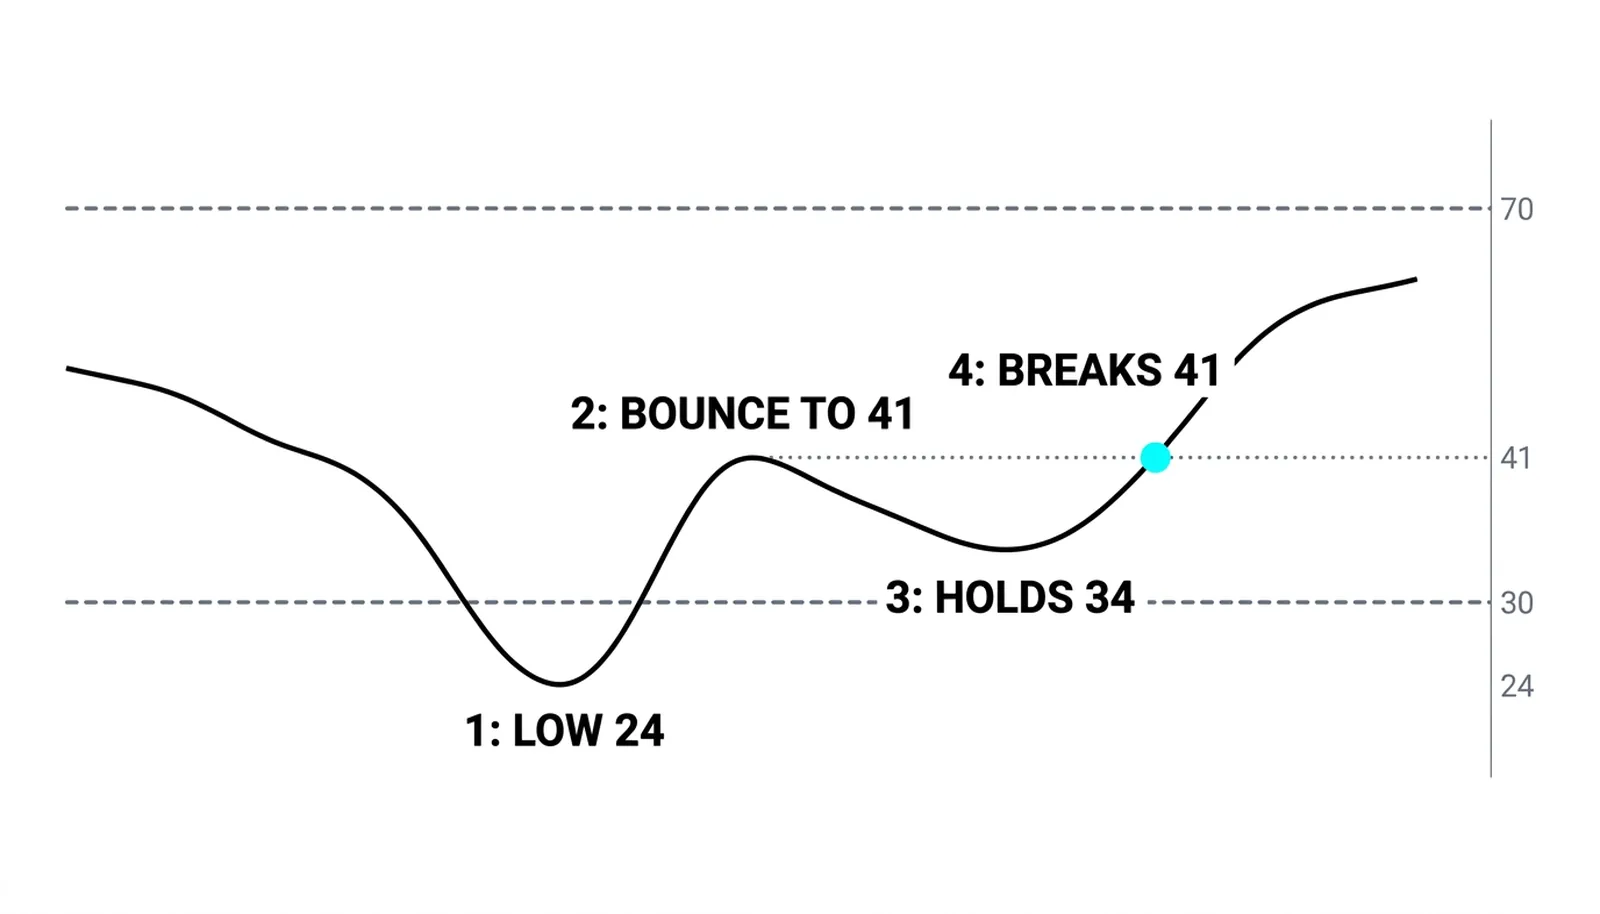
The bullish version flips every step. RSI dips below 30 and prints a low inside the oversold zone. It bounces, printing a recovery high. It slides again but holds above the first low, refusing to make a new extreme. Then it breaks above the bounce high. That break is the trigger, and the held second low is the tell.
The logic is identical. Sellers pushed RSI into the floor once, and on the second attempt they could not push it as far. Selling pressure is drying up on its own terms. The break above the bounce high confirms the shift.
Most traders find the bullish mirror harder to trust because it appears in falling markets, when everything feels heavy. The signal does not care about the mood. It only asks whether RSI's second attempt fell short of the first, and whether the bounce high gave way afterward.
Failure Swing or Divergence?
The RSI divergence lesson earlier in this batch covered the comparison tool: divergence checks RSI against price, looking for price to make a new extreme while RSI refuses. A failure swing never looks at price at all. It reads RSI's own peaks and troughs and nothing else.
That difference changes what each signal needs. Divergence requires price to print the new high or low. A failure swing can complete while price moves sideways, because the entire pattern lives inside the oscillator window.
The two can appear together, and when they do the warning is louder. A bearish failure swing forming while price makes a higher high against RSI's lower high stacks two independent clues on the same idea. Treat that overlap as a stronger case, not as two separate trades.
Where It Works and Where It Is Silent
Failure swings earn their keep at range edges and in tired trends. Those are the places where a second push genuinely runs out of fuel. Price stalls near a familiar ceiling, RSI makes its extreme, and the failed retest captures the moment the push dies.
In runaway trends the tool goes quiet. RSI may pin itself above 70 or below 30 for long stretches, or never reach the zone at all before price has already moved. No trip into the zone means no peak to retest, so no signal forms. The tool is silent rather than wrong.
Silence is information of a kind, but it is not a trade. Do not force the pattern onto a chart where step one never happened. If RSI spent the whole move oscillating between 40 and 65, there is no failure swing to find, and inventing one will cost you.
Four Steps on One Chart
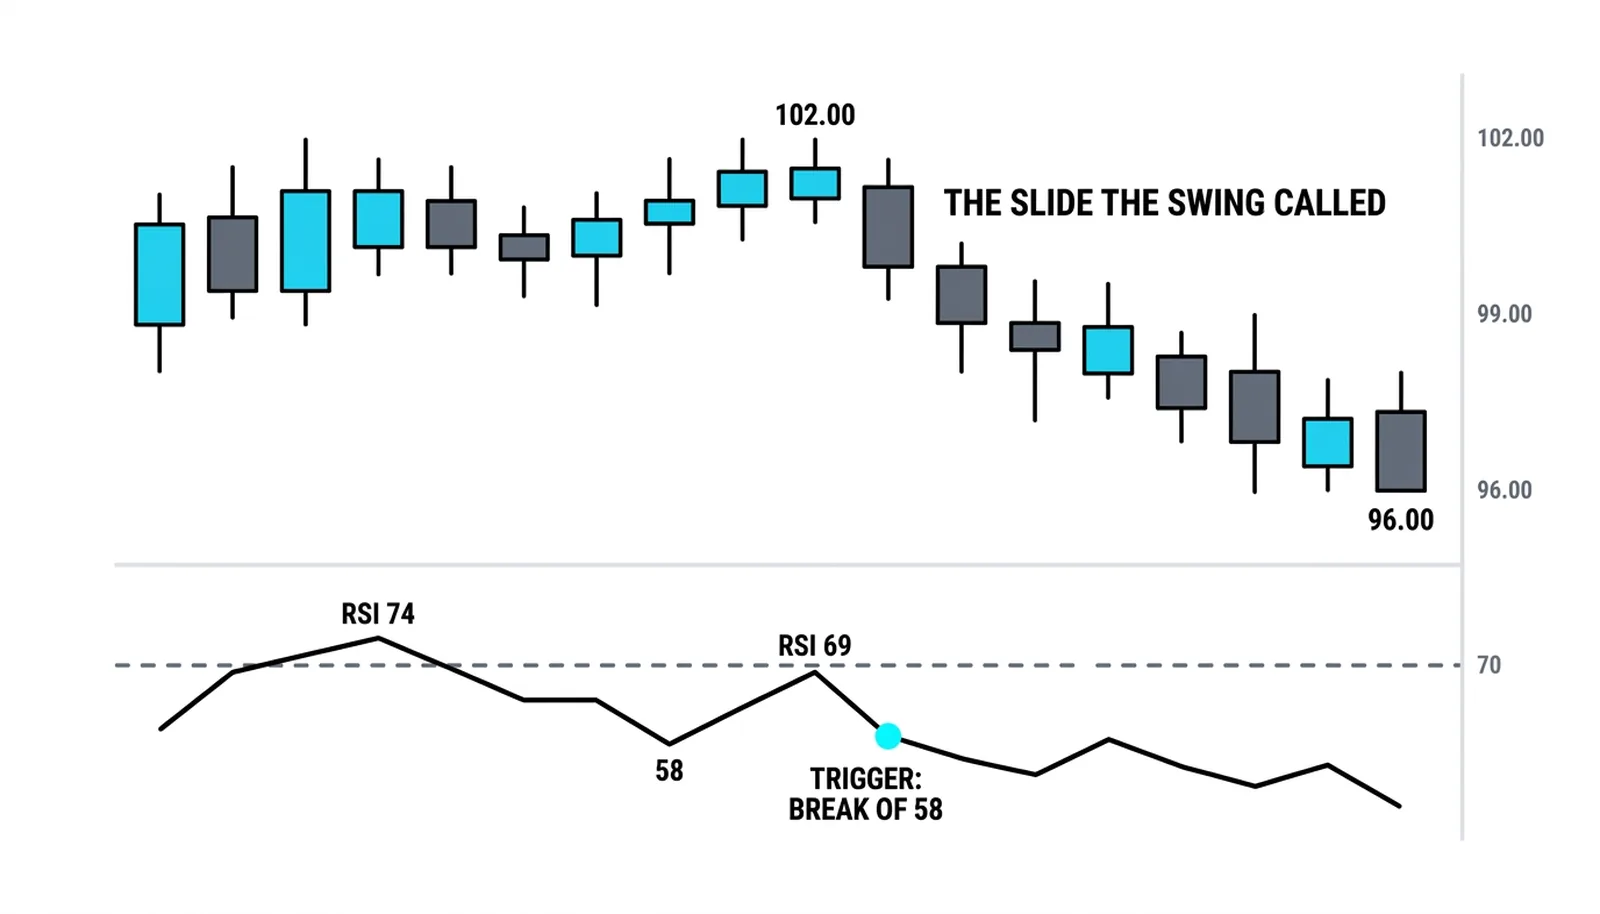
Here is the bearish sequence with invented round numbers, purely as an illustration. RSI climbs to 74, deep enough into the zone to count. It falls back to 58, marking the pullback low. It rallies again but stalls at 69, short of 74. Then it closes below 58. The swing is complete at that close, not before.
On the price side of this hypothetical, a stock trading near 102 slips toward 96 over the following week. The failure swing fired before the bulk of that slide, because it read momentum's structure rather than waiting for price to confirm.
Now the mirror. RSI dips to 24, bounces to 41, slides again but holds at 34, then breaks above 41. A hypothetical stock near 45 runs to 51 over the sessions that follow. Same four steps, opposite direction, same discipline: the break of the bounce high is the entry trigger, and the held second low at 34 is what made the setup worth watching.
| Step | Bearish sequence | Bullish mirror |
|---|---|---|
| Peak in the zone | RSI prints 74 above 70 | RSI prints 24 below 30 |
| Pullback | Drops to 58 | Bounces to 41 |
| Failed retest | Rallies only to 69 | Slides only to 34 |
| Break | Closes below 58 | Closes above 41 |
Failure Swings, Answered
What is a failure swing in RSI?
A failure swing is a four-step reversal pattern inside the RSI itself: a trip into the 70 or 30 zone, a pullback, a second attempt that falls short of the first extreme, and a break of the pullback's turning point. The break completes the signal.
Does a failure swing need price confirmation?
No, the pattern is self-contained and completes on RSI's own structure alone. That said, many traders still wait to see price cooperate before sizing in, because any single indicator can fire early in a strong trend.
How is a failure swing different from divergence?
Divergence compares RSI against price and requires price to make a new extreme. A failure swing compares RSI against its own earlier peak or trough and never references price. They are independent signals that sometimes appear together.
Do failure swings work on other oscillators?
Yes, the same structure can be read on any bounded oscillator with defined extreme zones, including the Stochastic, which the next lessons take apart line by line. The zone boundaries change, the four steps do not.
Next in this batch, the Stochastic oscillator gets its own treatment: what %K and %D actually measure, why the lines cross, and how its version of divergence differs from what you have just learned on RSI.