What Fundamental Analysis Really Is
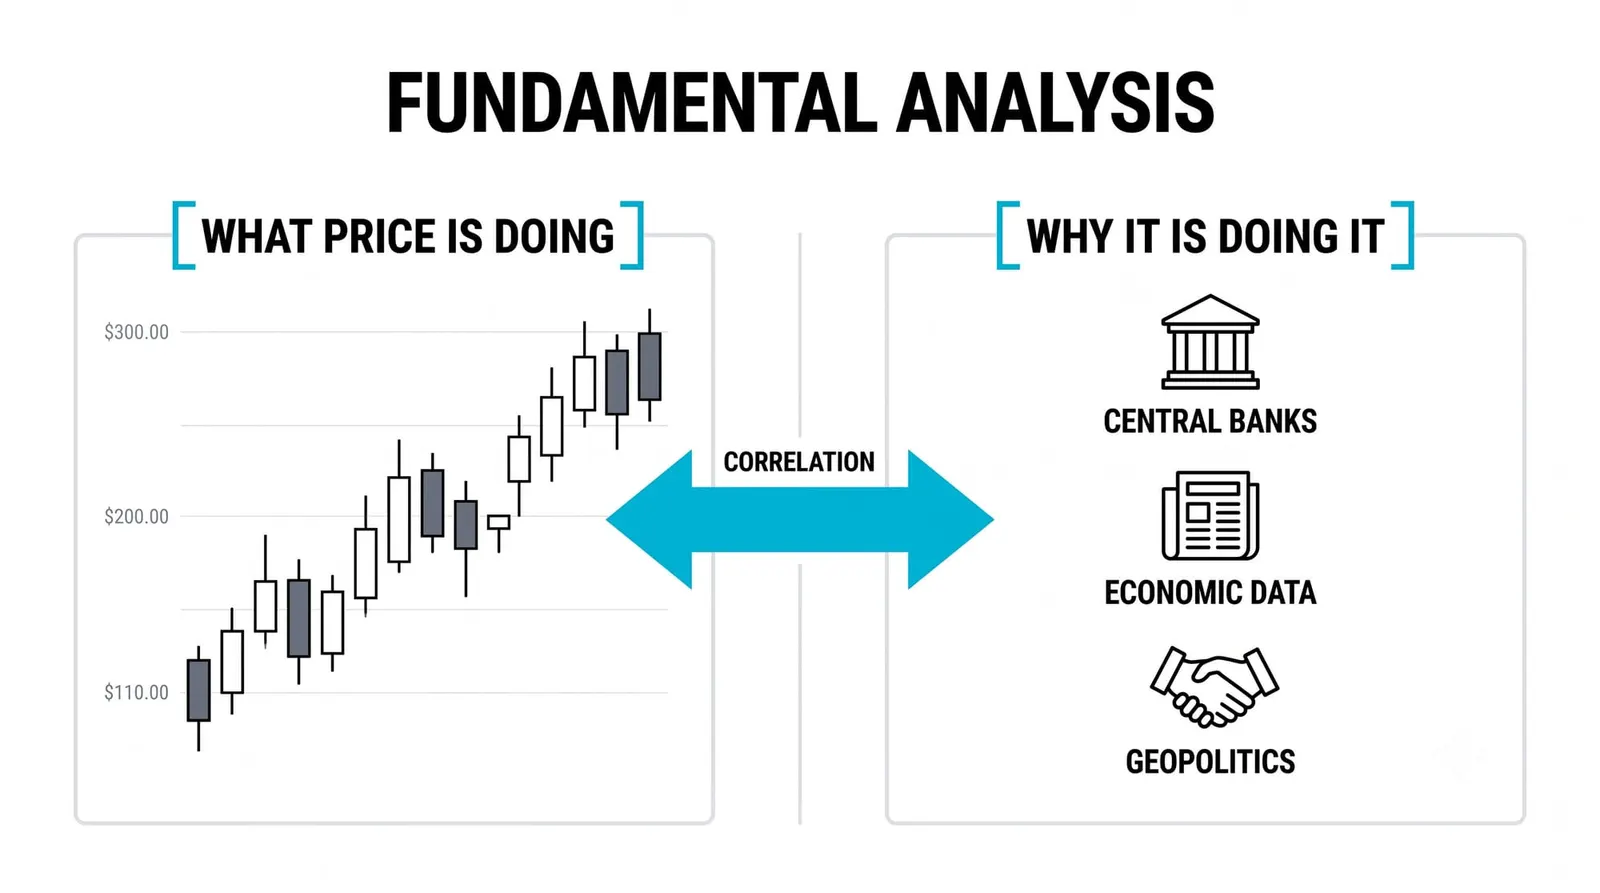
Fundamental analysis is the practice of judging what an asset is worth from the forces underneath its price: the economy it lives in, the sector it competes in, and the business or project itself, rather than from the price chart alone. The chart tells you what happened. Fundamentals tell you why it should keep happening, or why it should stop.
Think of fundamentals as the root system and price as the foliage: the leaves move first, but the roots decide how tall the tree can grow. A price can drift far from its roots for a while. It cannot stay there forever. This lesson defines the discipline and names the three forces it tracks. The head-to-head comparison between chart reading and fundamental reading got its own lesson on the technical track, so we will not rerun that debate here. And the split between macro forces and micro forces is a sibling lesson in this batch; for now, just know the split exists.
Why the Charts Alone Were Never the Full Picture
A chart is a record. Every candle, every level, every trendline is a receipt of decisions people already made. Records are useful. They are not causes.
When a support level holds four times, something underneath that price is making people act the same way four times. Maybe the company's earnings keep growing, so buyers keep stepping in at the same discount. Maybe the central bank's rate path makes holding the asset cheap. Maybe the whole sector is catching a bid because demand for its product is rising. The level is the track it left behind. The fundamental is the foot.
This matters because levels eventually break, and they break for reasons. A trader who only sees the level sees the break as random noise. A trader who knows what was holding the level up can often see the support weakening before the price gives way, because the underlying force is fading first.
Charts answer "where." Fundamentals answer "why." You spent four levels learning the where. This level is the why.
The Three Forces Fundamental Analysis Tracks
Strip away the jargon and almost every fundamental input reduces to one of three forces. You will see these three names constantly through this level, so learn them now.
Interest rates. Rates set the cost of money. They push on everything: what it costs a company to borrow, what a saver earns doing nothing, how much a future profit is worth today. When rates move, the price of nearly every asset has a reason to move.
Growth expectations. This is what people believe about future earnings, output, and expansion. Prices are set on what buyers expect tomorrow, not what happened yesterday. A company can post strong numbers and still fall if the market expected stronger.
Risk appetite. This is the crowd's willingness to hold uncertain assets instead of safe ones. It swings with fear and confidence, and it can lift weak assets or sink strong ones for stretches of time, regardless of what either one "deserves."
Every fundamental data point you will meet, from an inflation print to an earnings report, feeds into one or more of these three. That is the filing system.
Why This Level Matters for Where You Go Next
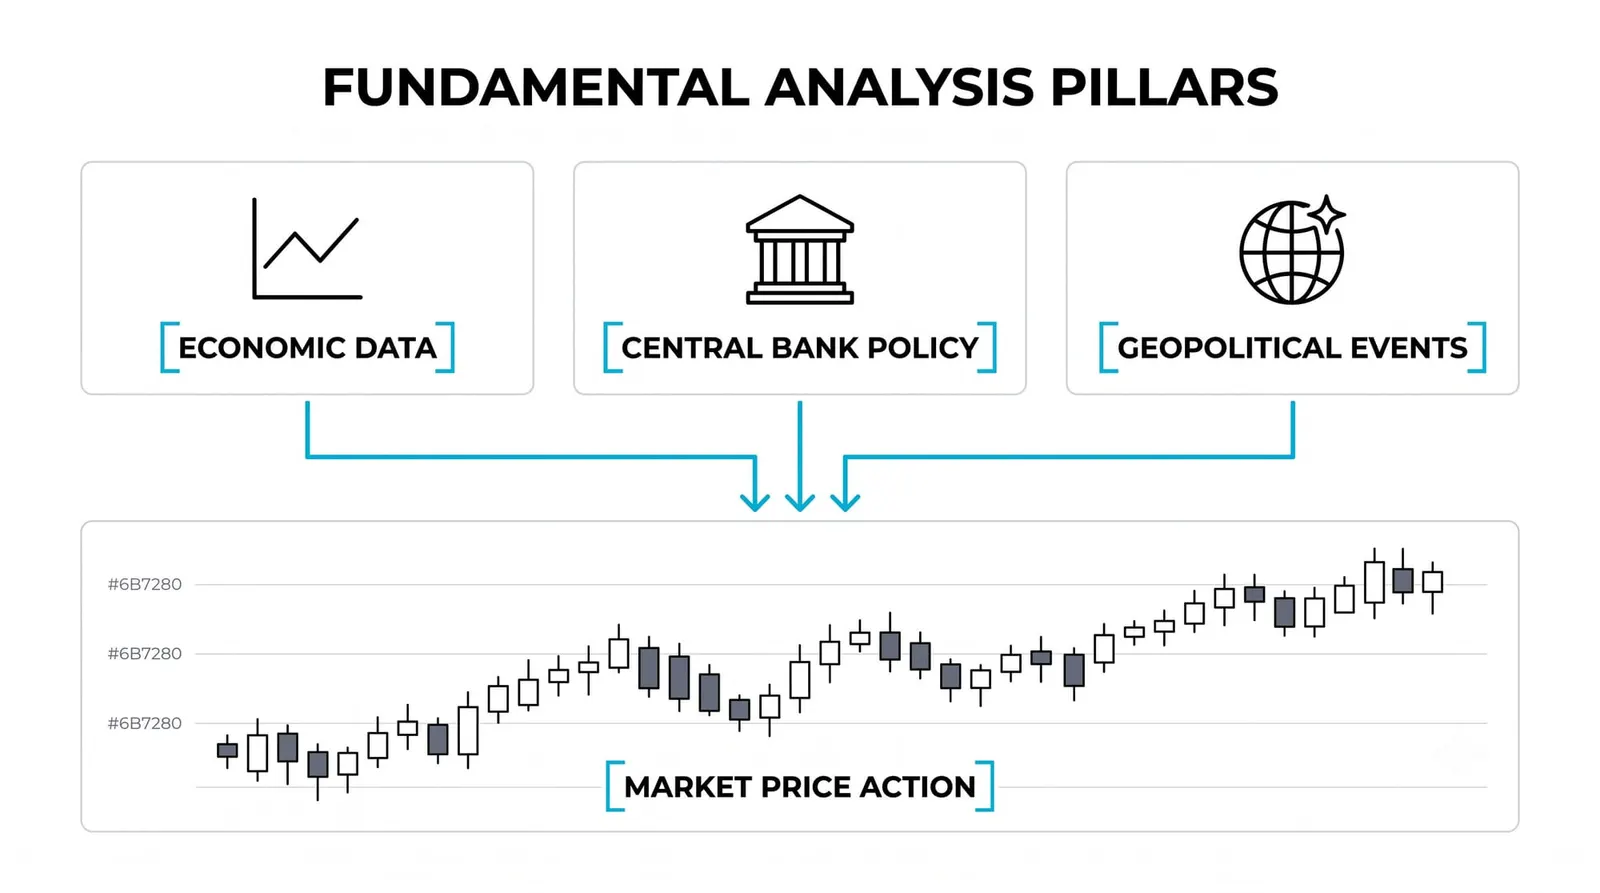
Everything after this lesson is one of these three forces seen up close. Inflation is interest rates in disguise, because inflation is what central banks react to when they set rates. GDP and employment reports are growth expectations measured. Earnings season is growth expectations at the single-company scale. Sentiment indicators and safe-haven flows are risk appetite made visible.
So treat this lesson as the map legend. When a later lesson walks through a central bank decision, you will already know which force it belongs to and what it pushes. When we cover earnings, you will know the report only matters relative to the expectation that was already priced in.
Nothing in this level asks you to become an economist. It asks you to recognize which force a piece of news belongs to, and to have a sober view of what that force can and cannot do to a price.

The Same Chart, Two Stories
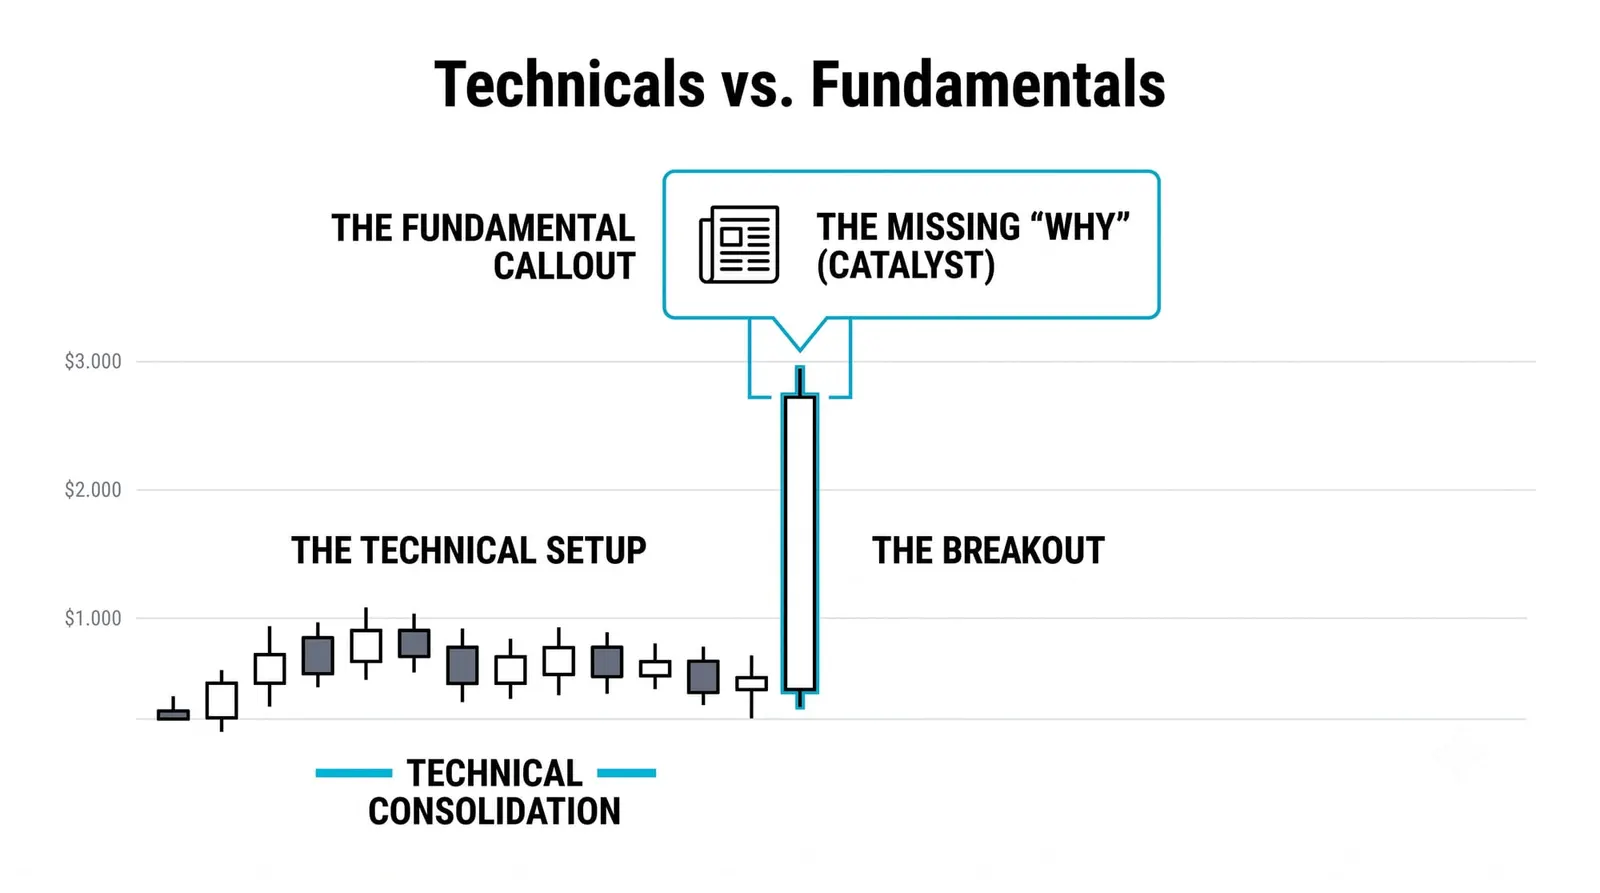
Here is a hypothetical with round numbers. A stock trades at 40. Over twelve months it rises to 80. The chart shows a clean uptrend: higher highs, higher lows, pullbacks bought.
Story one, the chart alone. The trend is strong. Buyers are in control. You could justify holding, maybe even adding on pullbacks. But you cannot answer the obvious questions. Why 80 and not 60 or 120? How much room is left? What would end the move? The chart is silent on all three, so your conviction rests on the pattern continuing because it has continued.
Story two, add the fundamentals. The company sells a component that just entered an industry-wide shortage. Its revenue doubled over the same year. Interest rates fell during the period, which raised the present value of its future earnings. Now the move has an engine: growth expectations surged, and falling rates amplified them. The same chart, but now you can say what is carrying it.
The difference shows up in behavior. The chart-only read earns caution: you hold with a tight leash because you cannot name what you are trusting. The fundamental read earns patience: you can sit through a 15 percent pullback because the shortage, the revenue, and the rate backdrop are all still intact.
Then the shortage ends. Supply normalizes, revenue growth flattens, and the engine cuts out. The chart may still look fine for weeks after that. The trader running story one sees no reason to leave. The trader running story two knows the reason for the trade is gone, and the same chart now means something different. Same lines, different information.
Fundamental Analysis, Answered
Do I need economics training to do this?
No. You need to understand what each force pushes and how a handful of common reports connect to it, which is exactly what this level teaches. Formal training helps professionals build valuation models; recognizing that a rate decision pressures growth stocks requires none of that.
Does fundamental analysis work for crypto?
Yes, though the inputs change shape. A token has no earnings, so the "business" layer becomes network usage, supply mechanics, and developer activity, while rates and risk appetite still push the whole space. The three forces apply; the evidence you gather for each one differs by asset.
How long does one analysis take?
For a single asset, a first pass can take an hour or two once you know the checklist: which force dominates this asset, what the current expectation is, and what would change the story. Deep valuation work takes far longer, but a trader's version is a structured pass, not a research thesis.
Can price rise while fundamentals worsen?
Yes, and it happens regularly. Risk appetite alone can carry prices well past what growth and rates justify, sometimes for months. That gap is not proof the fundamentals stopped mattering; it is a sign the move is running on one force instead of three, which tells you something about how fragile it is.
Next in this level, we pull the three forces apart into macro and micro, so you can tell which layer of the economy a piece of news actually belongs to before you decide what it means for a chart.