Bottom-Up Fundamental Analysis
Bottom-up fundamental analysis starts with one asset and widens out from there. You judge the asset first on its own business, then on its sector, then on the global picture. The narrowest and most checkable evidence comes first, and the broadest comes last.

Think of it as a set of nesting dolls. Open the asset and you find a sector inside; open the sector and you find an economy inside. Each layer is real, but the smallest one is the one you can hold and inspect most closely. That ordering is the method: start where the evidence is hardest to argue with, and let each wider layer add context rather than replace what you already checked.
Widening Out: From Asset to Sector
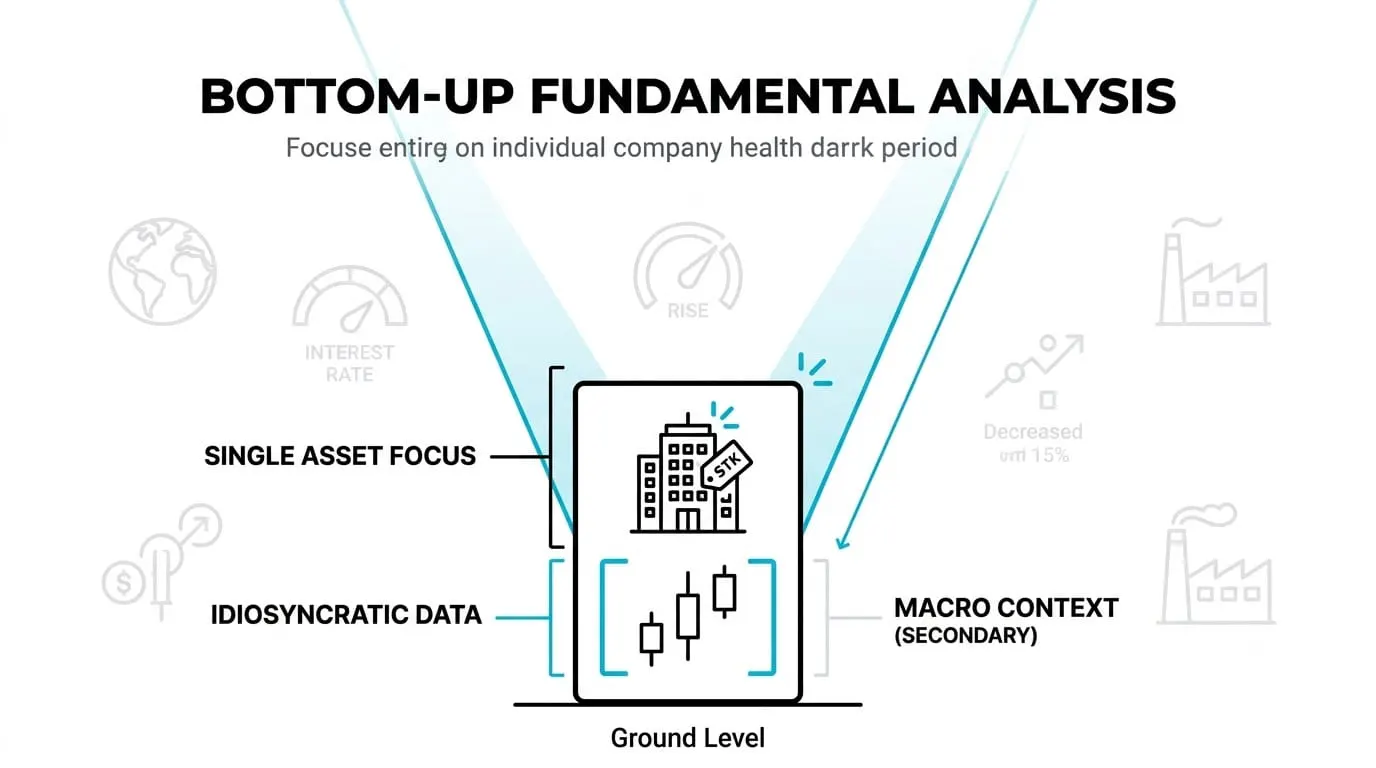
The first layer is the asset itself. For a company, that means its revenue, its costs, its debts, and the plain question of whether the business works. Does it sell more than it did before? Are its costs rising faster than its sales? Can it cover its interest payments without strain? These are concrete questions with answers you can find in filings and earnings reports.
This layer matters because it is the most specific evidence you will ever get about the asset. A company's own numbers describe that company and nothing else. If revenue is falling while costs climb, that is a fact about this business, stated in its own accounts.
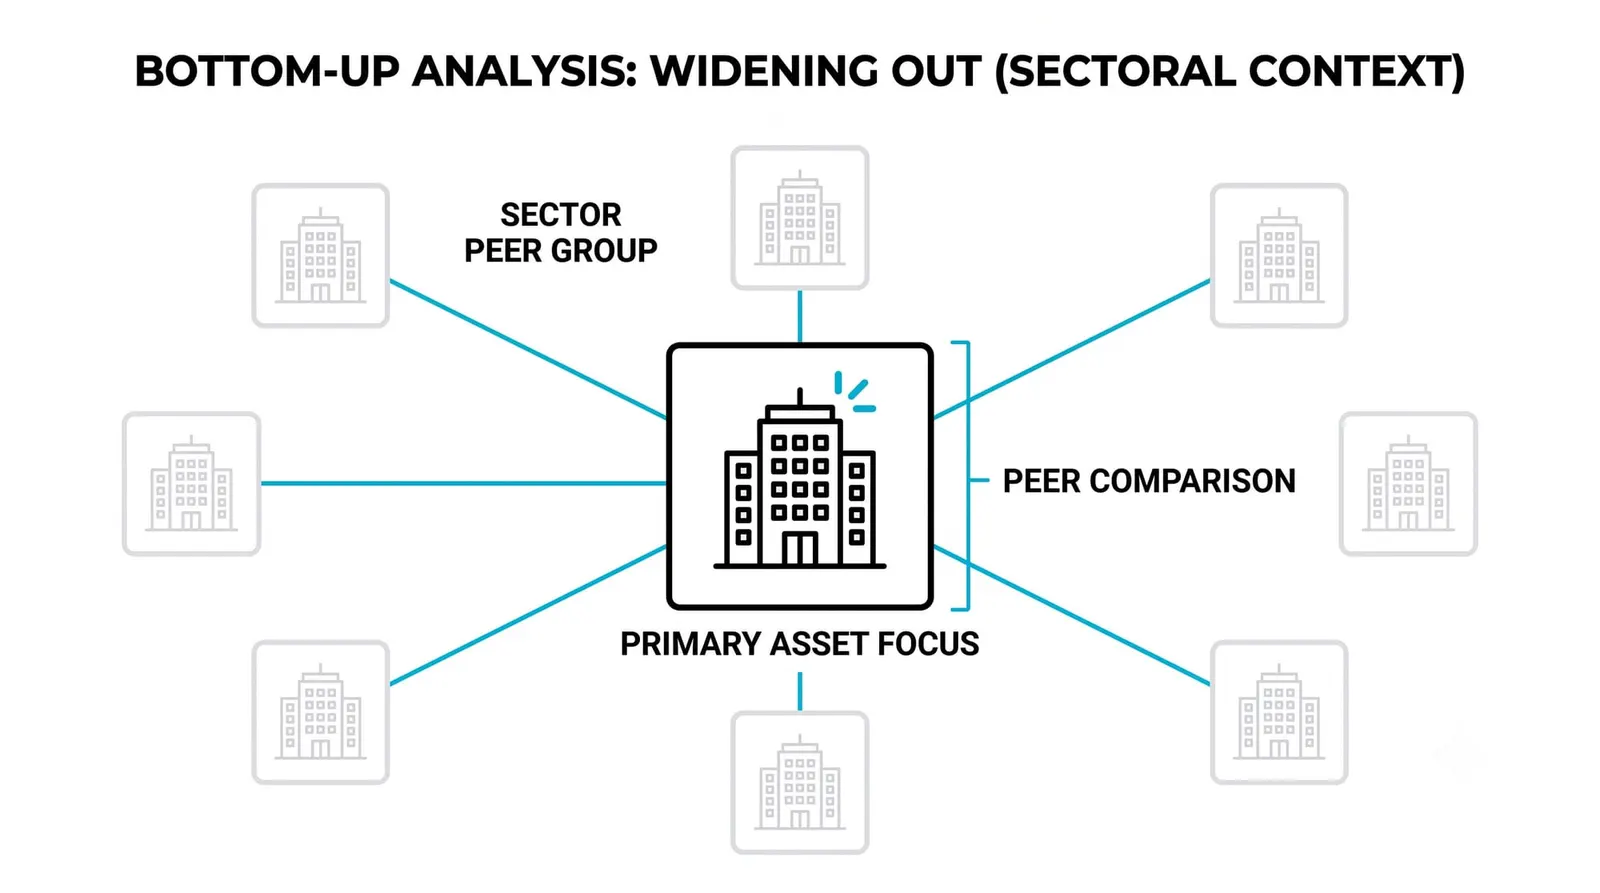
Then you widen to the sector. The question changes: is the wider industry under the same pressure? If your company's costs rose and a competitor reports the same cost problem in the same week, that is evidence the problem is sector-wide rather than company-specific. One sick company is a story about management. Five sick companies in the same industry is a story about the industry.
This distinction changes what you do. A company-specific problem can be fixed by management or avoided by switching to a rival. A sector-wide problem follows every company in the group, so switching within the sector buys you nothing.
Widening Further: From Sector to the Global Picture
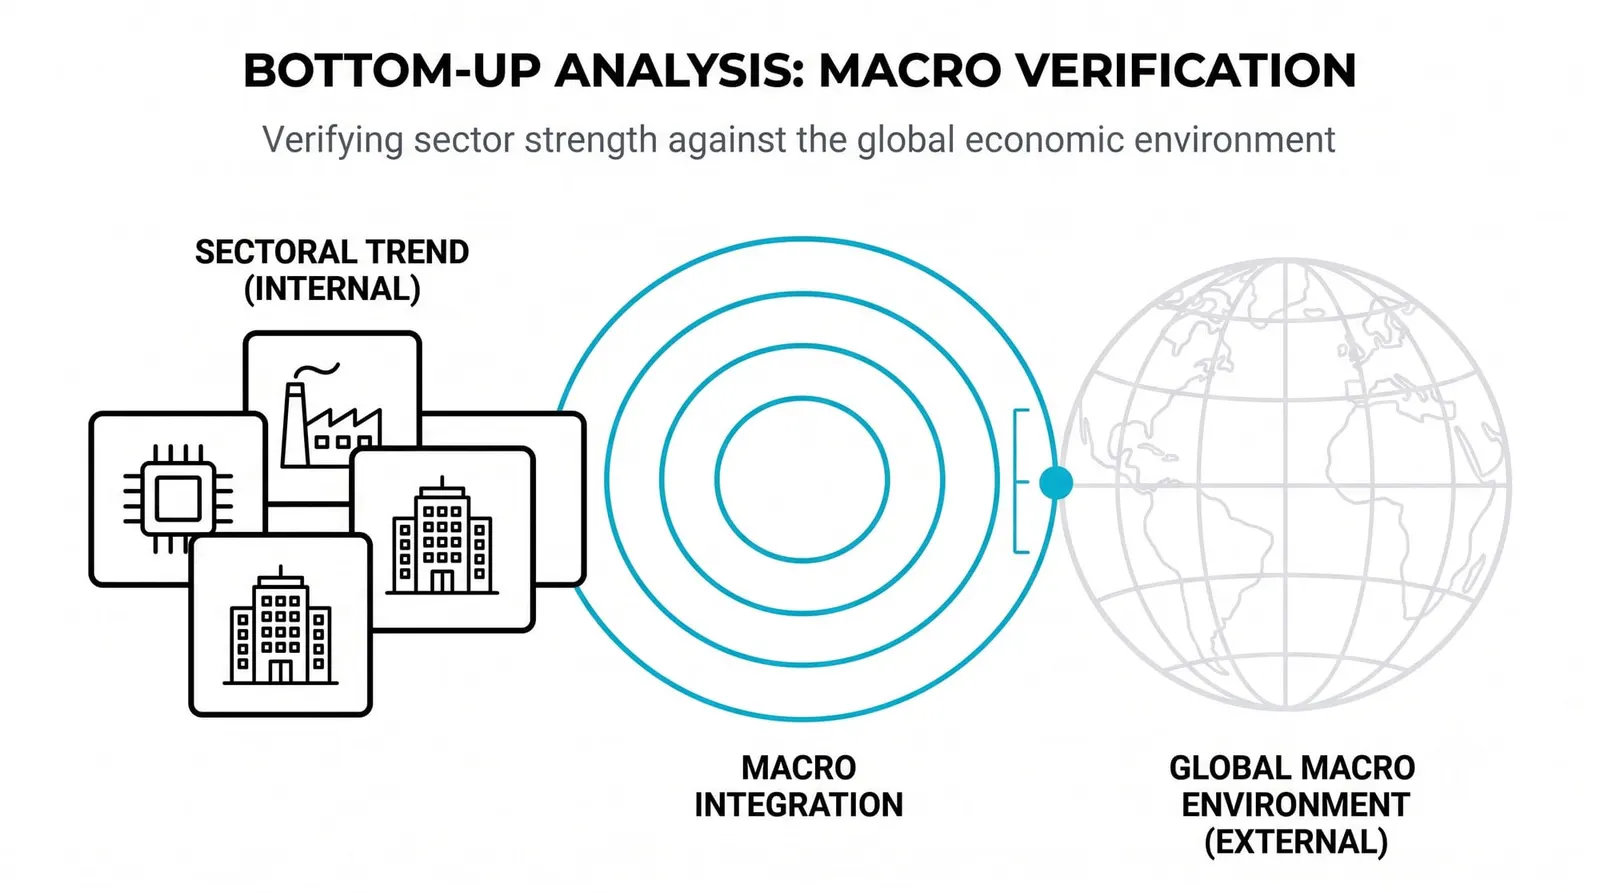
The outermost layer is the economy: interest rates, growth, and currency effects. Rates shape borrowing costs for every company. Growth shapes how much customers spend. Currency moves change what exporters earn and what importers pay. These forces sit underneath every sector, though they press harder on some than others.
The point of widening is diagnostic. You are trying to learn whether the asset's story is its own, its industry's, or the world's. Each answer implies a different shelf life for the trade. A company-specific problem might resolve in a quarter or two, when management acts or the market reprices. A sector-wide problem tends to last as long as the industry pressure lasts. An economy-wide force, like a rate cycle, can run for years and can flatten good and bad companies alike.
Shelf life is not a detail. It tells you how long your thesis can stay right, and how much macro noise it can survive before the wider layer overruns the narrower one.
Why Traders Favor This Direction for Individual Assets
Start with evidence quality. The asset's own numbers are the most specific and least arguable data in the entire stack. A company's reported costs are a fact about that company. An economist's growth forecast is an estimate about millions of companies at once. When you build from the asset outward, your foundation is the strongest material you have.
There is also a survival argument. A thesis built bottom-up survives even when the macro noise contradicts it. If you own a company because its business is genuinely improving, a scary headline about the economy does not break your reasoning. The thesis fails only when the asset itself fails, which is the one failure you can actually monitor. You can read the company's next report and check. You cannot check the economy's next report with the same precision, because the economy's numbers are slower, revised, and argued over.
Contrast that with the reverse direction. A thesis built on a macro view and then mapped down to an asset has two ways to die: the macro call can be wrong, or the macro call can be right while the specific asset disappoints anyway. Bottom-up removes one of those failure modes by anchoring to the layer you can verify.
None of this makes the wider layers optional. A great company in a collapsing sector is still swimming against the current. The method asks you to check the asset first, not to check only the asset.
Climbing From One Stock to the World
Here is a hypothetical with round numbers. A retailer warns that its profit will fall from 8 per share to 5. That is the raw fact. Bottom-up analysis turns it into a readable chain.
Layer one, the asset. You open the report and find that costs rose while sales held flat, so the margin shrank. The story, so far, belongs to this company. Maybe management over-expanded. Maybe it signed expensive leases. At this layer, the fix is company-specific and the problem could be short-lived.
Layer two, the sector. The same week, two competitors issue similar warnings. Now the pressure looks industry-wide. Whatever is squeezing your retailer is squeezing its rivals too, so switching to a competitor's stock does not escape it. The shelf life of the story just got longer, because industry pressures outlast individual earnings cycles.
Layer three, the economy. You trace the cost pressure and find wages and transport costs rising across the whole economy, in retail and well beyond it. Now the story belongs to the widest layer. The retailer's warning was the first visible symptom of a force that touches every business that pays wages and ships goods. That kind of force runs on the economy's clock, not the company's.
The widening turned one company's bad news into a chain with three links, and each link carries a different expiry date. That is what the method is for.
| Layer | Question it answers | Evidence you check | What it changes |
|---|---|---|---|
| The asset | Does this business work on its own? | Revenue, costs, debt, margins from its own reports | Whether the thesis has a foundation at all |
| The sector | Is the wider industry under the same pressure? | Competitors' reports, industry cost trends | Whether switching assets within the group helps |
| The economy | Is a wider force driving the pressure? | Rates, growth, wage and transport cost trends, currency moves | How long the story can run |
| The chain complete | Whose story is this, and when does it expire? | All three layers read in sequence | The shelf life you assign to the trade |
Bottom-Up Analysis, Answered
Can I skip the macro layer entirely?
No, because the macro layer is what sets the expiry date on your thesis. You can weight it less heavily than the asset layer, and many traders do. But a company-specific story that collides with an economy-wide force will usually lose, and you want to know that force exists before it arrives in the earnings report.
What if the asset looks great but its sector looks terrible?
Treat that as a warning, not a green light. Strong companies in weak sectors do exist, and some genuinely outperform their peers. But sector-wide pressure raises the bar: the company must keep beating its industry's tide quarter after quarter, and the moment it stumbles, it gets priced like the rest of the group. Size the position accordingly.
Does bottom-up work for currencies?
Only loosely, because a currency has no asset layer of its own. There is no company report to read. The narrowest checkable evidence for a currency is already macro: rates, inflation, trade flows. Bottom-up fits assets that have their own books, which means stocks above all, and to a lesser degree assets tied to a single issuer or project.
How many layers does a real analysis need?
Three is the working standard: asset, sector, economy. You can subdivide further, splitting the economy into domestic and global, but the returns shrink fast. If you can state whose story the asset is telling and roughly how long that story lasts, you have done the job the method exists to do.
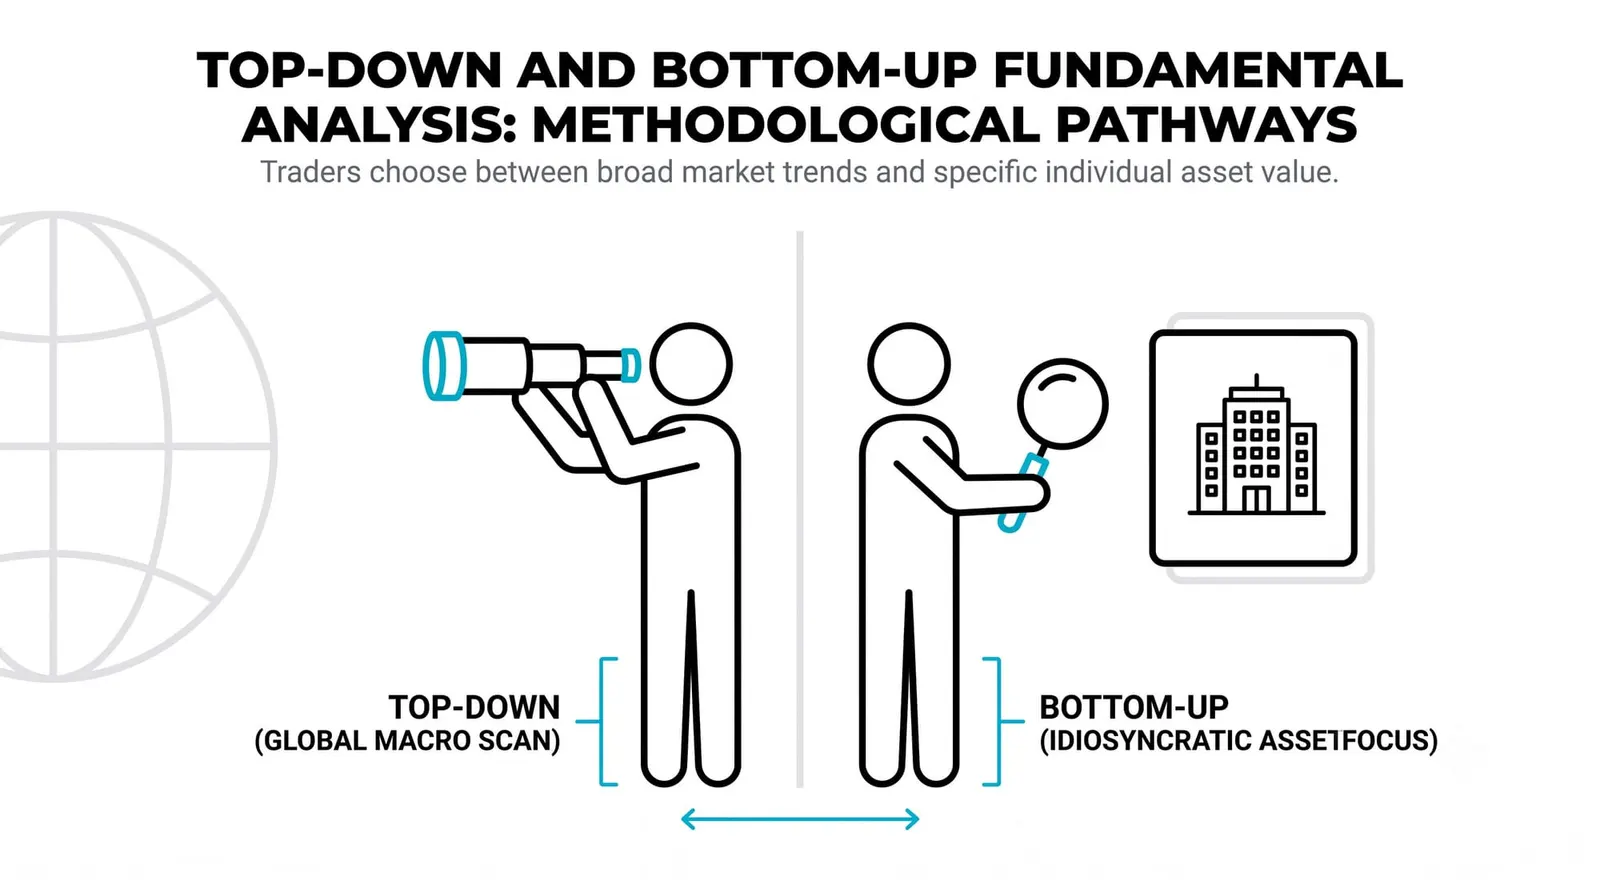
Once this direction feels natural, run it in reverse. The sibling lesson on top-down analysis starts at the economy and narrows down to the asset, and knowing both directions lets you check any thesis from whichever end the evidence is strongest.