Technical Analysis vs Fundamental Analysis
Technical analysis vs fundamental analysis is the oldest argument in trading, and it survives because both sides keep making money. Technical analysis reads what price is doing right now. Fundamental analysis reads what the thing underneath the price is worth. Everything else in this lesson is a working-out of that single difference: what each camp assumes, what data it trusts, how it trades, and where the two finally meet.

Think of it like valuing a house. One camp inspects the house room by room while the other studies the neighborhood, the schools, and where the city is growing; both claim to know what the house is really worth.
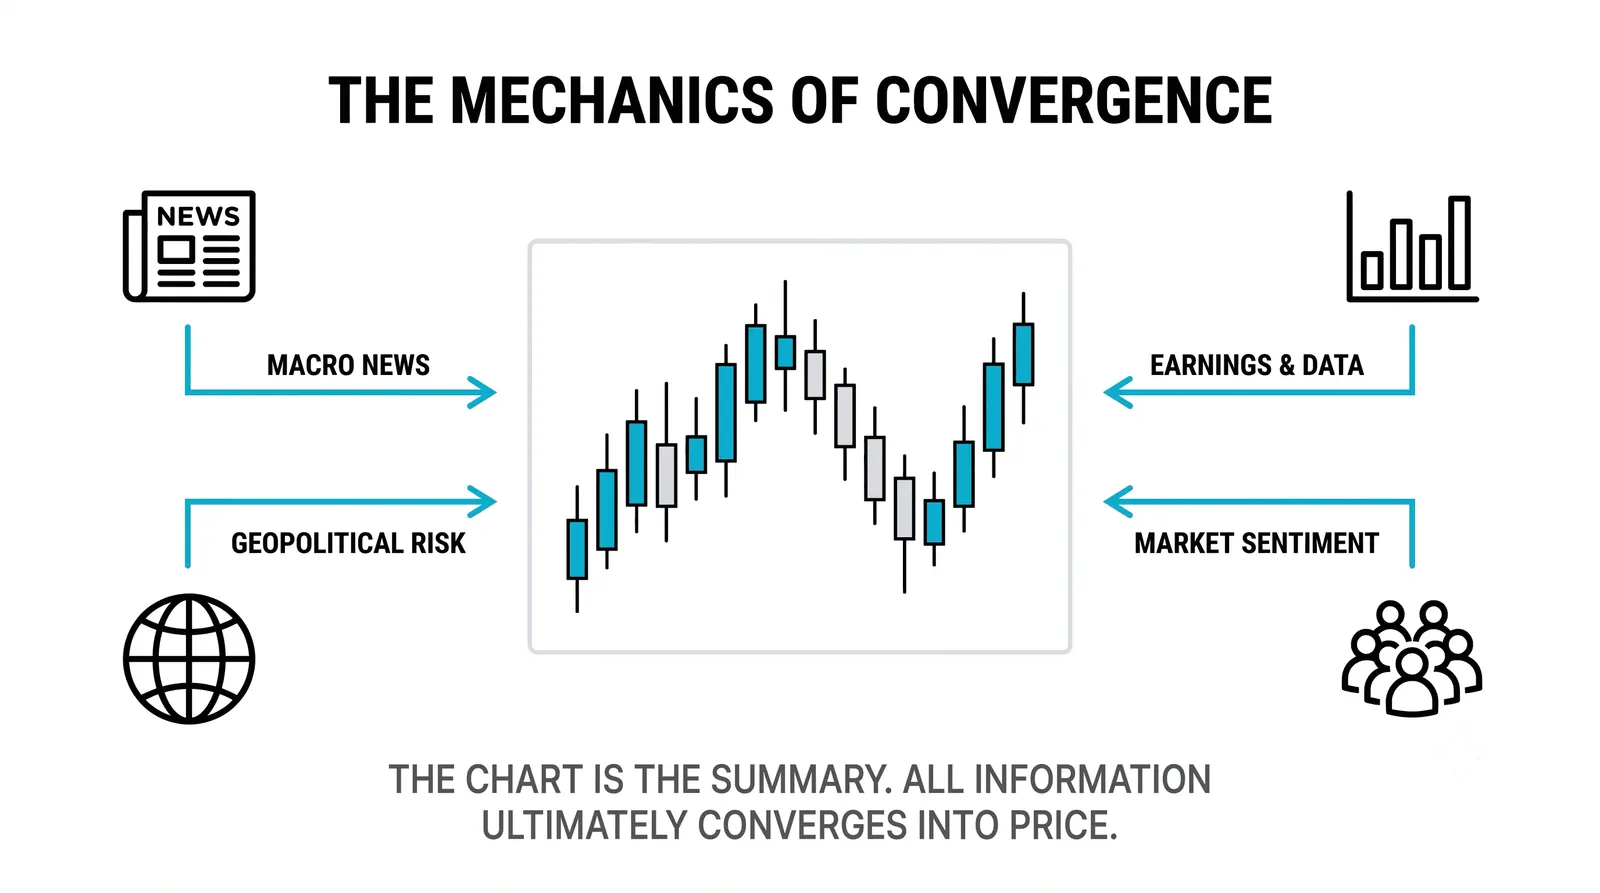
Two Different Ideas About Truth
The technician's core belief is simple: price already sums everything knowable. Every earnings report, every rumor, every fund manager's private model eventually shows up as someone buying or selling. The chart is the residue of all that activity. So why read the reports when you can read the result?
This makes the chart the shortest path to the truth. A technician does not need to understand a company's business to trade its stock. The pattern of buying and selling tells the story.
The fundamentalist starts from the opposite premise. Price wanders. It overshoots on greed and undershoots on fear, sometimes for months. Underneath the wandering sits a real business with real cash flows, and that value acts like an anchor. The fundamentalist's job is to estimate the anchor and wait for price to drift back toward it.
Neither camp is naive. Technicians know price can stay irrational. Fundamentalists know value estimates can be wrong. They just disagree about which error is more dangerous.
The Evidence Each Camp Trusts
A technician's raw material is price, volume, and time. That is all the evidence a technician accepts. From those three inputs come trends, ranges, support and resistance, momentum, and every indicator ever built. The appeal is cleanliness. Price is a fact. A trade either happened at that level or it did not.
A fundamentalist works from messier material: earnings, revenue growth, assets, debts, cash flow, interest rates, competitive position, management quality. This data is richer but softer. It arrives quarterly, gets revised, and requires judgment to interpret. Two honest analysts can read the same balance sheet and reach opposite conclusions.
Notice the trade-off. Technical data is precise but shallow. Fundamental data is deep but imprecise. Your temperament will pull you toward one before your reasoning does.
Clocks and Execution
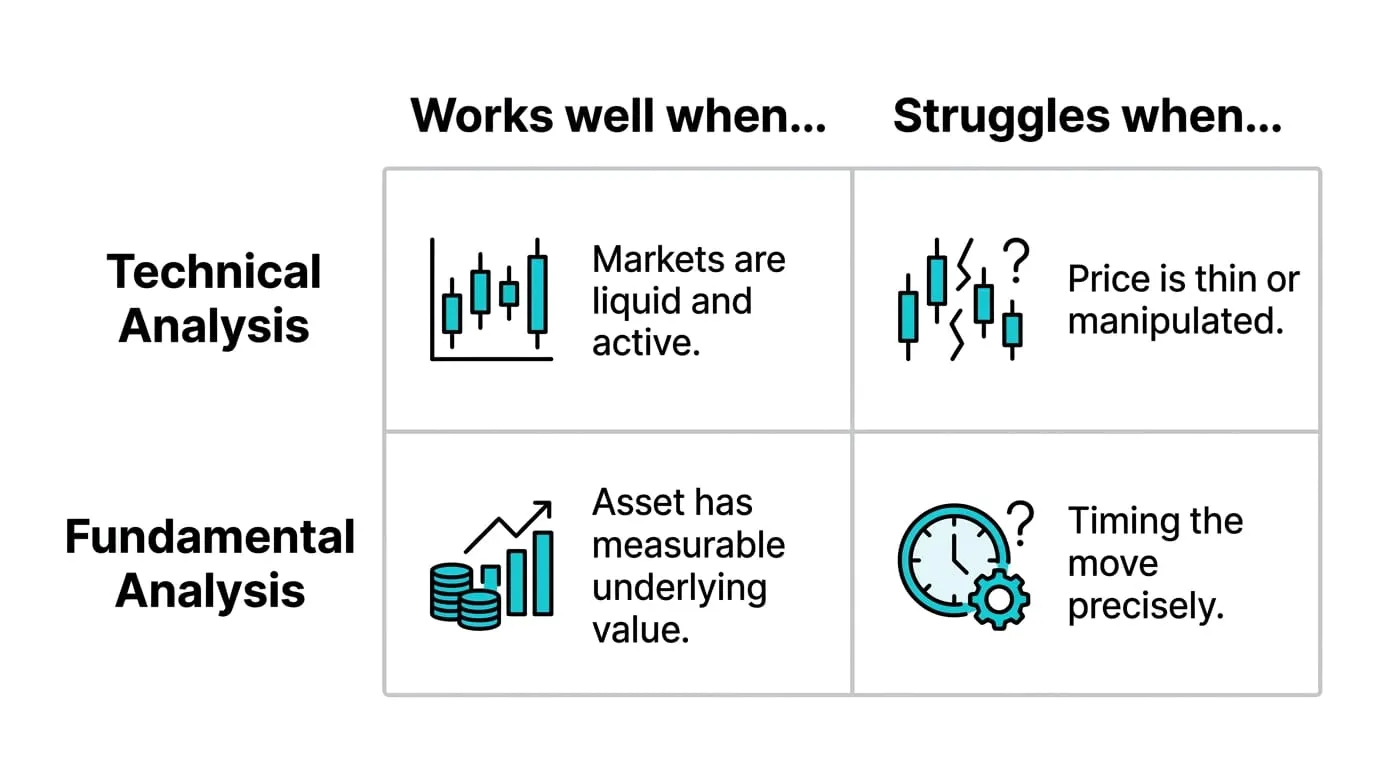
Technical analysis scales down. The same logic that reads a monthly chart reads a five-minute chart, so technicians operate on horizons from minutes to months. Because the signals are defined by price levels, entries and exits can be exact. You can write the rules down, test them on old data, and know precisely where you are wrong.
Fundamental analysis scales up. Businesses change slowly, so the natural holding period runs from quarters to years. The output is conviction about direction, not timing. A fundamentalist can be certain a stock is cheap and have no idea whether it gets cheaper first. It often does.
This is the practical dividing line for a new trader. If you want defined risk and frequent feedback, technicals fit. If you want to hold through noise and act rarely, fundamentals fit. Picking the wrong clock for your temperament is how good analysis turns into bad trading.
A Hypothetical: One Stock, Two Readings
Imagine a stock that drifts from 30 down to 24 over four months on no news. Purely hypothetical, no real company involved.
The technician sees a clean sequence of lower highs and lower lows. Every bounce fails at a lower price than the last. The trend is down, so the technician stays out, or sells the weak bounces near 26 and 25 with a stop just above each lower high. The chart says sellers are in control, and the chart is the whole argument.
The fundamentalist sees the same decline and asks a different question: did the business change? They recheck the earnings, the debt, the cash flow. The model says the company is worth roughly what it was worth at 30. Nothing broke. So at 24 the discount has widened, and the fundamentalist starts buying, accepting that price could fall further before it recovers.
Four months later the stock trades at 27. Both were right on their own clocks. The technician avoided the slide and pocketed the short-side bounces. The fundamentalist bought the discount and sits on a gain with a longer horizon still open. Same chart, same four months, two coherent plans. The lesson is not that one camp won. It is that each camp answered the question it actually asked.
The Two Camps as Working Styles
Strip away the philosophy and you are left with two different daily routines. This table compares them as ways of working, not as answers to any single event.
| Aspect | Technical Analysis | Fundamental Analysis |
|---|---|---|
| Typical evidence read | Price, volume, chart structure across timeframes | Earnings, assets, debts, cash flow, rates, growth |
| Decision style | Rule-based, triggered by price levels | Thesis-based, triggered by value gaps |
| Natural holding period | Minutes to months | Quarters to years |
| Precision of entries and exits | Exact levels, easy to test and automate | Approximate zones, hard to backtest |
| Main risk when used alone | Trading noise; ignoring a real change in the business | Catching a falling price; value traps that never recover |
| Feedback speed | Fast; many trades, quick lessons | Slow; few decisions, lessons take years |
Read the last row twice. Fast feedback teaches quickly but tempts you to overtrade. Slow feedback builds patience but lets a bad thesis run for years before the market grades it.
Where the Two Finally Meet
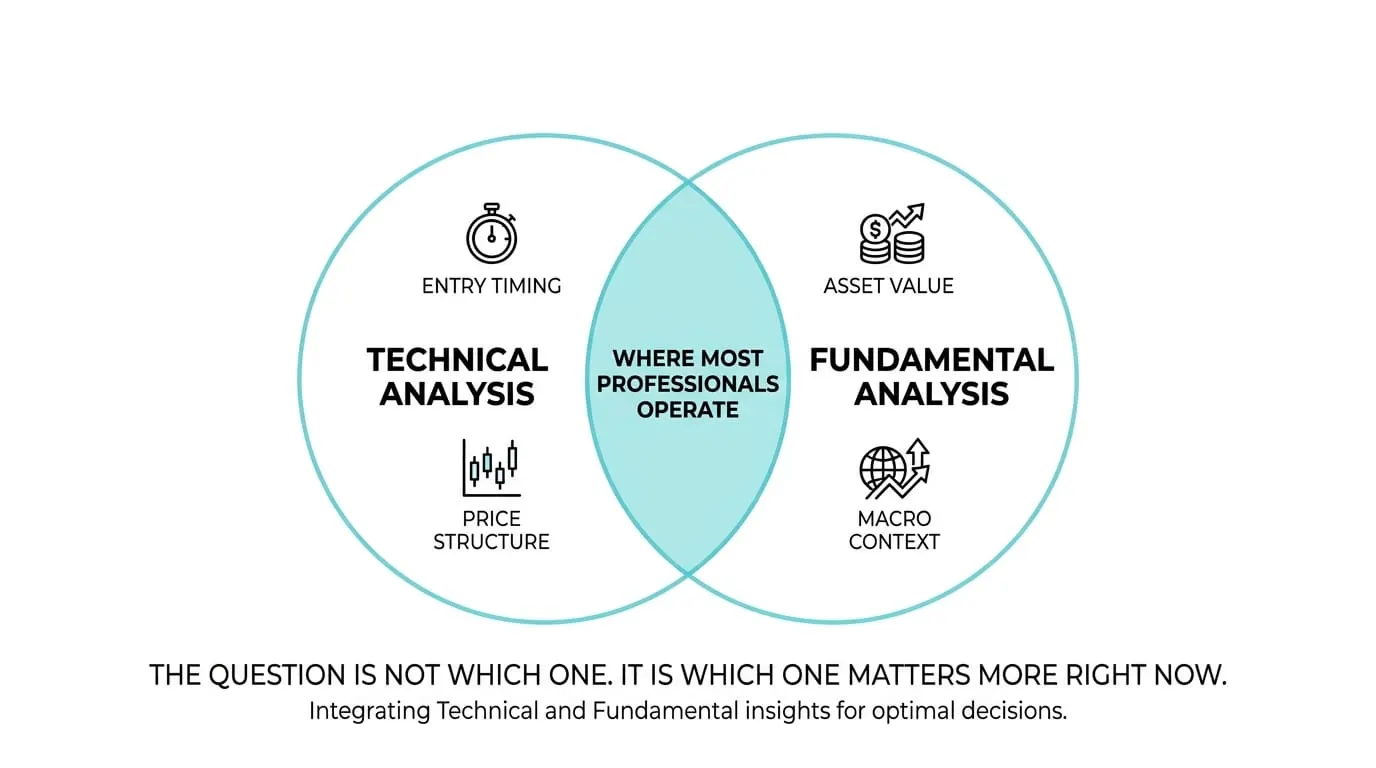
In practice, most experienced traders stop choosing. The common split is simple: fundamentals pick what to trade, technicals pick when. A trader builds a watchlist of businesses they believe in, then waits for the chart to confirm that other buyers agree before committing money.
The blending runs the other way too. Even die-hard chartists glance at earnings dates, because holding a technical position through a scheduled report is a coin flip dressed up as analysis. And even strict value investors check the chart before buying, if only to avoid stepping in front of an obvious downtrend on day one.
What matters is that each method covers the other's blind spot. Fundamentals keep you from shorting a great business because of an ugly week. Technicals keep you from buying a great business at a terrible moment. Used together with honest position sizing, the argument between the camps stops being an argument.
Questions About Technical vs Fundamental Analysis
Can one person use both?
Yes, and most professionals do. The clean division is to let fundamentals select your candidates and technicals time your entries. The mistake is mixing them randomly, switching to whichever one currently supports the trade you already want.
Which is faster to learn?
Technical analysis is faster to start because the dataset is small and the feedback is quick. You can learn the core patterns in weeks and test them immediately. Fundamental analysis takes longer because reading financial statements and judging businesses is a skill built over years. Faster to start does not mean easier to master.
Which fits a small account and limited screen time?
Fundamentals fit limited screen time better, since decisions are rare and slow. Technicals fit a small account's need for defined risk, since stops sit at exact levels. If you have both constraints, the practical route is longer-timeframe technical trading: daily or weekly charts, checked once a day, with hard stops on every position.
Does one disprove the other?
No. They measure different things on different clocks, so they rarely collide head-on. A stock can be technically weak and fundamentally cheap at the same time, and both statements can stay true for months. The hypothetical above showed exactly that. Treat the camps as tools with different jobs, not rivals fighting for one trophy.
Your next step is to pick one liquid market and read it both ways for a month: mark the trend and key levels on the chart, then write one paragraph on what the underlying business or economy is actually doing. The gaps between those two readings are where your education lives, and the lessons ahead will show you how to close them.