The Economic Calendar: A Trader's Guide
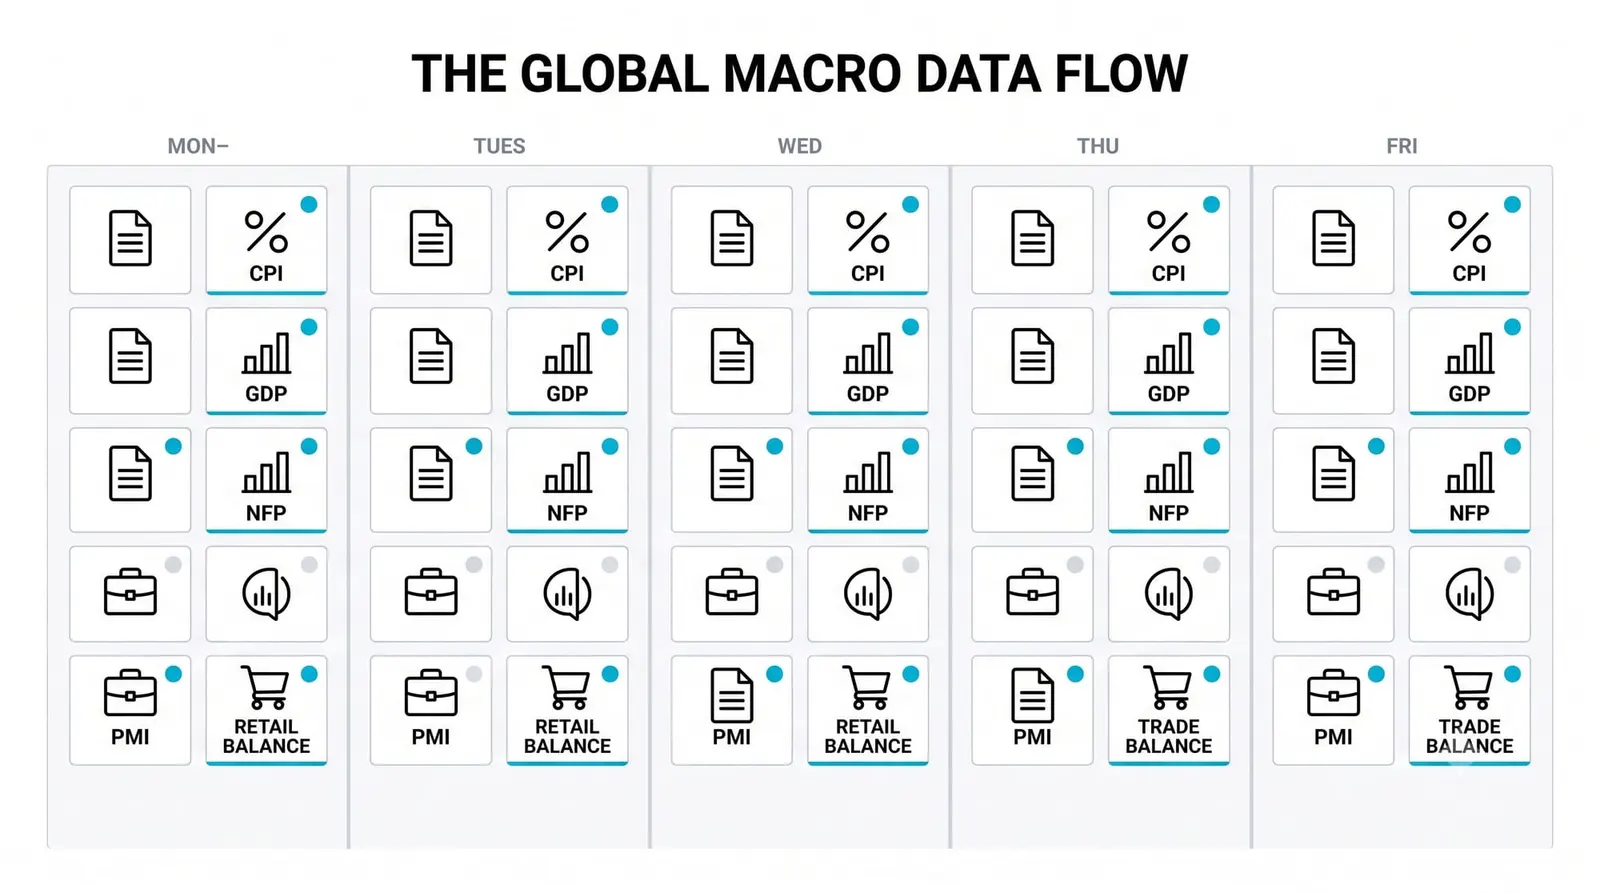
The economic calendar is the schedule of every scheduled data release, central bank decision, and major earnings date, each listed with its time, its consensus expectation, and its previous value. Used well, it tells you which hours of the week carry risk and which are quiet. More than that, it turns surprise into something you can plan around.

Surprise is what actually moves price. You learned that in the earlier lesson on news events and expectations, so we will not rebuild it here. What the calendar gives you is the timing. You may not know what a report will say, but you know exactly when it will say it, and that alone changes how you manage a position.
Think of the calendar as a tide table for the market. It does not make the weather, but it tells you when the water is about to move. A sailor who checks the tide table is not predicting the sea. He is simply refusing to be caught off guard by something that was published in advance.
Reading a Calendar Entry: Time, Expected, Previous
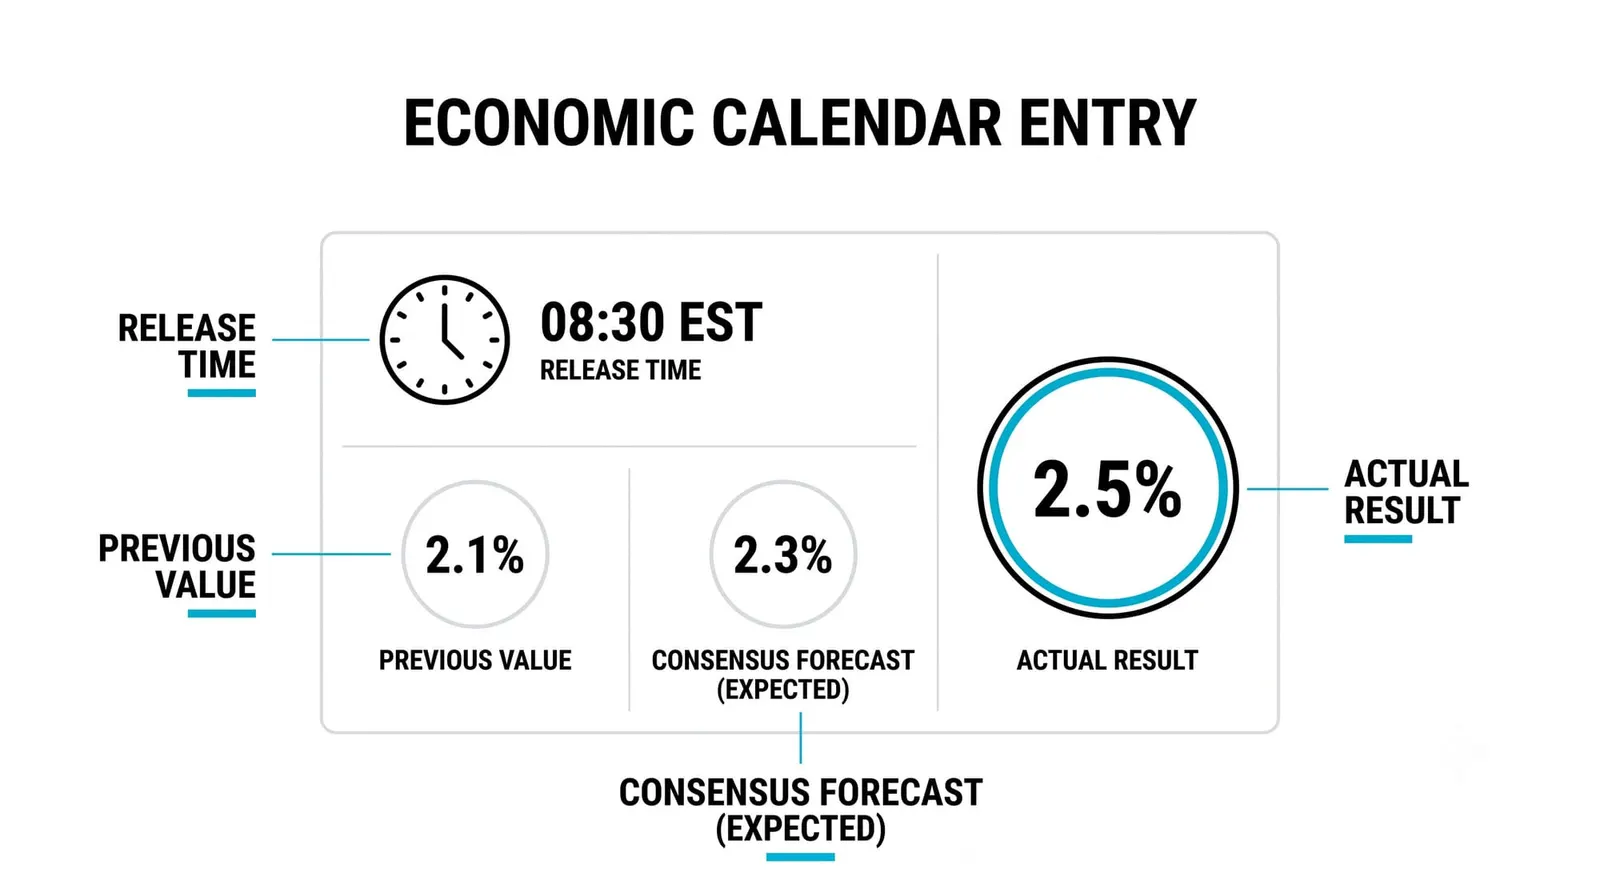
Every calendar entry carries three columns that matter. Time, expected, and previous. Each one answers a different question, and confusing them is a common beginner mistake.
The time column is more precise than most people assume. Major releases come out at a fixed, published moment, down to the second. An employment report lands at an exact minute, not "sometime in the morning." This matters because price can jump within the first seconds of a release. If you are holding a position through one, you need to know the exact moment your risk window opens, not a rough idea of it.
The expected column is the consensus. It is the market's median guess, built through the week as analysts and economists publish their forecasts and data providers aggregate them. By the time the release lands, the consensus number is already embedded in price. Traders have positioned for it. That is why a number that matches expectations often produces a dull reaction, even when the number itself looks dramatic.
The previous column is the baseline. It shows the last reading of that same series. It matters for two reasons. First, it gives the new number context: a reading of 3.1% means one thing after a 3.0% and another after a 3.6%. Second, the previous value itself can be revised. Agencies routinely restate old numbers when better data arrives, and a revision can shift the story as much as the new print does.
Read the three columns together and a calendar entry becomes a small sentence. At this exact time, the market expects this number, against that baseline. Your job is to decide whether you want exposure when that sentence finishes.
How Traders Filter a Busy Calendar
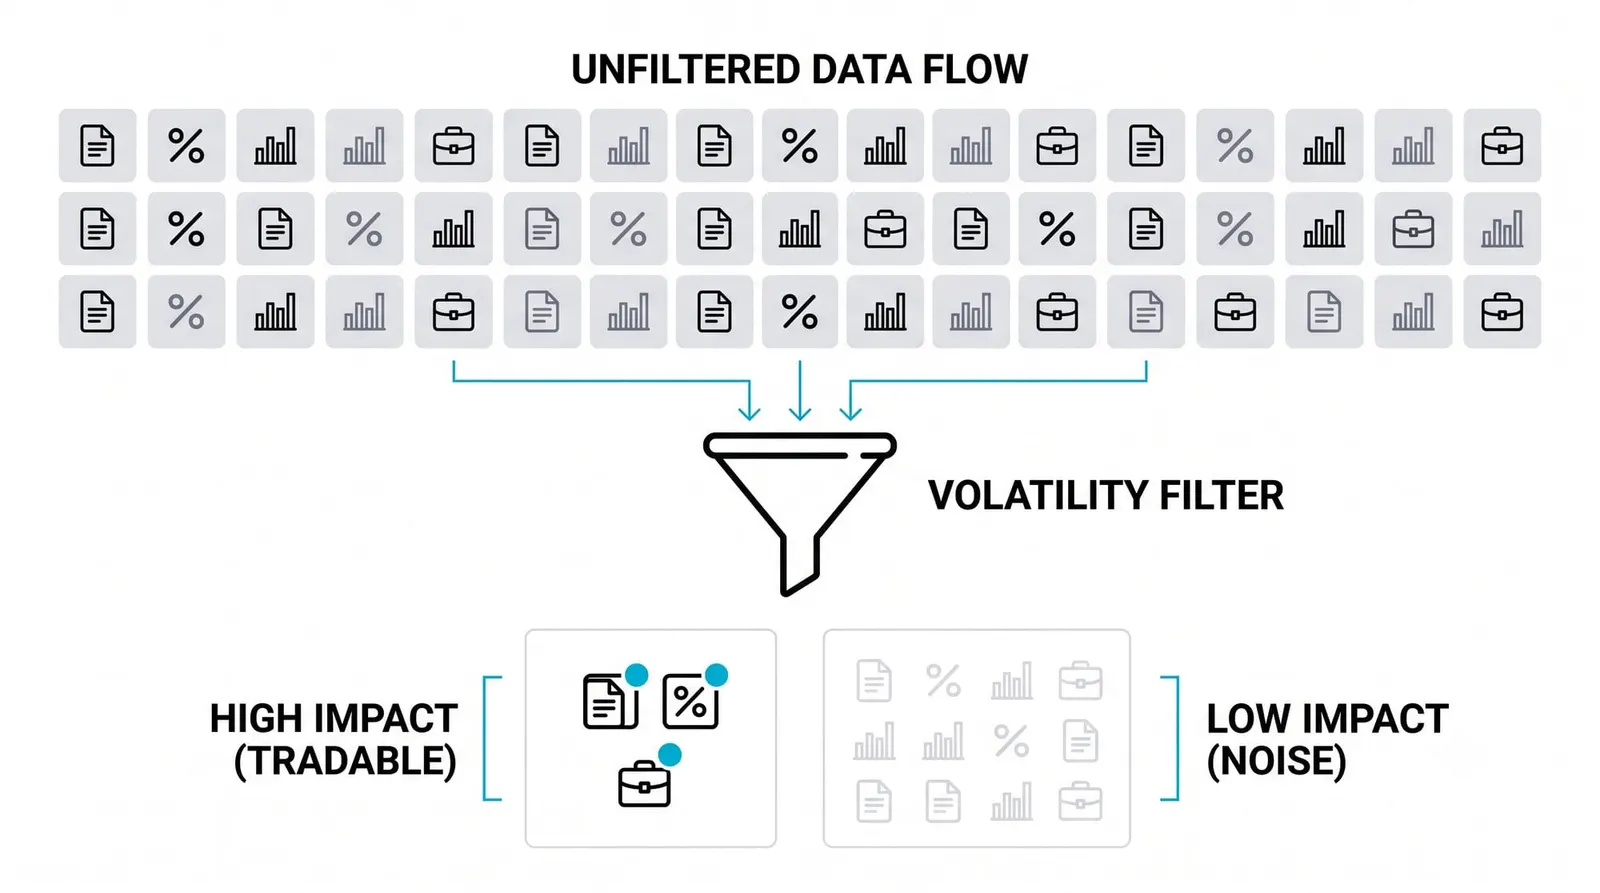
A typical week lists dozens of releases. Most of them will not move anything you trade. Filtering is the skill.
Top-tier releases sit at the top. These are the reports that reprice whole markets: major inflation readings, headline employment reports, and growth figures from large economies. They move bonds, currencies, indices, and commodities at once. Later in this level you will study the biggest ones individually, including CPI, NFP, and PCE, each in its own lesson. For now, treat them as the entries that can invalidate a technical setup in seconds.
Central bank decisions belong in the same tier. Those were covered in their own lessons earlier, so the short version is enough: a rate decision and the statement around it can reset the entire rate path the market has priced in.
Mid-tier releases are surveys and secondary readings. Purchasing manager indexes, consumer confidence, regional factory surveys. They nudge price. Sometimes they matter because they arrive early in a quiet stretch and hint at what the top-tier numbers will show. Usually they produce a brief flutter and fade.
Then there is noise. Minor releases from small economies, revised figures nobody trades, weekly statistics that repeat the same story. They fill the calendar without filling your decision-making.
The cleanest filter is mechanism. Ask one question about each entry: does this release touch rates, growth, or inflation? Those are the three channels your macro framework runs on. If a release feeds one of them for a market you trade, it earns a mark. If it touches none of them, skip it.
Watching everything is how you end up watching nothing.
Building the Habit of Checking It Daily
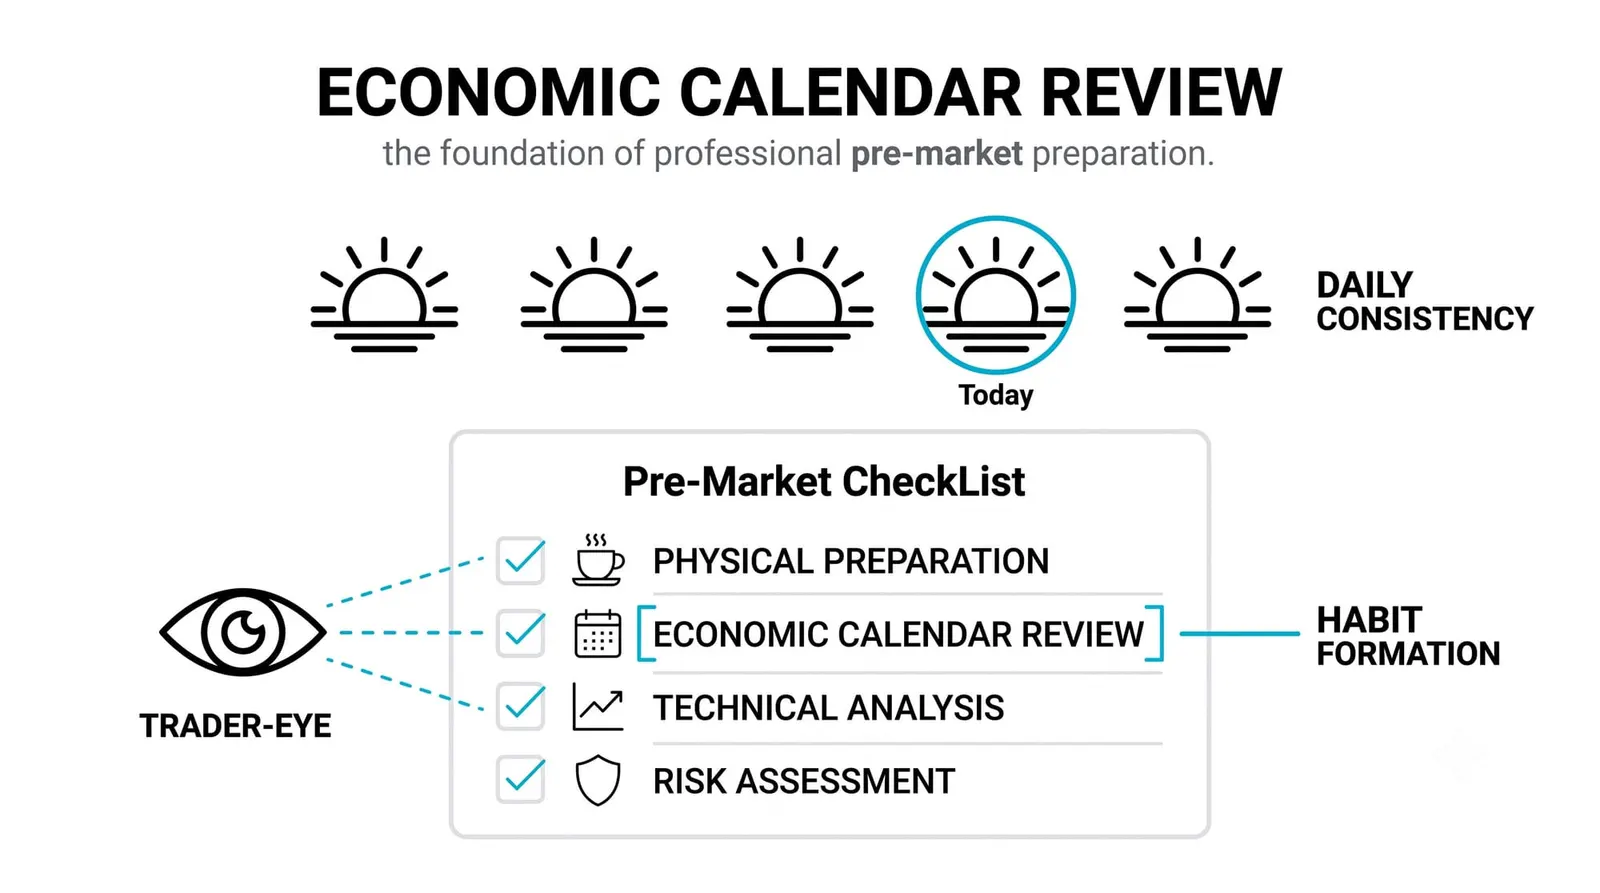
Start each session with five minutes on the calendar. Not thirty. Five. You are looking at what lands during your trading hours today and tomorrow, and whether any of it is top-tier.
On Sunday or before your first session of the week, scan further ahead. Mark the week's top entries: the central bank decisions, the major inflation and employment prints, anything that sits in your trading window. Write them down or flag them in your platform. This takes minutes and removes the most avoidable mistake in trading, which is being surprised by something that was scheduled.
Then connect the marks to your sizing. The practical rule most experienced traders follow is simple: position size goes down as a known volatile window approaches. Some close exposure entirely before a top-tier release. Some halve it. Some stand aside from new entries in the minutes around the print and re-engage after the first reaction settles. Which version you choose matters less than having a version, chosen in advance, in writing.
The opposite approach is discovering the volatility live. You enter a trade at 8:29, the number drops at 8:30, and your stop is hit by a move that had nothing to do with your setup. That loss was not bad luck. It was a planning failure, and it is the kind the calendar exists to prevent.
One Trader's Week on the Calendar
Here is a hypothetical week, built from round numbers, to show the habit in practice.
On Sunday evening, a trader reviews the coming week. Tuesday holds a mid-tier business survey at 10:00. Wednesday holds a central bank rate decision at 14:00, with the statement and press conference after. Thursday holds a major inflation report at 8:30. She marks all three.
Tuesday arrives. She notes the survey, glances at the result when it lands, and keeps trading normally. The survey nudges price for a few minutes and fades. Nothing to do.
Wednesday is different. She normally trades with a position risk of 1.0% of her account. Going into the rate decision, she cuts her open exposure in half and places no new entries after midday. She does not know what the decision will be. She does not need to. She knows that at 14:00 the market will reprice, and she has chosen in advance how much of that repricing she wants to own.
Thursday, the same logic applies to the inflation window. No new entries between 8:15 and 9:00. Her remaining positions are sized so that a sharp move either way is survivable. After the first reaction settles, she reads the number against the consensus and the previous print, then decides whether the day offers anything.
Notice what the week contained. No predictions. No calls on what the data would say. The outcomes stayed unknown from Sunday through Thursday. The only thing that changed was that every surprise arrived at a known time, against a known expectation, with her exposure already adjusted. The timing surprise, which is the part fully within a trader's control, was gone.
| Calendar entry | How often it lands | What a trader does about it |
|---|---|---|
| Top-tier data (inflation, employment, growth) | Monthly, sometimes weekly across economies | Mark it in advance, reduce size before it, avoid new entries inside the release window |
| Central bank decisions | Roughly six to eight times a year per major bank | Treat as the highest-risk hours of the month; cut exposure and wait for the statement |
| Mid-tier surveys | Several times a week | Note them, watch for hints about coming top-tier prints, rarely change plans over them |
| Earnings (for equity traders) | Clustered in quarterly seasons | Check dates for any stock held; expect gaps at the open after a report |
The Economic Calendar, Answered
Do I need to watch every release?
No. Filter by mechanism and by what you trade. If a release does not touch rates, growth, or inflation in a market on your screen, it is background. Most weeks, a trader following one or two instruments has three to five entries that genuinely matter.
What do the importance stars mean?
They are the calendar provider's rating of a release's typical market impact, usually one to three stars or a color code. Treat them as a starting filter, not a final answer. A three-star rating is usually right, but your own mechanism check is the better test, because a mid-tier release can matter enormously when the market is fixated on one theme.
Why does a number matter one month and not the next?
Because attention rotates. When inflation is the market's dominant concern, every inflation-adjacent release gets a big reaction and employment fades into the background. When the focus shifts to growth, the same reports swap roles. The calendar tells you when releases land; the macro framework tells you which ones the market currently cares about.
How far ahead should I plan my week?
Mark the full week before it starts, then refine daily. The weekly pass catches the big entries so nothing top-tier surprises you. The five-minute daily check catches anything that was rescheduled or added. Beyond one week, you only need awareness of the next central bank decision dates, since those anchor positioning well in advance.
The calendar is the scheduling layer. The next lessons take you inside the biggest entries on it, starting with the inflation reports that move every market you trade.