GDP: What It Measures and How to Trade It
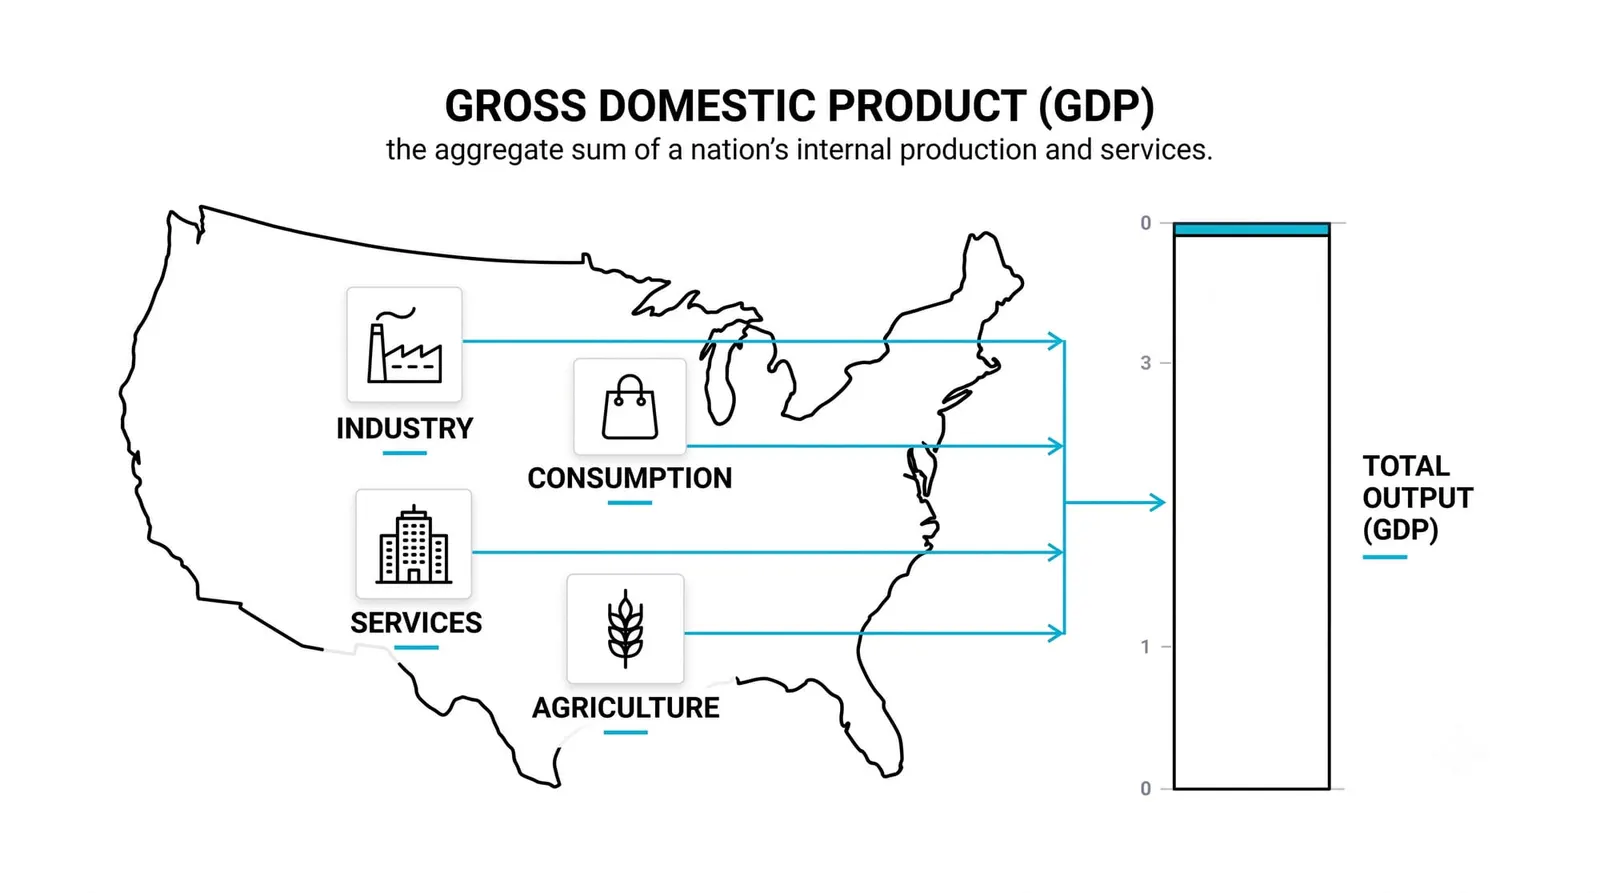
GDP, gross domestic product, measures the total market value of all final goods and services an economy produces within a period, usually counted by quarter. It is the single number that anchors the entire macro conversation, because everything else you have studied this level, from CPI to payrolls to retail sales, is a partial view of the same machine.

Think of GDP as the odometer reading after a year of driving: the monthly releases you already know are speedometer glances, useful, immediate, and much noisier. Retail sales tells you what households bought last month. NFP tells you how many jobs were added. GDP gathers all of that, adds the pieces those reports miss, and tells you how far the economy actually traveled. That is why a quarterly number most traders barely watch still sits at the center of every serious macro discussion.
One more piece of context before the mechanics. Earlier in this level you studied the economic cycle: expansion, peak, contraction, trough. GDP is the instrument that measures that cycle. When economists debate whether the economy is in recession, they are debating what the GDP readings, and their close relatives, are doing.
What GDP Actually Measures
The word that does the heavy lifting is "final." GDP counts final goods and services only, meaning products sold to their end user. A car counts. The steel, glass, and tires inside it do not count separately, because their value is already inside the car's price. Counting both would double-count the same output, and the total would flatter the economy.
The same logic applies to services. A haircut counts. An accountant's work for a business counts as part of that business's output, not on its own. The rule keeps the measure honest: one unit of economic value, counted once, at the point it reaches its final buyer.
Statisticians can reach this total three ways. The production approach sums the value added at each stage of output. The income approach sums everything earned, wages, profits, rents, interest. The expenditure approach sums everything spent. In theory all three agree, because every dollar spent is a dollar earned by someone. In practice they differ slightly due to measurement gaps, and agencies publish a statistical discrepancy.
The expenditure approach is the one traders live with, and it decomposes into four blocks:
- Consumption: household spending on goods and services. In most developed economies this is the largest block by far.
- Investment: business spending on equipment, structures, and inventories, plus residential construction. Despite the name, this has nothing to do with buying stocks.
- Government spending: public consumption and investment, from infrastructure to salaries.
- Net exports: exports minus imports. Imports subtract, because they are spending that leaked abroad rather than buying domestic output.
Retail sales, which you studied earlier in this level, feeds directly into the consumption block. Its control group, the subset that strips out volatile categories, is a direct input into the consumption estimate. So when you read a retail sales release, you are reading a preview of GDP's biggest component.
Headline, QoQ, YoY: Making Sense of the Report
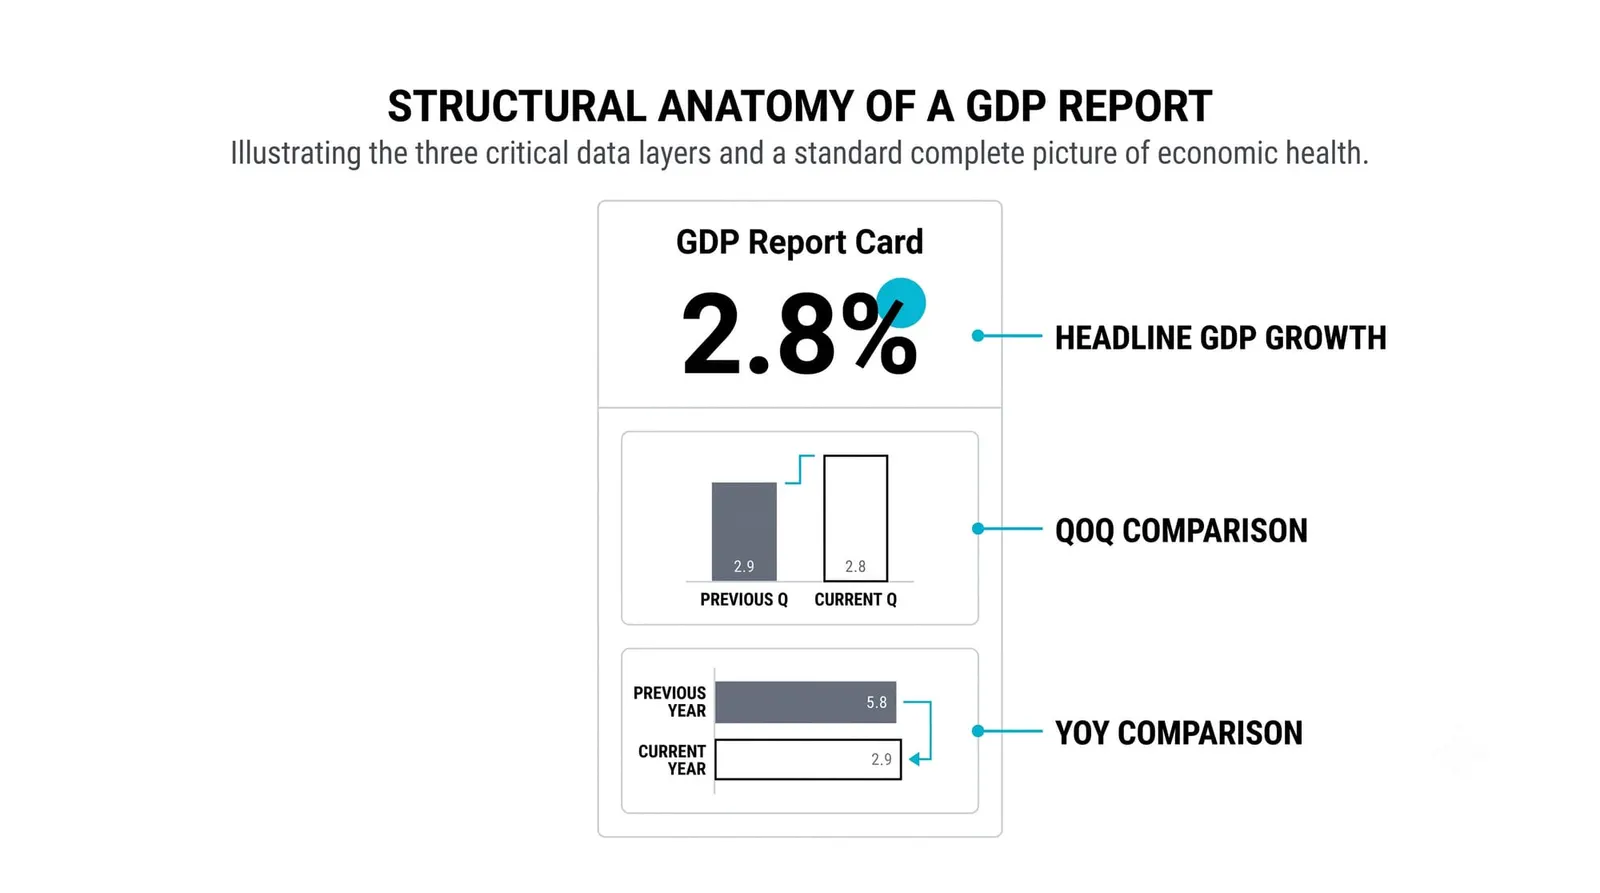
Open a GDP report and the first number you see is usually a quarter-over-quarter annualized rate. The United States popularized this convention: take one quarter's growth, compound it as if that pace held for a full year, and publish that. A quarter that grew 0.75 percent becomes a headline near 3 percent. The figure sounds like a year's performance but describes three months.
This convention cuts both ways. It makes small quarterly moves readable, and it makes one-off swings look enormous. A single distorted quarter, annualized, can print a headline that terrifies or thrills people who stop reading there.
The year-over-year reading is the steadier lens. It compares output to the same quarter a year earlier, which smooths seasonal quirks and one-off shocks. It moves slower, which is exactly the point. Traders who want the trend watch YoY; traders who want the momentum watch the quarterly pace. Both are in the report.
Then there are revisions. Each quarter gets three estimates: an advance reading roughly a month after the quarter ends, a second estimate as fuller source data arrives, and a third with more complete information. On top of that, agencies run annual benchmark revisions that can rewrite several years of history at once. The number you traded on release day is a first draft. Treat it that way.
Why Strong Growth Doesn't Mean Good News for Everyone
A headline growth rate is a sum, and sums hide their ingredients. Two quarters can print the same number and describe completely different economies, depending on which block did the work.
Composition is where the traps live. Consider imports. Because net exports subtract imports, a quarter of booming consumer demand that pulls in foreign goods can show trade dragging the headline down, even while domestic demand is red-hot. The reverse also happens: imports collapse because demand is weak, and net exports flatter the headline of a sick economy.
Inventories are the other classic trap. When businesses build stockpiles, that build counts as investment and lifts GDP. But a build is borrowed from the future. Next quarter, firms sell from the shelf instead of ordering new production, and the same mechanism subtracts. A quarter flattered by inventories is often followed by a quarter punished by them.
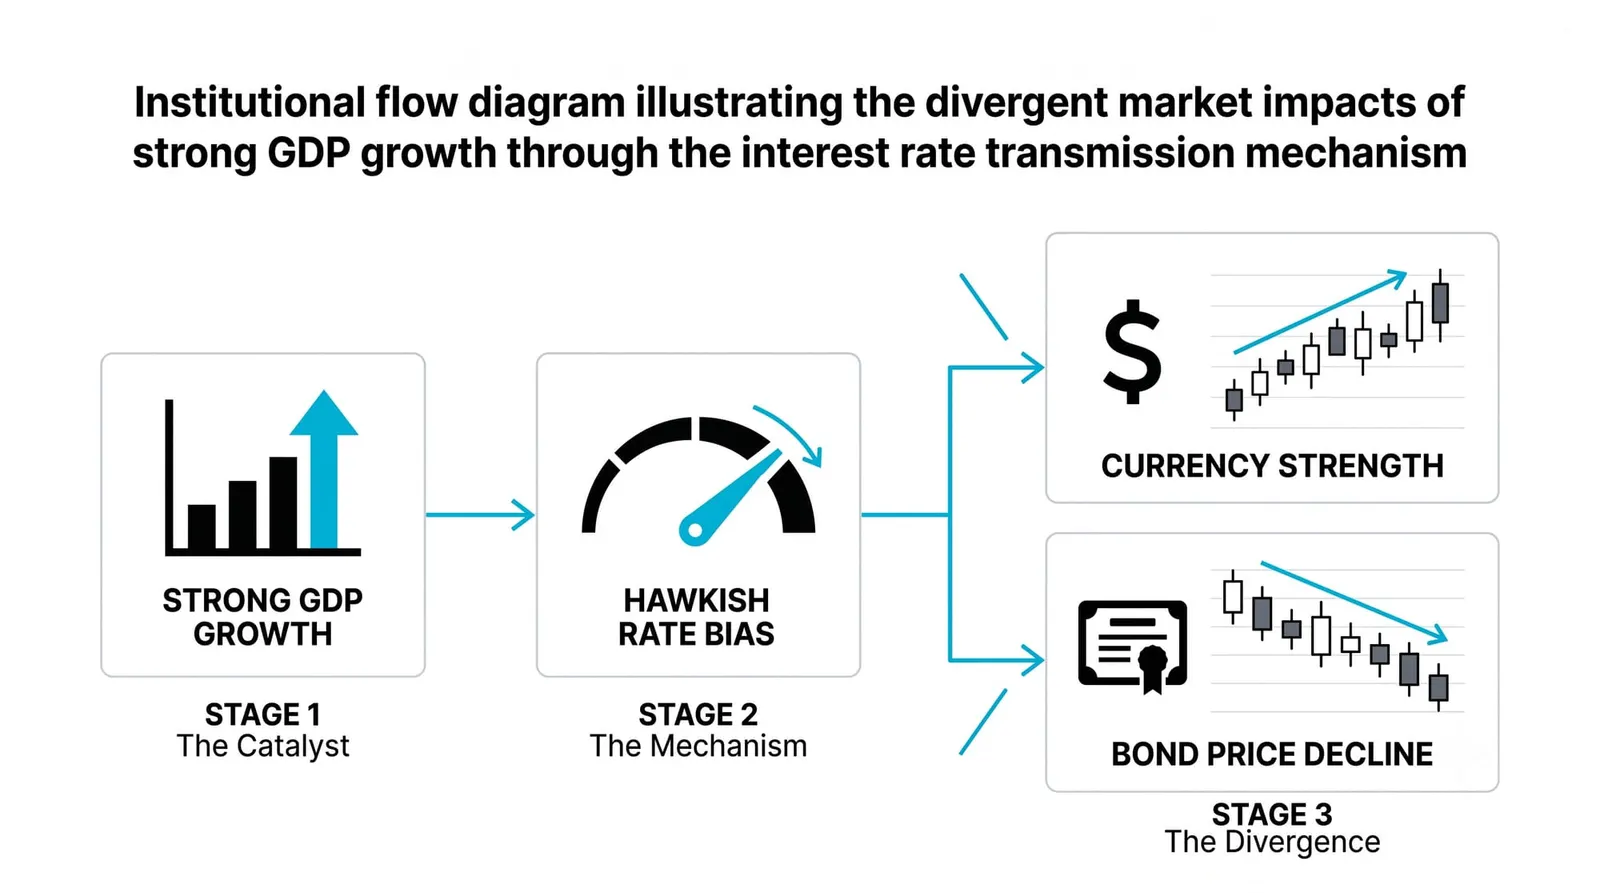
Markets understand this, which is why they never trade the headline alone. They trade two things: the gap between the print and the expectation, and the mix underneath. A strong headline built on inventory accumulation can sink a currency. A soft headline built on a temporary import surge can lift one. The headline is the invitation to read further, nothing more.
Why the GDP Release Rarely Shocks the Market
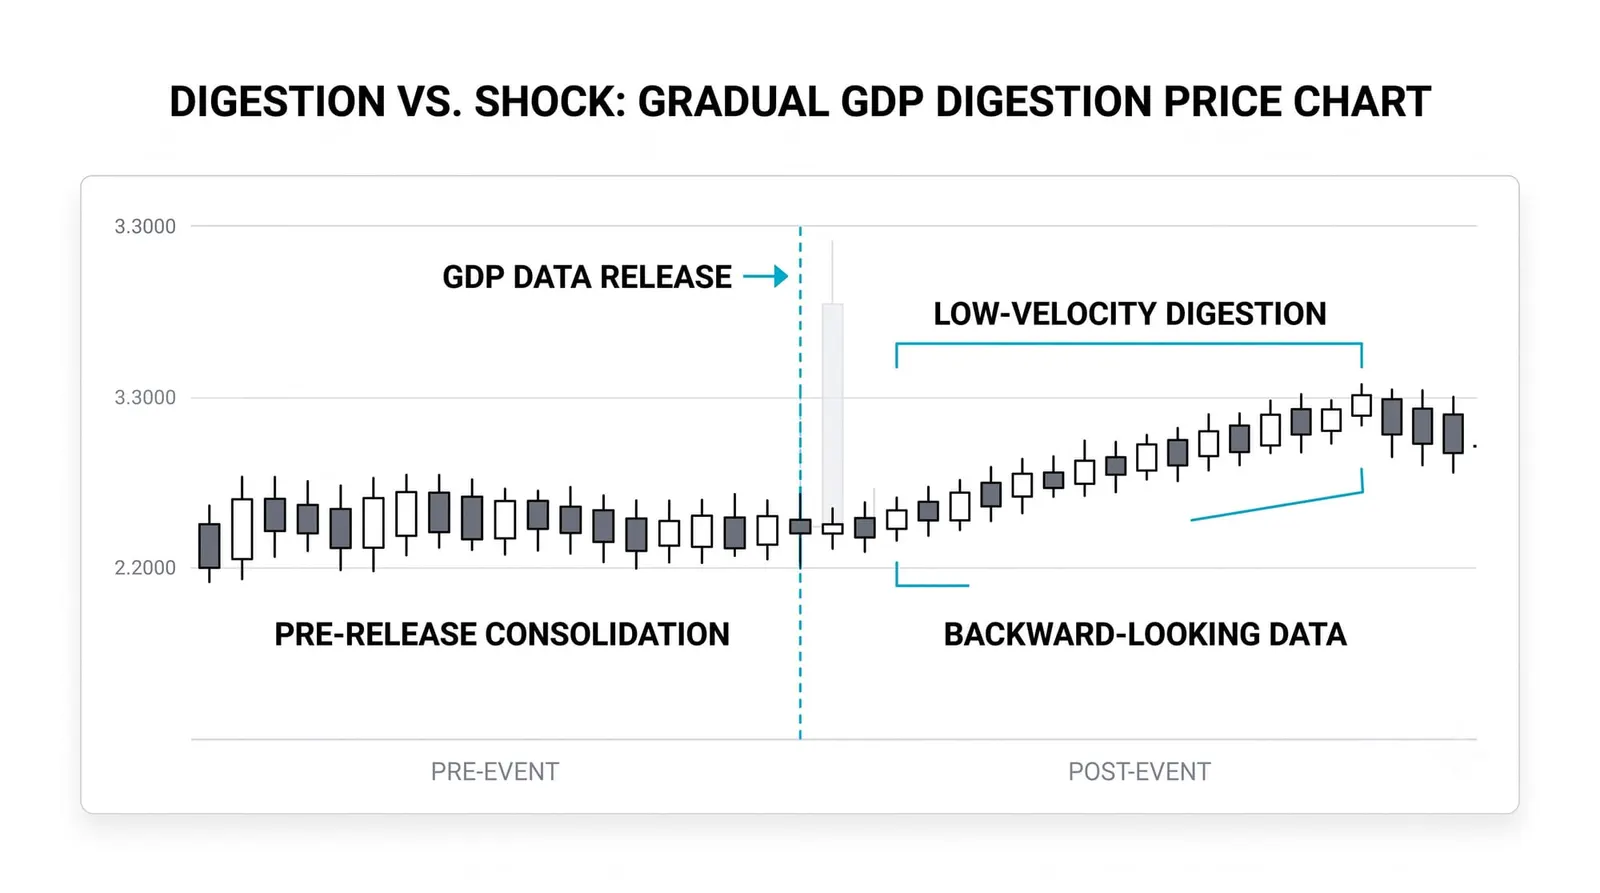
By the time GDP prints, most of its contents are already public. You have spent this level studying the leaks: retail sales previews consumption, durable goods and construction data preview investment, trade balance previews net exports, government budgets are known in advance. Analysts assemble running GDP estimates all quarter long, and some central banks publish their own nowcasts.
So the release confirms more than it reveals. The consensus estimate on release day is usually close to the print, because the consensus was built from the same ingredients. Surprises are rare, and when the number lands near expectations, the market barely moves. The information was priced in weeks earlier, piece by piece.
The exceptions deserve respect. A large, unexpected inventory swing or a trade figure that diverges sharply from the monthly data can still jolt a session, because those are the components with the weakest advance coverage. When GDP does move markets, it is almost always one of these two blocks doing the damage.
There is also a second channel: revisions to past quarters. A benchmark rewrite that changes the recent growth path can shift the whole narrative about where the economy sits in the cycle, and that can matter more than the fresh quarter itself.
One Quarter, Two Readings
Everything below is hypothetical, with round numbers, to show how the same headline can carry opposite meanings.
Scenario one: the quarter prints 3 percent annualized against a 2.4 percent expectation. Headlines celebrate. But inside the report, consumption grew at a 4 percent pace and did nearly all the work, while inventories subtracted half a point. A trader reading the mix calls this a genuinely strong print dressed as a merely good one, because the engine, household demand, is running hard and the drag is temporary. Some desks would call the strong print understated, and expect the next quarter to hold up.
Scenario two: the same 3 percent print, same 2.4 percent expectation. This time consumption is flat, investment is flat, and a surprise inventory surge contributes the entire beat. The trader reads the same headline and calls it weak. The growth is a warehouse filling up, not an economy accelerating, and the arithmetic says next quarter pays for it. Same number, opposite conclusion. The mix is the message.
| Component | What It Includes | What Moves It |
|---|---|---|
| Consumption | Household spending on goods and services | Jobs, wages, confidence, credit conditions |
| Investment | Business equipment, structures, inventories, housing | Interest rates, profit outlook, capacity use |
| Government spending | Public consumption and investment | Budgets, fiscal policy, election cycles |
| Net exports | Exports minus imports | Exchange rates, foreign demand, domestic demand |
The GDP Report, Answered
Why does GDP get revised three times?
Because the first estimate is built on incomplete source data. The advance reading fills gaps with assumptions; the second and third estimates replace those assumptions with actual survey results as they arrive. Accuracy improves with each pass, at the cost of speed.
What is the difference between nominal and real GDP?
Nominal GDP is measured at current prices, so it rises when prices rise even if output is flat. Real GDP strips out price changes to measure actual volume of production. Headline growth rates are quoted in real terms, because growth that is only inflation is not growth.
Does a strong GDP print always lift stocks?
No. Stocks respond to the gap versus expectation and to what the print implies for interest rates. A strong print can push yields up on tighter policy expectations and pressure equities, especially when growth was already priced in.
How fast is GDP published after the quarter ends?
In the United States, the advance estimate arrives roughly four weeks after the quarter closes. Other major economies publish on similar or slightly slower schedules, with revisions following over the subsequent months.
With GDP in place, the macro dashboard is one corner short of complete. Next comes the most rate-sensitive block of the economy: housing, where a single rate change shows up in permits before it shows up anywhere else.