NFP: The Most Watched Employment Report
The term non-farm payrolls describes a monthly count of how many jobs the United States economy added or lost, with farm workers excluded, and it is the single most watched data release in markets because employment is where growth, wages, and central bank policy all meet at once. Traders call it NFP. Every major desk in the world marks its calendar by this one number.

The reason is positioning. Employment sits at the exact junction of the macro framework you built earlier in this level: jobs drive income, income drives spending, spending drives growth, and all of it feeds the inflation picture that central banks set policy against. A strong labor market pushes one way on rates. A weak one pushes the other. One monthly report touches all of it.
Think of NFP as a monthly headcount at the world's most important workplace; the number is simple, everything underneath it is not.
What NFP Actually Counts
NFP comes from a survey of businesses, not a census. The Bureau of Labor Statistics asks a large sample of employers how many people were on their payrolls during a reference pay period. The headline figure is the net change from the previous month: jobs added minus jobs lost, expressed as a single number like +200,000 or -50,000.
That net figure matters more than most beginners realize. The economy creates and destroys millions of jobs every month. NFP reports the difference, not the gross flows. A headline of +150,000 can hide enormous churn underneath.
The "non-farm" label exists because farm employment is seasonal and volatile, so it is excluded to keep the series cleaner. Also excluded: military personnel, some government intelligence employees, private household workers, and the self-employed without incorporated businesses. The survey covers the great majority of the workforce, but it is a specific definition, and definitions shape numbers.
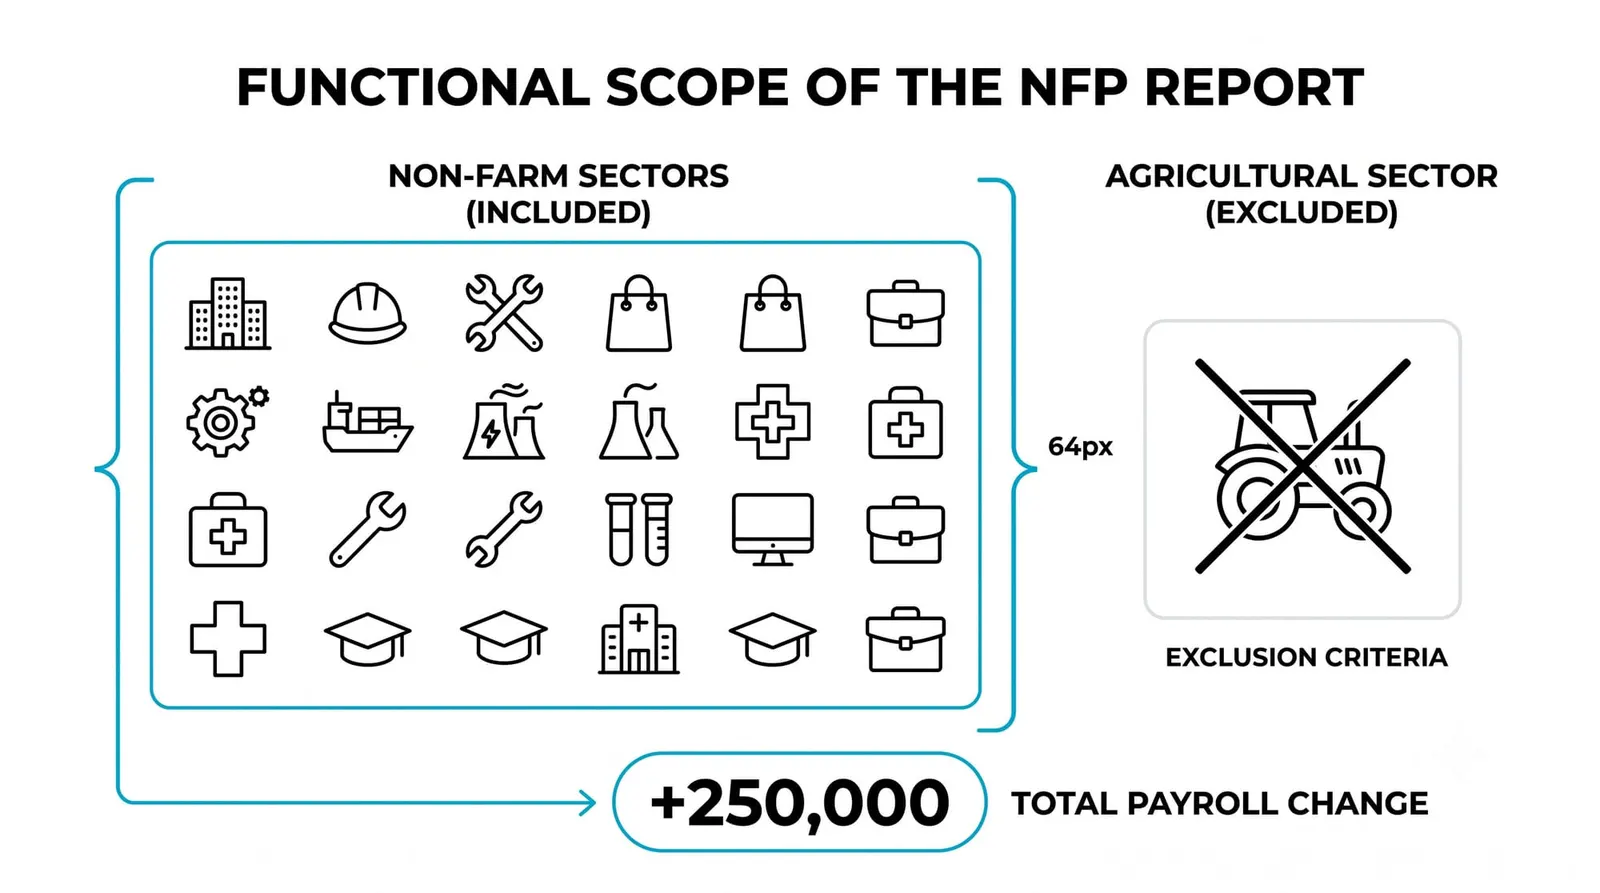
The same release ships with companions, and you must read them together:
- The unemployment rate, drawn from a separate survey of households, not the business survey.
- Average hourly earnings, the wage growth measure, watched as an inflation signal.
- Revisions to the previous two months, which quietly change the story you thought you knew.
- Labor force participation and hours worked, which add context to the headline.
The unemployment rate and weekly jobless claims get their own dedicated lesson later in this level, so for now treat them as companions to NFP rather than the subject.
Why This One Report Moves So Much Money
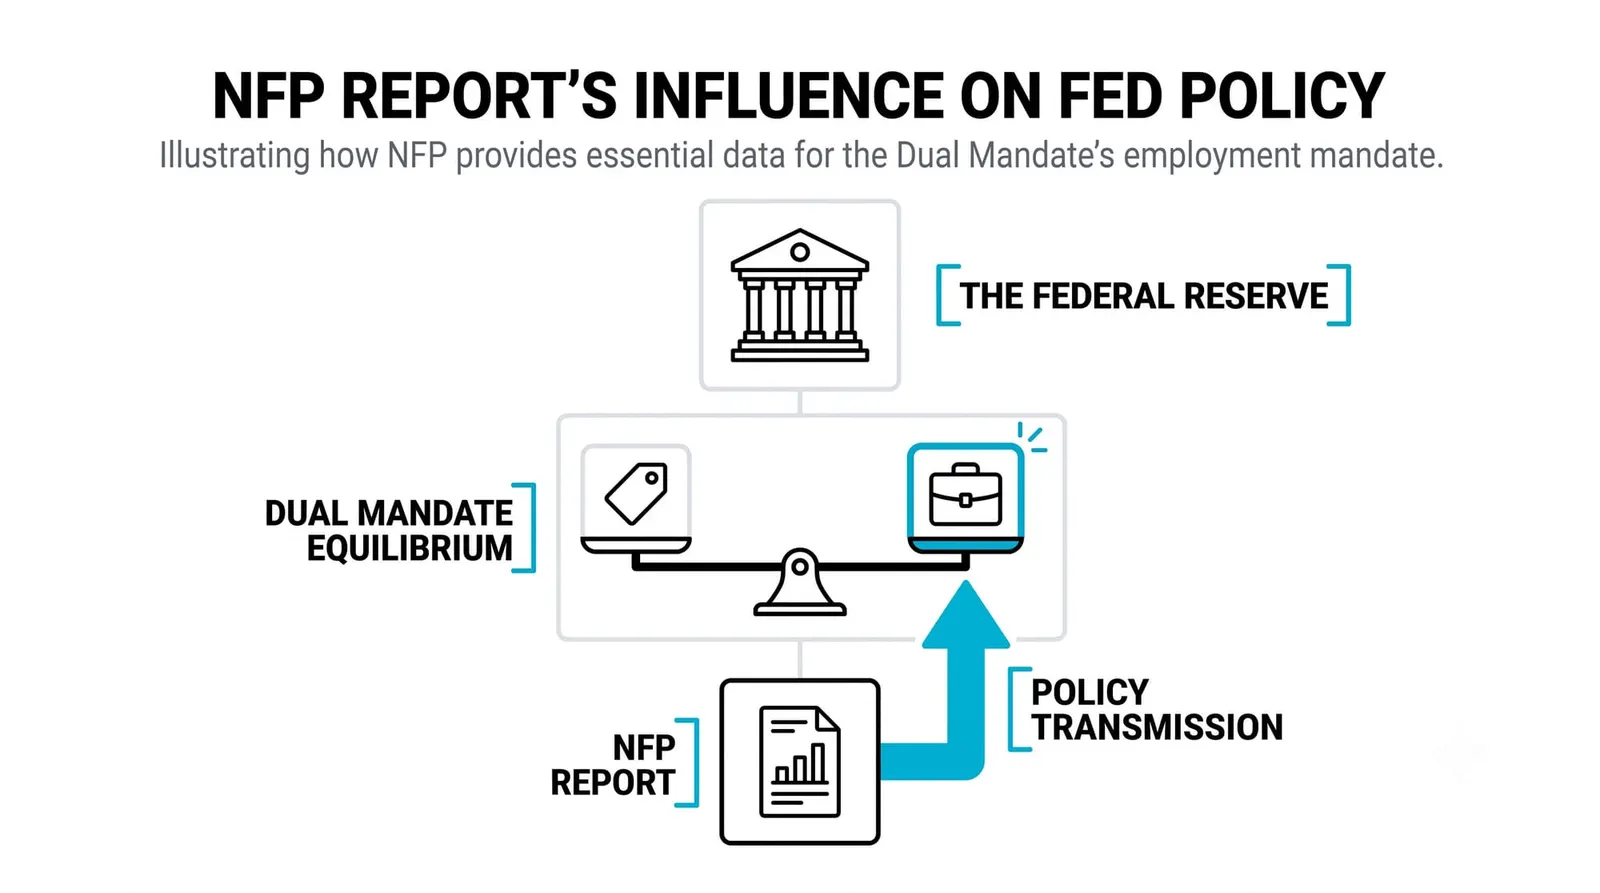
Employment is half of the Federal Reserve's dual mandate: maximum employment and stable prices. You covered central bank mandates and why policymakers watch labor in earlier lessons this level. The short version is that a labor report lands directly on the Fed's job description, so every print is read as a policy signal as much as an economic statistic.
That is why rate expectations can shift within minutes of the release. A hot payroll number pushes expectations toward tighter policy or delayed cuts. A weak one pulls expectations toward easing. Bond yields, the dollar, equity index futures, and gold all reprice off that shift, often before a human has read past the first line.
The schedule amplifies everything. NFP lands on the first Friday of each month, at a fixed time, in front of the largest regular audience in markets. Everyone is watching the same number at the same second. Fixed schedule plus universal attention plus direct policy relevance is the recipe for concentrated volatility.
The mechanics of expectation versus surprise were covered earlier in this level, so the short version here: markets price the consensus forecast in advance, and the move comes from the gap between what was expected and what printed. NFP is the purest recurring example of that principle in the entire calendar.
Reading the Print: Beyond the Headline Number
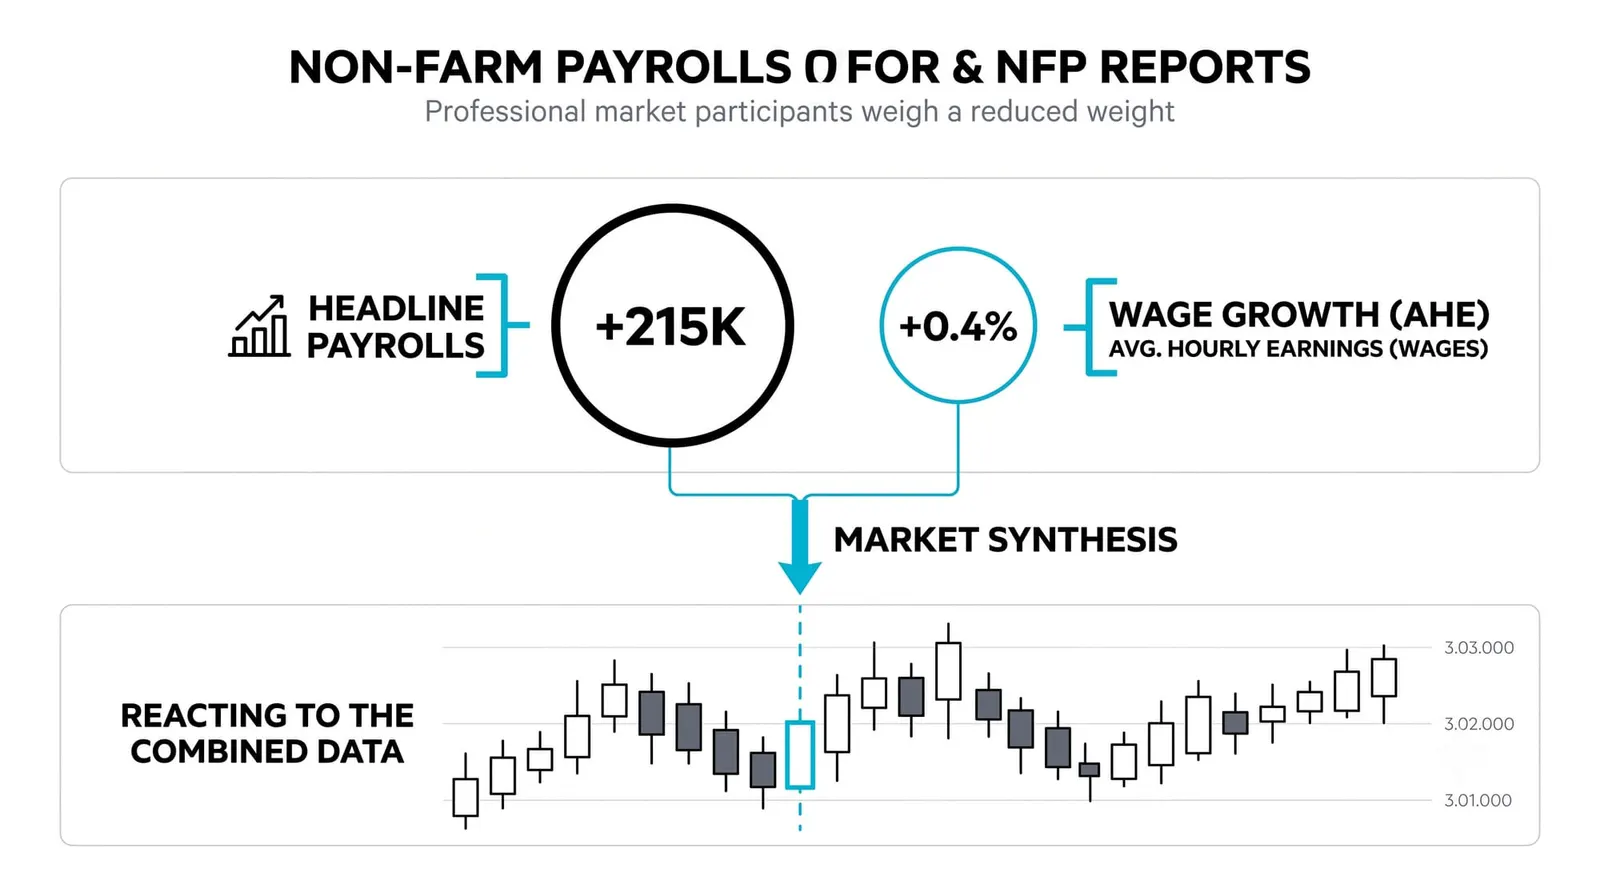
Start with the revisions. Each release restates the previous two months, and those restatements can flip the story. A solid headline paired with large downward revisions to earlier months is weaker than it looks. A soft headline with upward revisions can be a wash. Experienced readers check the revision line before they react to the headline.
Next, look at average hourly earnings. This is the inflation angle. Strong job growth with accelerating wages tells the Fed the labor market is generating price pressure. Strong job growth with flat wages tells a softer story. The same payroll number reads two different ways depending on what earnings did beside it.
Then consider internal contradictions. Because the payroll count and the unemployment rate come from two different surveys, they sometimes disagree in a given month. Payrolls can rise while unemployment rises too, if more people enter the labor force. That is not an error. It is two lenses on the same labor market.
A blunt rule: the headline is the invitation, the details are the report. Traders who read only the first line are trading the least informative part of the release.
The Volatility Playbook: What Happens in the First Minute
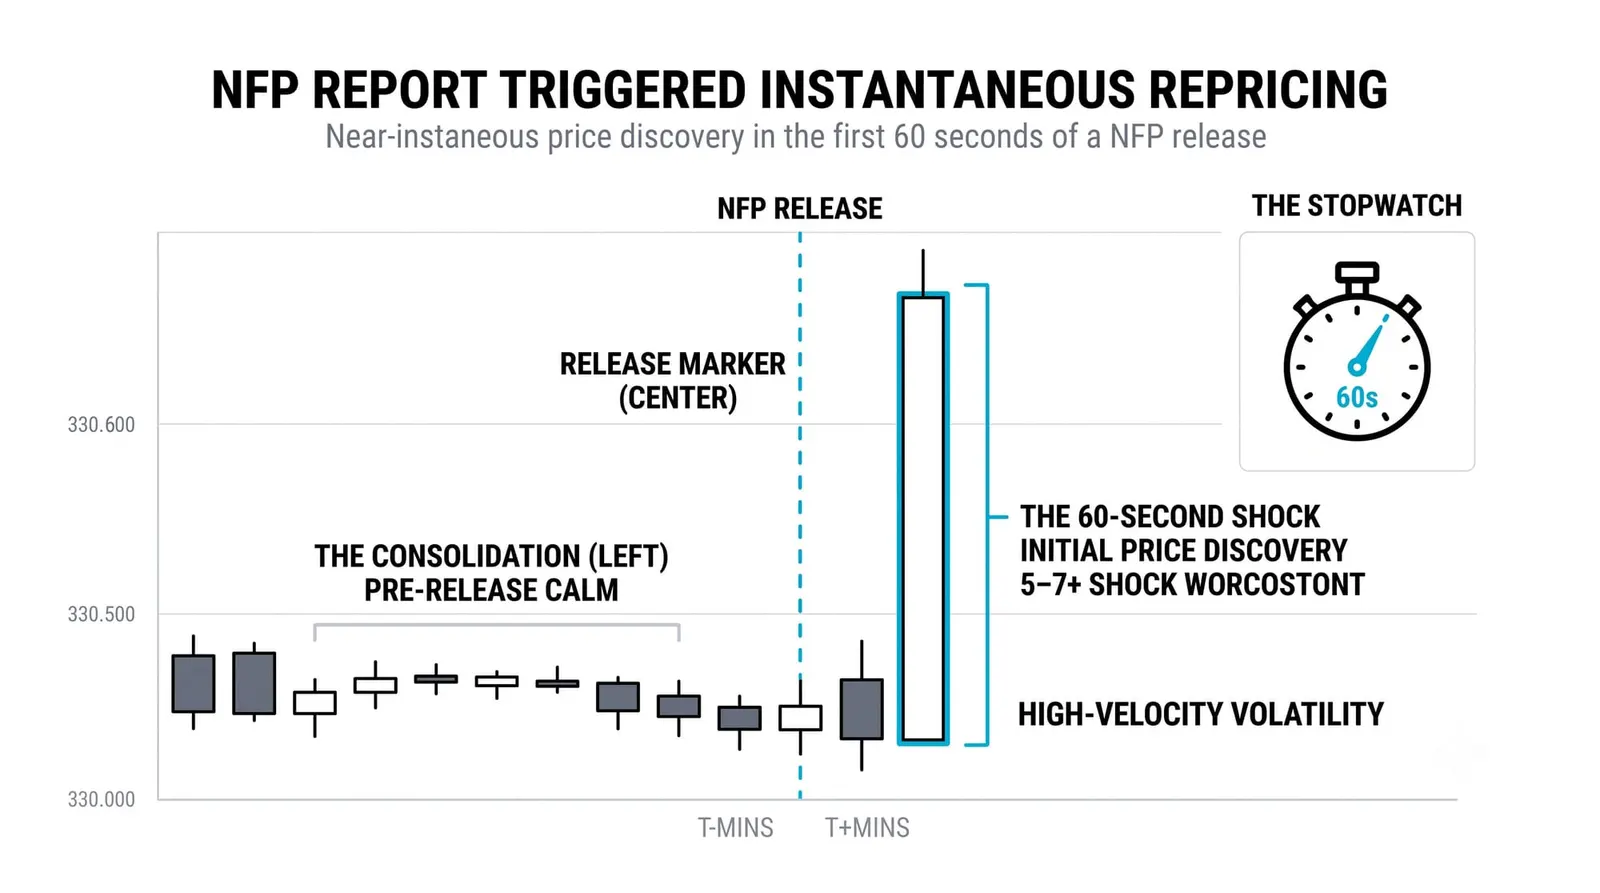
The first seconds belong to machines. Algorithms parse the headline and the key sub-numbers in milliseconds and fire orders before any human finishes reading. Spreads widen sharply around the release as liquidity providers pull quotes to protect themselves. Slippage on market orders can be severe.
The first spike frequently overshoots and reverses. The initial move reflects the raw gap between print and consensus. The second move, minutes later, reflects humans digesting revisions, earnings, and context. Those two moves often point in opposite directions.
The practical structure looks like this:
- T-minus minutes: liquidity thins, spreads begin to widen, positioning is already set.
- Release second: algorithms trade the headline gap, price jumps or drops violently.
- First minutes: the spike often retraces partially as the details get read.
- The following hour: a more durable direction emerges as rate expectations settle.
The honest conclusion for a developing trader is that the first minute is a lottery with worse odds than usual. Waiting for the dust to settle costs you the first move and saves you from the worst fills. Many professionals simply stand aside until spreads normalize.
One Friday Morning
Everything below is hypothetical, with round numbers invented for illustration.
The consensus forecast expects +180,000 jobs. At 8:30 the print lands at +90,000, and the previous month is revised down by 50,000. The headline is a clear miss, half the expected number. The revision makes it worse, because last month's strength was partly an illusion. The effective shortfall against expectations is now roughly 140,000 jobs.
Markets read this as a cooling labor market. Rate expectations shift toward cuts. Yields fall, the dollar weakens, and equity futures whipsaw between "growth scare" and "rate relief" before picking a direction.
Now the contrast. Same headline: +90,000. But this time the prior two months are revised up by a combined 80,000. The read flips. The labor market was stronger than anyone thought last month, and this month's softness may be noise. The dollar might barely fall, or even rise, on the identical headline number.
Same print, opposite story. The headline alone told you almost nothing.
| Component | What It Is | What It Moves |
|---|---|---|
| Headline payrolls | Net jobs added or lost in the month, from the business survey | Rate expectations, dollar, index futures, yields |
| Revisions | Restatements of the prior two months | Confirm or reverse the headline's message |
| Average hourly earnings | Wage growth, the inflation angle of the report | Inflation expectations, bond yields, Fed pricing |
| Unemployment rate | Share of the labor force without work, from the household survey | Context for the headline, occasionally a contradiction |
The NFP Report, Answered
Why does it always land on the first Friday?
The Bureau of Labor Statistics follows a fixed publication schedule, and the employment situation report is released on the first Friday of each month, covering the prior month's data. The fixed calendar is part of why the event concentrates so much attention: everyone knows exactly when to be watching.
Can an NFP print be revised away?
Yes. The two monthly revisions that follow each print can materially change it, and annual benchmark revisions can reshape whole stretches of history. Treat any single print as a first estimate, not a final fact.
Does NFP matter for markets outside the US?
Yes. US rate expectations move global capital flows, so a big NFP surprise reprices currencies, bonds, and equities worldwide. A trader in any market feels the ripple, because the dollar and US yields sit at the center of global pricing.
Should I hold a position through the release?
That depends on your timeframe, but understand the trade you are making: you are accepting gap risk through a moment of thin liquidity and machine-driven spikes. Many traders reduce size or step aside before the print and re-enter after spreads normalize. There is no prize for being in the market during the most chaotic minute of the month.
Next in this level, back to inflation: PCE, the gauge the Fed itself targets, and why it can tell a different story than CPI in the same month.