Sideways Markets and Consolidation
A sideways market is price oscillating between a defined floor and a defined ceiling with no net direction, a standoff traders call consolidation, and it ends when one side finally wins and price breaks out. You will spend a large share of your chart time inside these structures, because markets trend far less often than beginners assume. Learning to read them well is not optional.

Think of it as a tug-of-war in which neither side gains ground, and the rope only matters when someone lets go or wins. The rope is boring to watch. The moment it moves is everything.
What a Range Actually Is
A range is not any stretch of flat-looking price. It has requirements, and you should hold the label to them.
First, you need at least two touches of the floor and two touches of the ceiling. One bounce off a level proves nothing. Two bounces at roughly the same price, on both sides, tells you buyers and sellers have each drawn a line and defended it.
Second, the range needs a measurable width. The distance from floor to ceiling defines your potential reward on any trade inside it, and later it defines the measured target after a breakout. If you cannot measure it, you cannot trade it.
Third, it needs time. A range earns respect when both sides have had repeated chances to break it and failed. A few hours of flat price after a sharp move is not a range. It is noise between swings, and treating it as structure will get you chopped up.
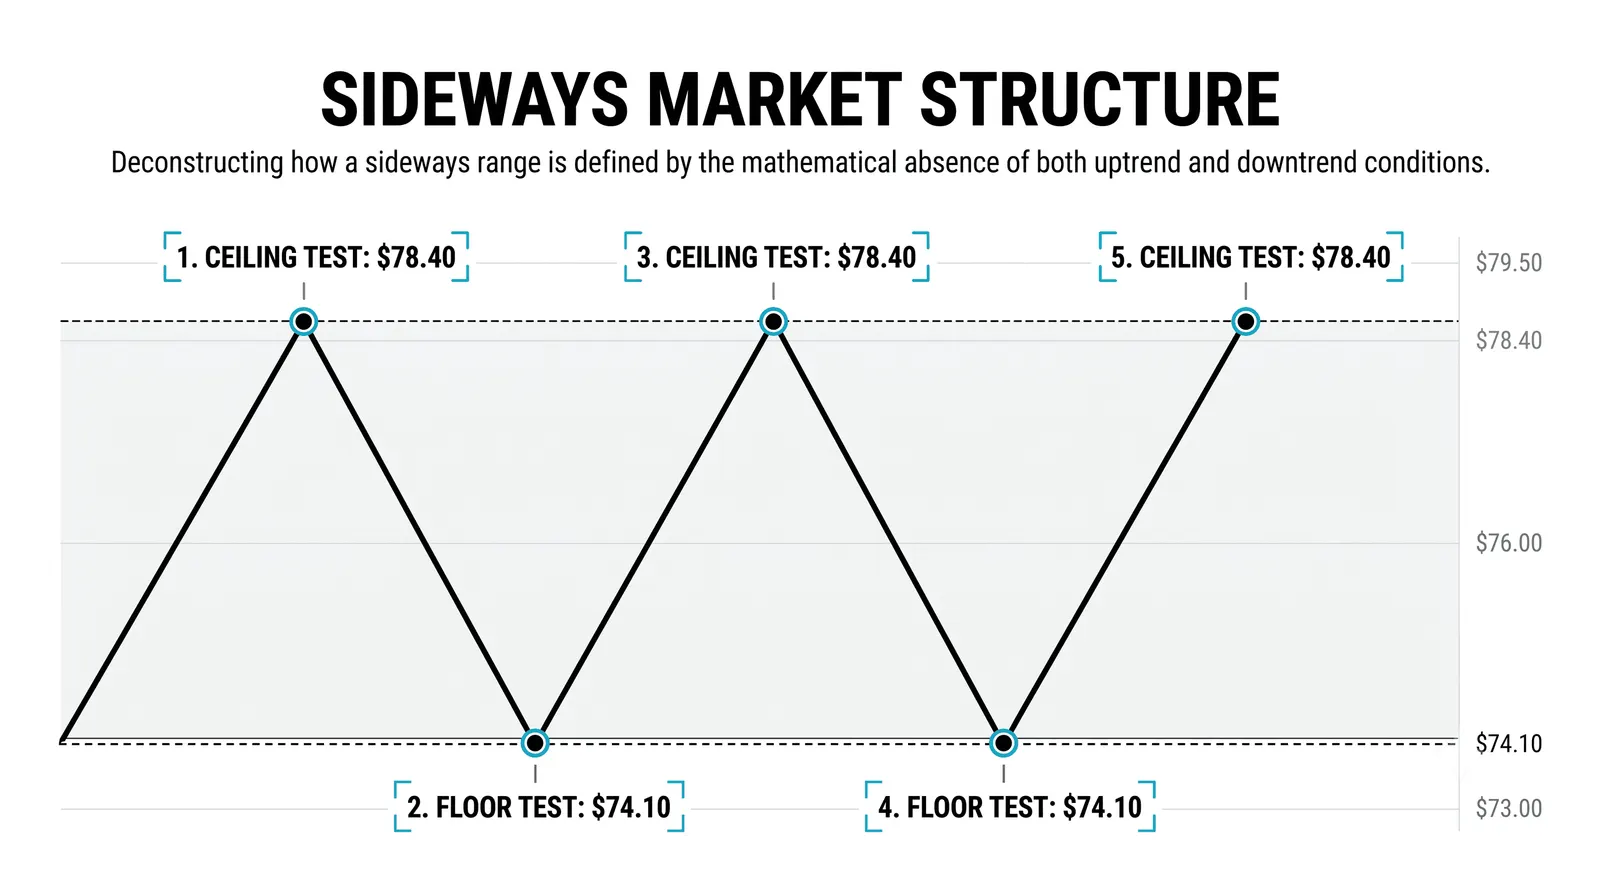
Be strict here. Most of what looks like a range on a lower timeframe dissolves into trend noise when you zoom out.
Why Ranges Form
Ranges form because the market reaches balance. Price sits where buyers and sellers agree, and nobody has a strong reason to pay more or accept less.
Sometimes the balance is deliberate. After a long decline, a large participant may be quietly absorbing supply, buying everything offered at the floor without pushing price up. After a long advance, the opposite happens: someone big is unloading into strength, selling every rally at the ceiling without knocking price down.
Sometimes there is no hidden hand at all. The market simply has no new information, no catalyst, and no conviction. Volume thins, volatility shrinks, and price drifts.
The same shape carries different meanings depending on what came before. A tight range after a steep fall is a different animal from the same range after a steep rise. Context is not decoration. It is the analysis.
Range Behavior Is the Opposite of Trend Behavior
This is the section that saves or costs you real money. Mean-reversion works in ranges and fails in trends, and the two rulebooks cannot be swapped.
Inside a range, buying the floor and selling the ceiling is a legitimate strategy. Price has shown you where it gets cheap and where it gets expensive, and fading the edges is trading with the structure. The same behavior in a trend is an account-killer, because the "ceiling" in an uptrend keeps getting broken and every short against it is a donation.
The deadliest mistake in trading is running range rules in a trend or trend rules in a range. The trader who buys every dip in a downtrend is applying range logic to a trend. The trader who waits for a breakout that never comes inside a quiet range is applying trend logic to a range. Both lose steadily, and both often feel smart while doing it.
So the first question on any chart is not "where do I enter." It is "which regime am I in." Everything else follows from that answer.
Consolidation Versus Reversal Range
Not every range means the same thing about what comes next. The most common case is continuation: a pause after a trend usually resolves in the direction of that trend. This is exactly why rectangles and flags are classified as continuation patterns. The trend rests, weak hands exit, and the original move resumes.
But the same shape after a long advance can be quiet distribution. Price holds the floor not because buyers are strong, but because a large seller is feeding supply into every rally and supporting price just enough to keep unloading. When the selling finishes, the floor gives way and the range resolves down, against the prior trend.
You cannot always know which one you are in while it forms. What you can do is watch the clues: whether volume expands on rallies or on declines, whether the floor tests come on increasing or decreasing pressure, and whether the breakout attempt has conviction behind it. The range itself is neutral. The behavior inside it is the tell.
Three Months Going Nowhere
Here is a hypothetical example with round numbers to make the mechanics concrete. Imagine a stock that spends three months chopping between a floor at 30 and a ceiling at 34. Price tags 30 twice and holds, tags 34 twice and rejects. The width is 4 points, and three months is long enough for both sides to commit real money to their lines.
During those three months, two kinds of trades were available. The edge fades paid: buying near 30 with a stop just below, and selling or shorting near 34 with a stop just above. Each swing offered roughly 4 points of potential against a fraction of that in risk. The mid-range trades punished. Anyone buying at 32 or 33 had no edge, poor reward relative to risk, and got chopped by random noise in both directions. The middle of a range is where accounts bleed slowly.
Then the range ends. Price closes above 34 on strong volume. That breakout close is the signal that buyers finally won the standoff. The disciplined trend entry waits for the retest: price pulls back to 34, the old ceiling, and holds it as new support. That hold confirms the role reversal, resistance becoming support, and offers an entry with a tight, logical stop just below 34.
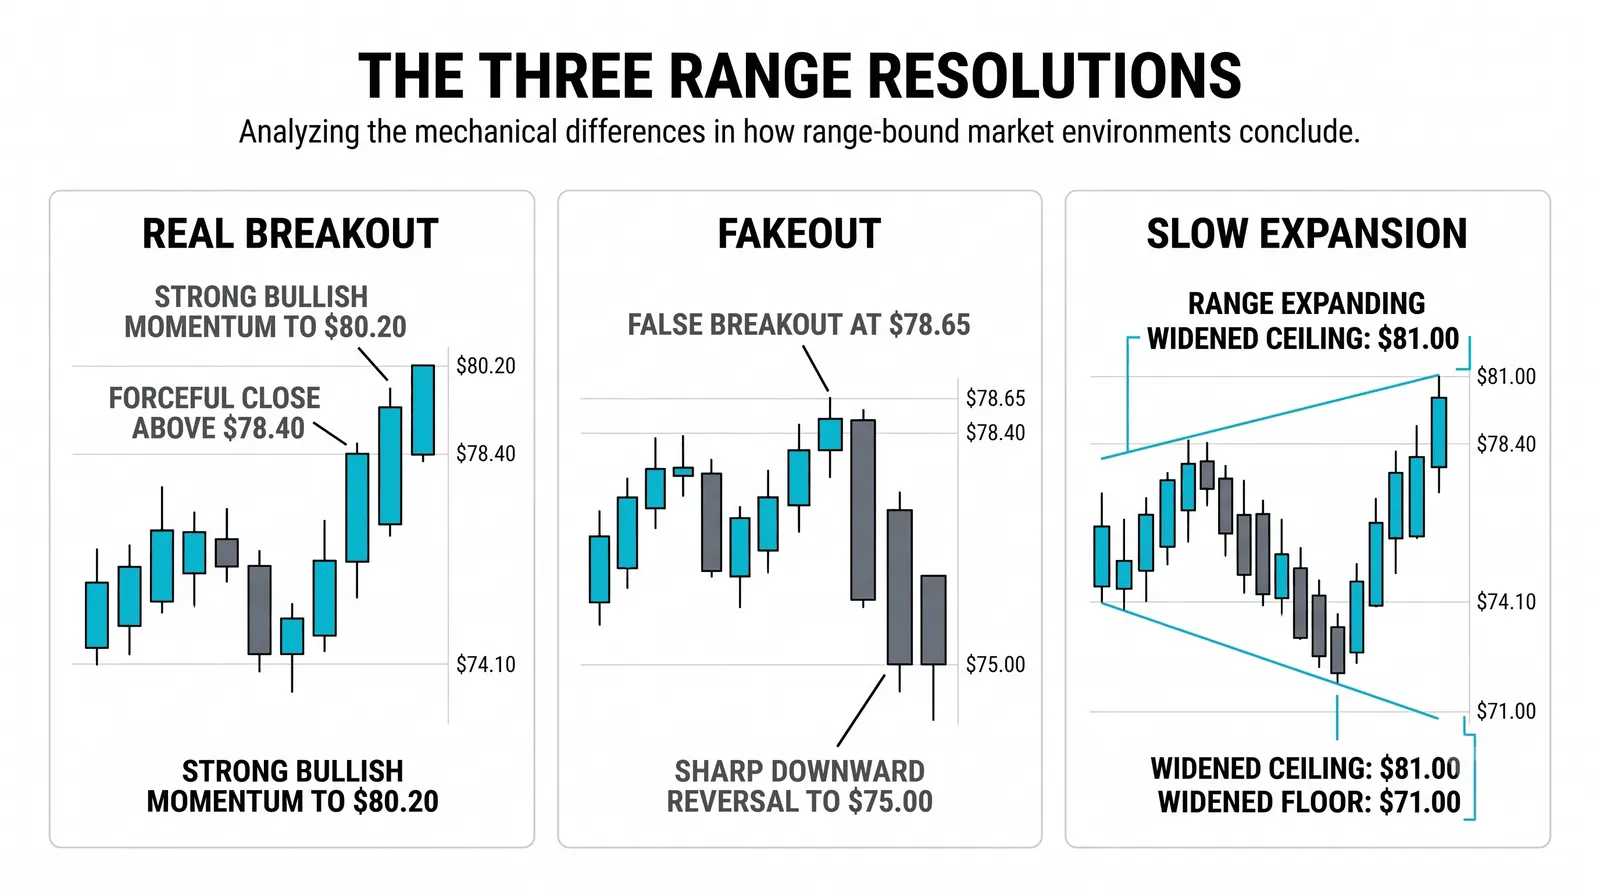
The measured target comes from the width. A 4-point range projected upward from the 34 breakout gives a target near 38. It is an estimate, not a promise, and plenty of breakouts fall short or overshoot. But it gives you a rational frame for reward before you risk a dollar.
Note what the example teaches. The trades that paid were the edge fades and the confirmed break. The trades that punished were the impatient mid-range entries. The range itself was not the enemy. Trading it without a plan was.
Trending Market Versus Ranging Market
| Trending Market | Ranging Market | |
|---|---|---|
| What works | Buying pullbacks in the trend direction, breakout continuation entries | Fading the edges: buying the floor, selling the ceiling |
| What fails | Fading highs and lows against the move | Chasing breakouts that never follow through, mid-range entries |
| Where entries come from | Prior resistance turned support, moving average zones, flag and pullback structures | Tested floor and ceiling levels with stops just beyond them |
| The key risk | Entering late, right before the trend exhausts into a range | Holding a fade when the range breaks and becomes a trend |
Keep this table in mind as a diagnostic, not a script. Markets shift regimes without announcing it, and your job is to notice the shift before your P&L does.
Sideways Markets: Your Questions, Answered
How long do ranges usually last?
There is no fixed clock. Ranges last as long as the balance that created them, from a few sessions on an intraday chart to many months on a daily. Generally, the longer the range and the more touches on each edge, the more significant the eventual breakout, because more positions are trapped on the losing side.
Should I trade inside the range?
You can, but only at the edges with defined risk, and only if the width gives you enough reward to justify it. A range 2% wide on a daily chart rarely pays for the stress. A range 15% wide with clean, tested edges can be traded on both sides. If you are newer, standing aside and waiting for the breakout is a perfectly good position.
What is a false breakout?
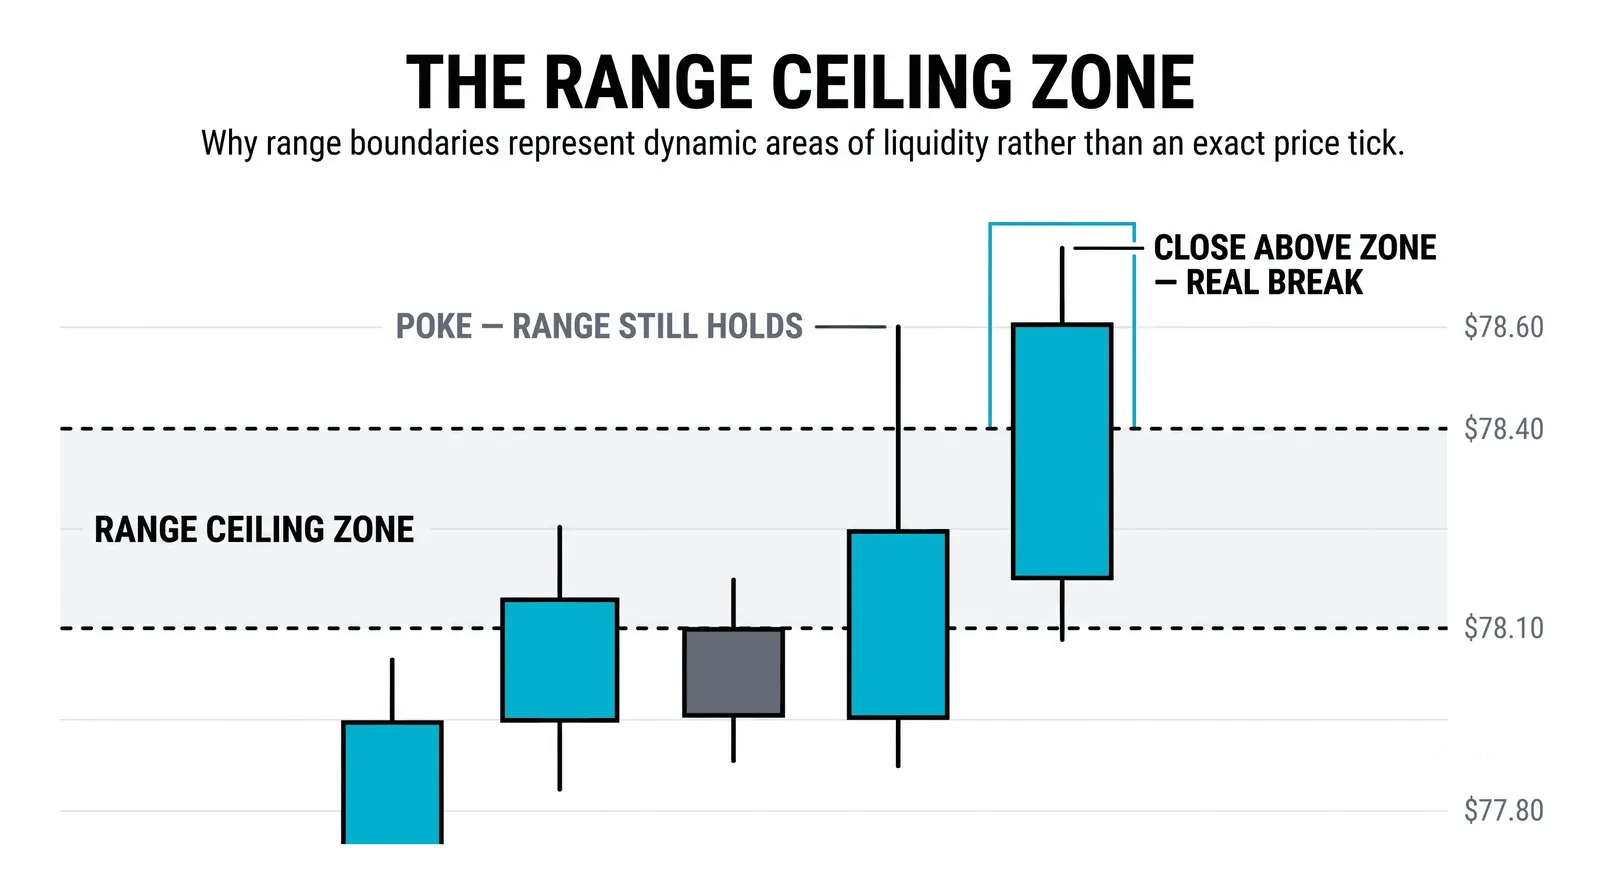
A false breakout is a move beyond the floor or ceiling that fails to hold and snaps back inside the range. It happens when the push has no real commitment behind it, often just stop orders being triggered at obvious levels. This is why many traders wait for a close beyond the level, or for a retest that holds, before treating a breakout as real.
How do I know the range has ended?
The cleanest evidence is a decisive close beyond an edge, ideally on expanded volume, followed by a retest where the old boundary flips roles. One poke through the ceiling proves nothing. A close above it, a pullback that respects it, and a resumption in the breakout direction is the market showing its hand.
Ranges are where the next trend is built. In the next lesson, we take the breakout apart piece by piece: volume signatures, retest behavior, and how to size a position when the standoff finally resolves.