How Trends Begin and End
Understanding how trends begin and end comes down to one idea: a trend starts when the market's balance breaks and one side takes control, printing a first sequence of higher highs and higher lows (or the reverse), and it ends the same way backward. The sequence fails, the crowd that built it exits, and a new balance forms. Everything else is detail.

A trend behaves like a rumor: it starts among a few, spreads as it proves itself, peaks when everyone already knows, and dies of exhaustion. Keep that shape in mind as we walk through each stage.
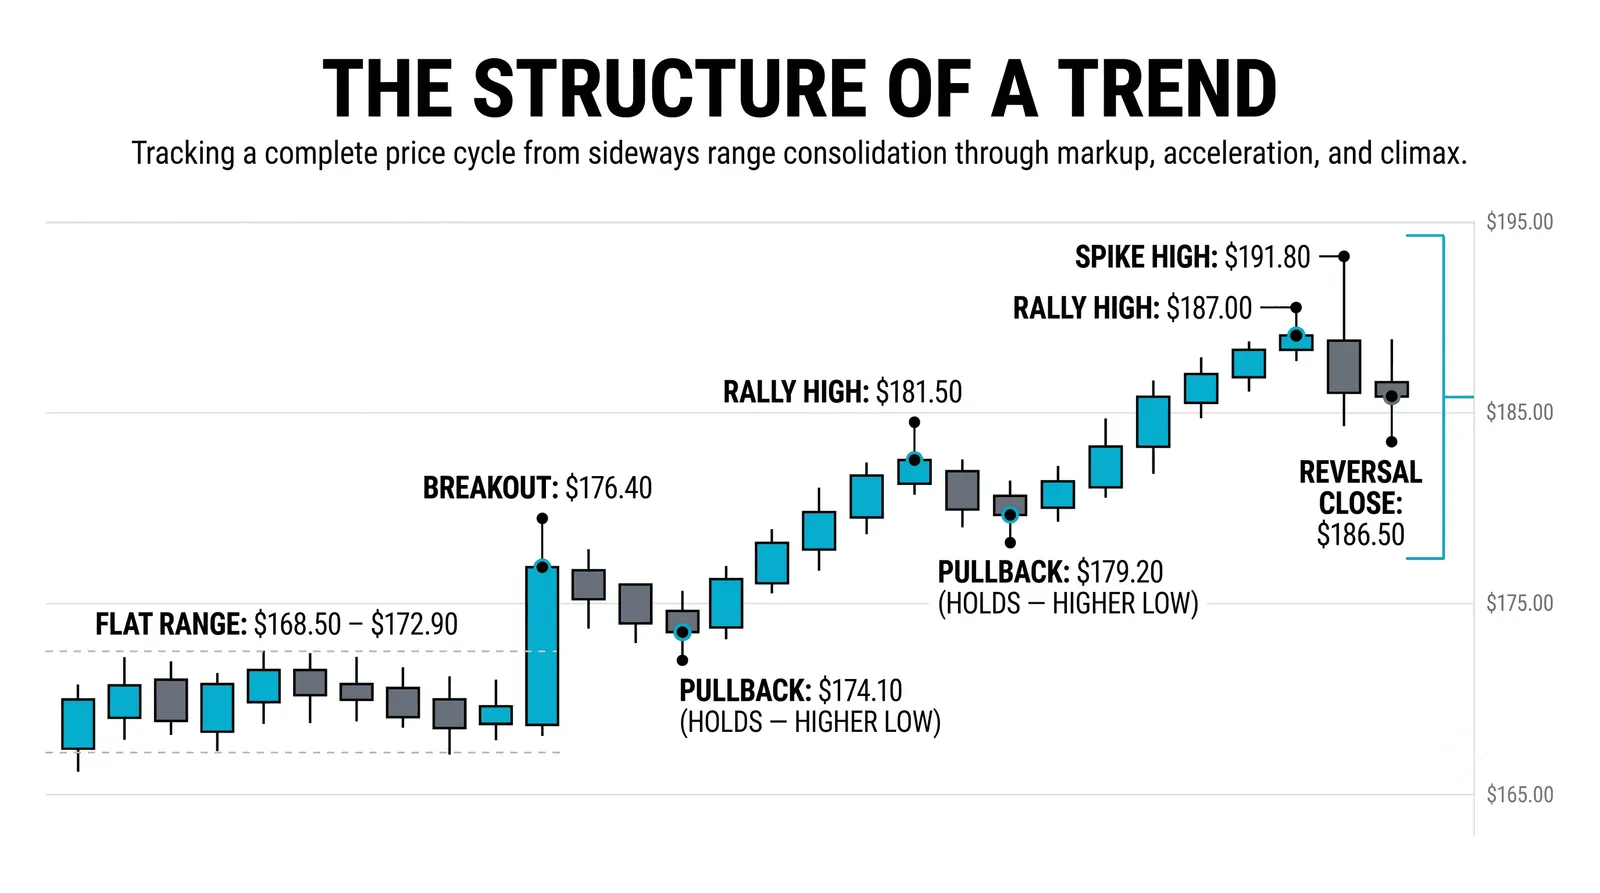
The Birth: A Failing Balance
Before any uptrend exists, there is a market going nowhere or going down. The old move runs out of orders. Sellers who wanted to sell have sold. Price stops making lower lows, not because buyers are strong yet, but because supply is drying up.
This is the base. Price chops sideways in a range. It looks dead. The news is usually still bad, because headlines lag price by design.
Then the first higher low prints. Price dips, and buyers step in earlier than they did last time. Almost nobody calls this a trend. The chart still looks like a mess, and the story around the asset is still negative.
That is normal. Births are quiet. If you wait for the environment to feel bullish, you are waiting for the middle of the move.
Ignition: The First Sequence
The first objective evidence of a trend is a completed sequence: a higher high followed by a higher low. One swing up, one pullback that holds above the prior low, and the market has told you something it could not take back.
This is the cheapest place to be wrong. Your invalidation is clear: if price breaks back below that higher low, the sequence failed and your idea is dead. Small risk, defined level, real information.
Compare that to buying inside the base, where you are guessing, or buying after five higher highs, where you are chasing. The first sequence is where evidence and price are both still reasonable.
Most new traders skip this stage. They want certainty. But the first sequence is the most certainty the market ever offers at a low price.
The Middle: Trend as Habit
Once the sequence repeats a few times, the trend becomes a habit. Pullbacks get bought. Continuation patterns, flags and ranges and tight consolidations, resolve in the direction of the move. The market trains its participants.
The crowd arrives in stages. First the early structure readers. Then the breakout traders. Then the slower money, funds and retail, once the trend is obvious on every timeframe. Each wave of buyers adds fuel, and each successful pullback convinces more people that buying dips works.
The trend survives on repetition. Every higher low that holds reinforces the behavior that created it.
This is where the money is made, and it is the least exciting part. You are not predicting anything. You are buying pullbacks in a proven sequence and getting out when the sequence breaks. Boring is the job description.
The Top: The Habit Breaks
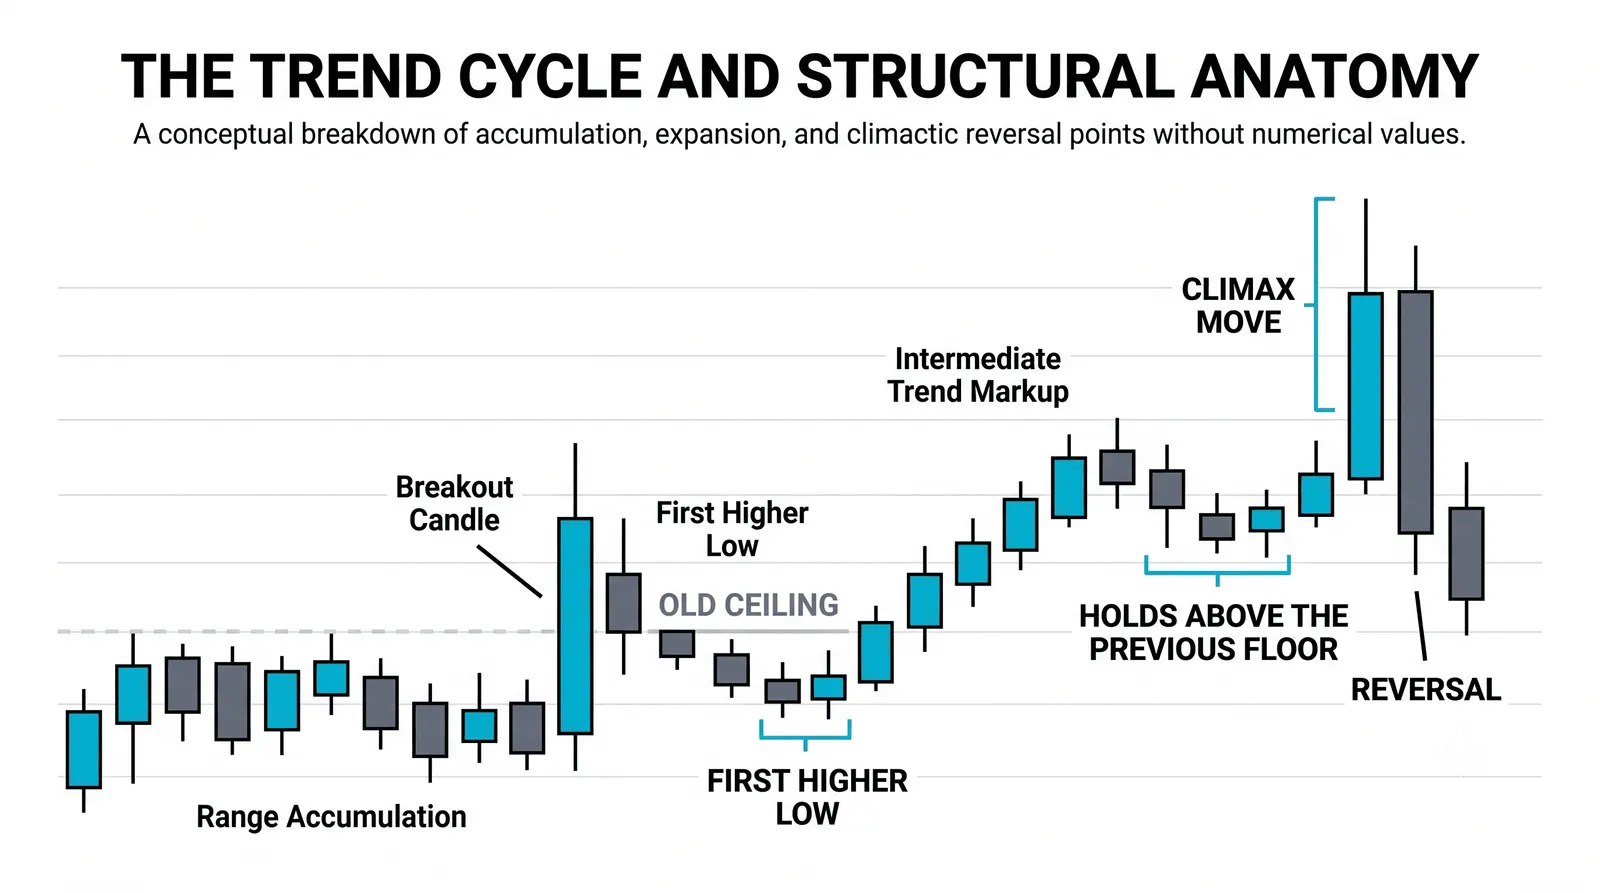
Tops announce themselves in two ways, and you want to see both.
First, momentum thins. Price still pushes to new highs, but each push is smaller, slower, or more labored than the last. The rallies cover less ground. The pullbacks get deeper. The engine is still running, but it is straining.
Second, the sequence fails. A pullback breaks below the prior higher low. The habit that held for weeks or months just broke. That is your objective signal, the same kind of signal that told you the trend started.
Then come the exits. The late buyers are underwater and sell into bounces. The early buyers take profits. Every rally attempt meets supply from people trying to get out near breakeven.
A top is a process of distribution, rarely a single candle. The dramatic reversal bar you see in hindsight was usually the last act of a play that had been running for weeks.
Endings Are Processes, Not Events
Most trends do not die in a day. They die through structures: double tops, head and shoulders patterns, distribution ranges, slow rollovers where each rally is weaker than the last.
These structures take time because the crowd exits in stages, the same way it entered. Some holders sell on the first failure. Some wait for a bounce. Some refuse to sell until the pain forces them out. All of that selling has to be absorbed before a new downtrend can run.
V-reversals, where price spikes and collapses with no warning, are the exception. They happen, usually on news or after parabolic moves, but building your plan around them means ignoring the far more common case.
The opposite sequence needs time to build, just like the original one did. A downtrend is born the same way an uptrend was: a base of lower highs, then a first lower low and lower high. Respect the symmetry. It keeps you patient at tops and bottoms alike.
The Life of a Trend in Five Prints
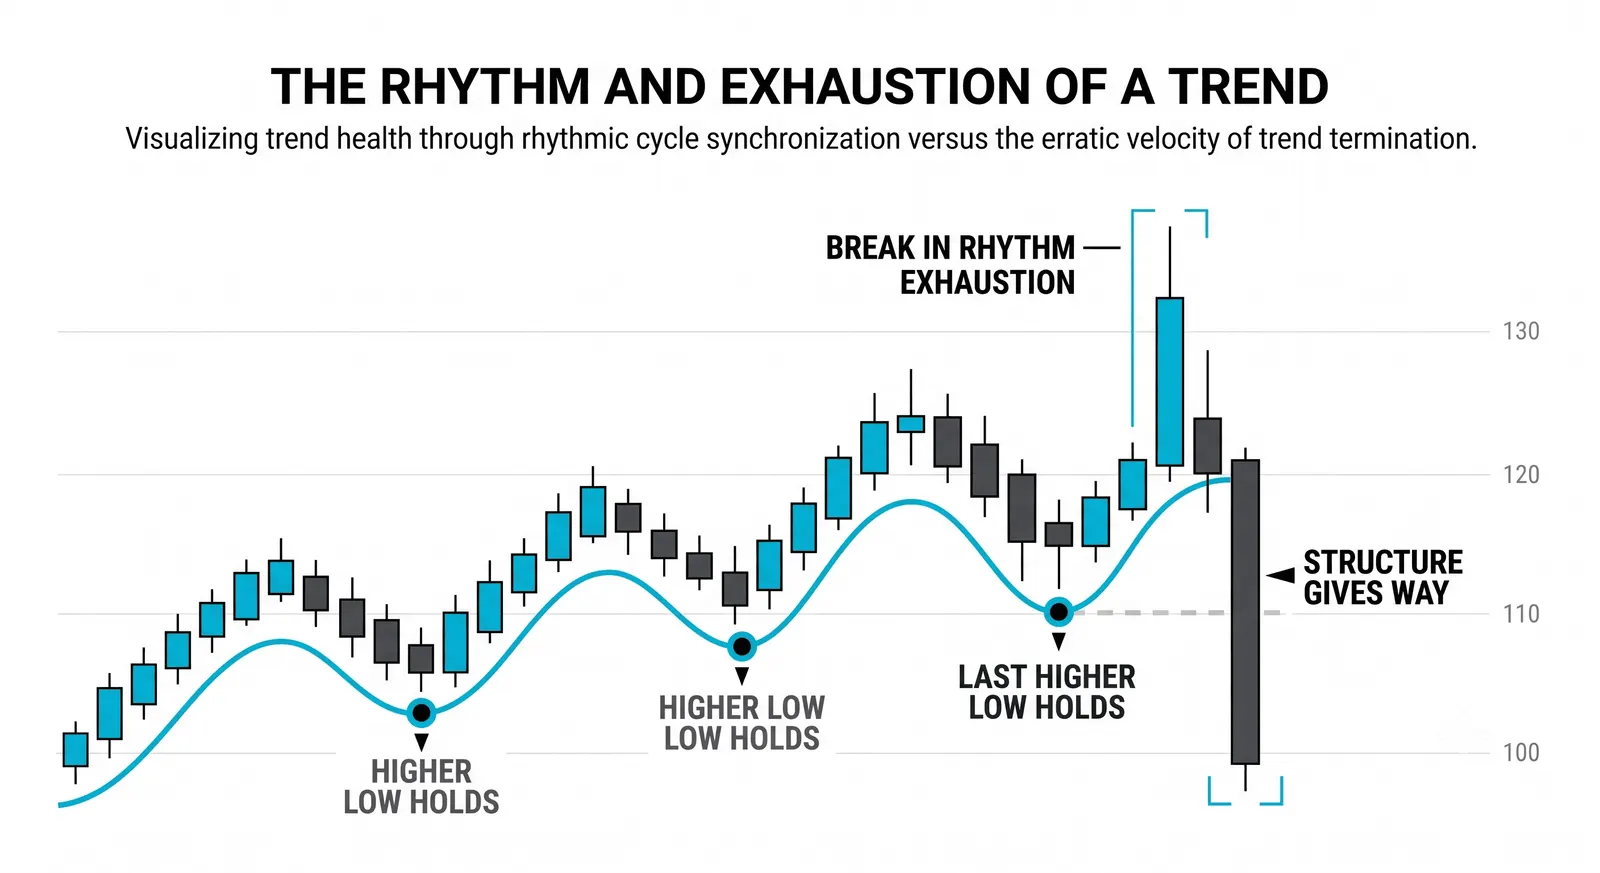
Here is a hypothetical example with round numbers, so you can see the whole lifecycle on one page.
- Print one, birth: After a long decline, price bases at 90. It dips to 89, then 90.5, then holds 91 on the next dip. Selling is exhausted. Nobody is excited.
- Print two, confirmation: Price breaks out of the base and runs to 96, then pulls back and holds at 93. First higher high, first higher low. The sequence exists. This is the cheapest defined-risk entry of the entire move.
- Print three, maturation: Price rallies to 99, pulls back to 95, pushes again. Pullbacks get bought on schedule. The crowd is arriving. The trend is now obvious, and obvious is fine, because the sequence is intact.
- Print four, warning: Price stalls at 100. It pokes to 100.5, then 100.2, each push weaker. A pullback slices below the prior low at 95. The habit just broke. Momentum thinned first, then the sequence failed. Both warnings fired.
- Print five, end: Weeks later, after a distribution range between 94 and 100, price breaks below 93. The exits are done, the balance has flipped, and a new downtrend is printing its own first sequence in the opposite direction.
Five prints. Birth, confirmation, maturation, warning, end. Every real trend is messier than this, but the skeleton is the same.
What This Means for You
You will never catch the exact birth or the exact death. Accept that now and you save yourself years of frustration.
Trade the middle. Wait for the first sequence, enter on pullbacks while it holds, and exit when it breaks. You give up the first ten percent and the last ten percent of every move, and in exchange you get the part with the best odds.
Let the prints decide. Not the news, not your opinion, not how the trade feels. The sequence is either intact or it is not.
Your next step is simple: open a chart of any market, find a finished trend, and label its five prints. Do that twenty times and you will start seeing births and deaths before they finish forming.
Questions About How Trends Begin and End
Do trends always end gradually?
No, but gradual endings are the norm. Most trends die through distribution structures that take weeks or months. Fast collapses happen, usually after parabolic moves or on sudden news, but planning for the common case beats planning for the dramatic one.
What is a V-reversal?
A V-reversal is a sharp reversal where price spikes to a high and collapses almost immediately, with no distribution period. The chart looks like the letter V, inverted at tops. They are real but rare, and they are nearly impossible to trade from the top tick, so treat them as exceptions rather than a strategy.
Can a trend resume after it ends?
Yes, and this trips up many traders. A sequence can fail, price can base again, and a new sequence can print in the original direction. Treat it as a new trend with a new first sequence, not a continuation you are owed. Your old bias has no vote.
How do I know a base is forming?
You know a base is forming when price stops making lower lows and starts holding higher lows within a sideways range. Volume often dries up, and the news stays negative. You cannot confirm it until the breakout prints the first higher high, so the base itself is a watch zone, not an entry.