Flags, Pennants and Wedges
Pennants, flags, and wedges all belong to the same family: pauses inside a trend. The direct answer is simple. These shapes read as continuation patterns because the trend that produced them usually resumes, and the shape of the pause tells you how confident that trend still is. A shallow, orderly pause says holders are calm. A deep, messy one says conviction is fading.

Think of it like a phone call on hold: the conversation is not over, it resumes where it left off.
One caution before the details. These patterns fail often enough that you should treat them as context, not signals. The pattern is the pause. The trend is the trade.
The Flag: A Pole and a Polite Pullback
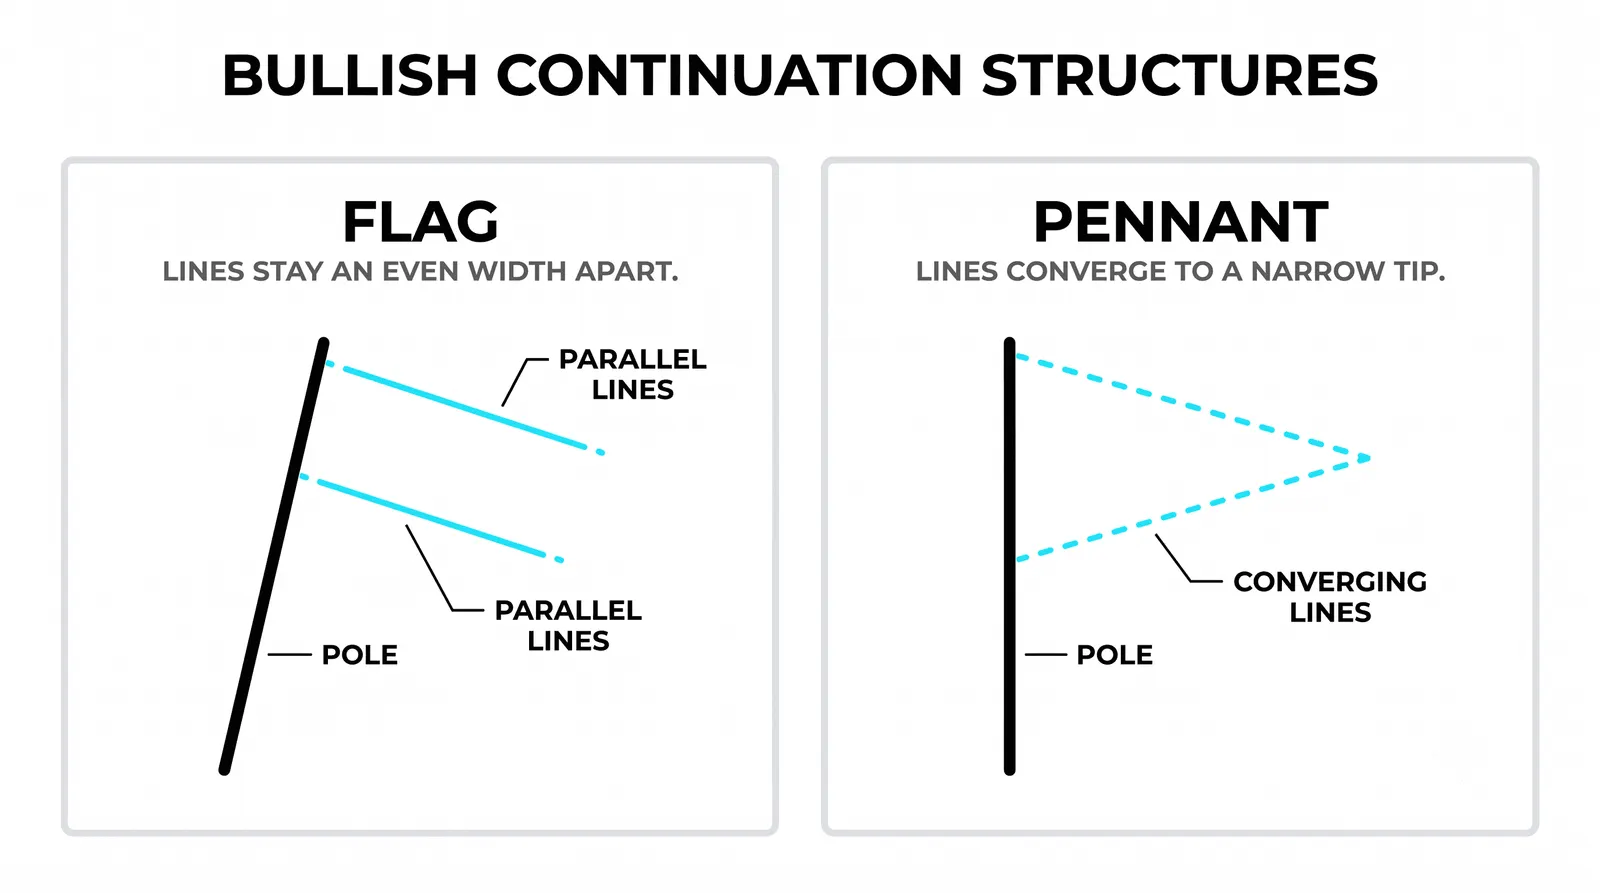
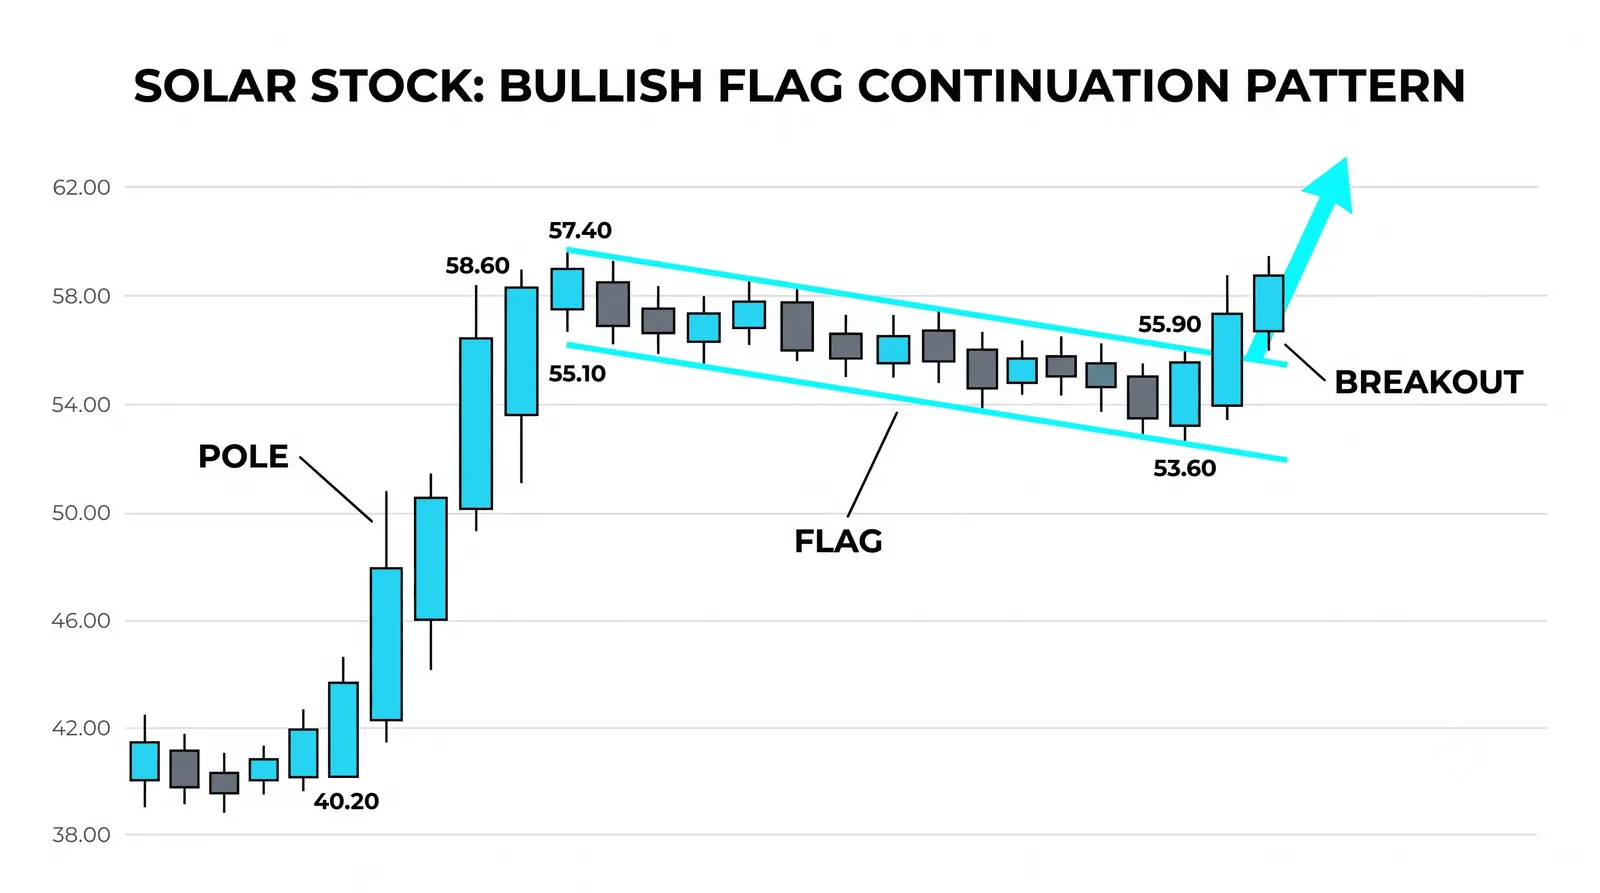
A flag has two parts. First comes the pole: a steep, fast move, usually on expanding volume. Then comes the flag itself, a small channel that drifts against the trend. After a rally, the flag slopes gently downward. After a drop, it slopes gently upward.
The drift is the information. It should be shallow and orderly, with small candles and no urgency. That is profit-taking without panic. Early buyers are cashing out, but nobody is running for the exit, and no aggressive sellers are stepping in to reverse the move.
Compare that with a sharp, deep retracement on heavy volume. That is not a flag. That is a fight. The whole value of the flag shape is that it shows the counter-move is weak.
Volume helps confirm the read. Ideally it contracts during the drift and expands again on the break out of the flag. You will not always get that textbook sequence, but when you do, the pattern carries more weight.
The Pennant: Same Pause, Tighter Shape
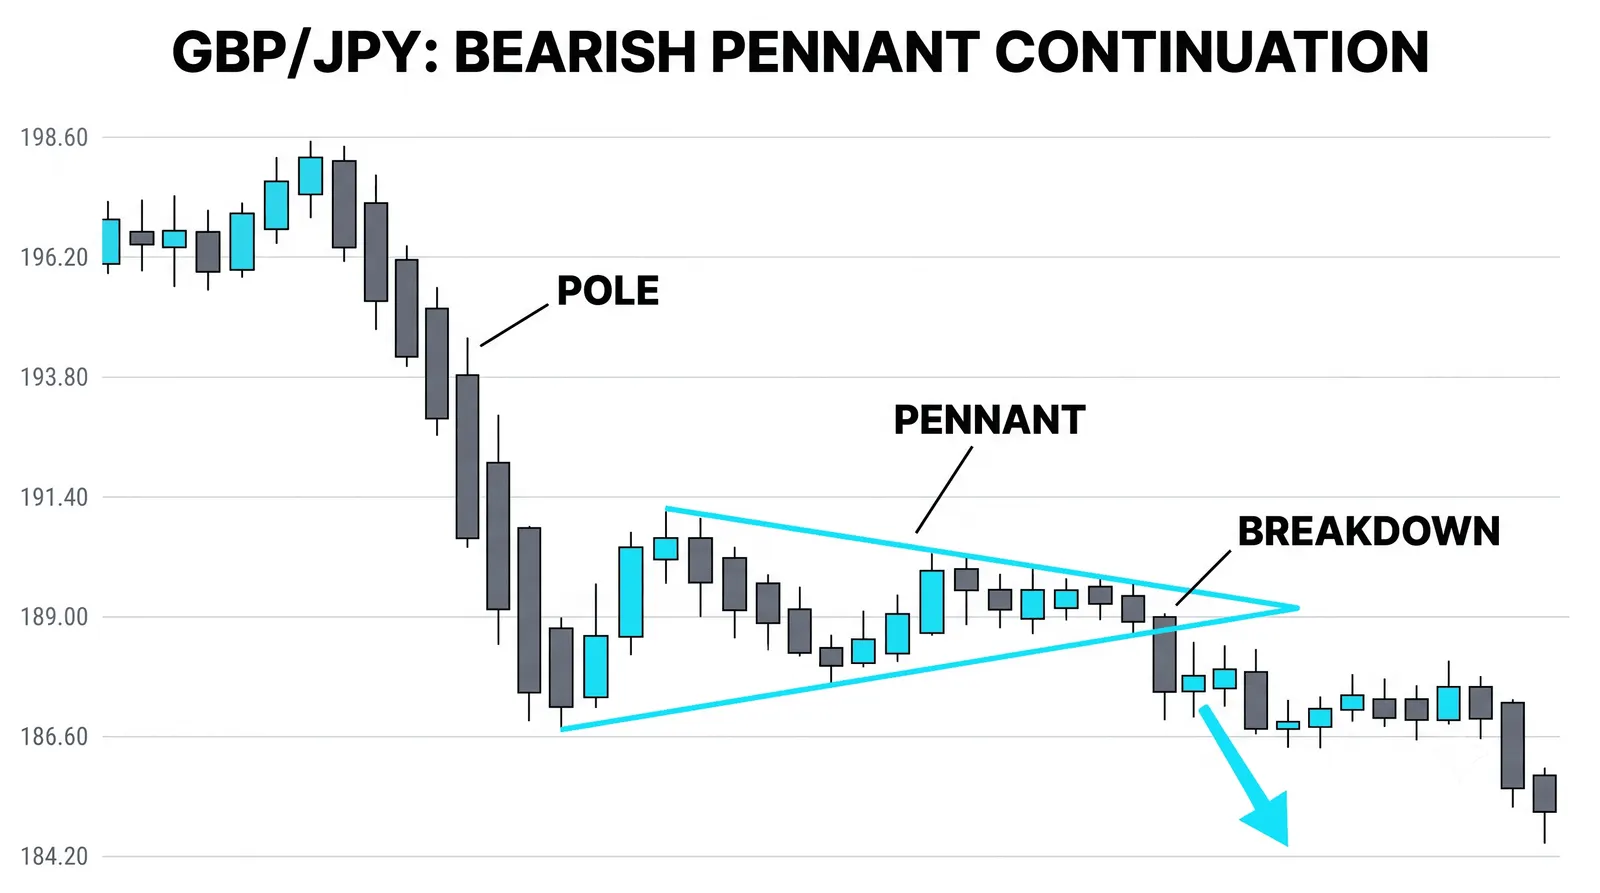
A pennant is the same idea compressed. You get a sharp pole, then a small converging triangle instead of a parallel channel. The highs get lower, the lows get higher, and the range squeezes quickly.
The meaning is identical to the flag: a brief standoff between profit-takers and new buyers, resolved in the direction of the pole. The tighter shape often reflects a faster, more emotional move, which is why pennants show up so often after news-driven spikes.
One note on classification. The pennant is the small triangle that forms right after a pole. The larger triangle family, with its own mechanics and timeframes, gets its own lesson, so we will leave the deeper triangle discussion there.
And the flat, horizontal pause, where price bounces between a level top and a level bottom, is a rectangle. That shape has its own lesson too. Flags and pennants tilt; rectangles sit flat.
The Wedge: The Honest Odd One Out
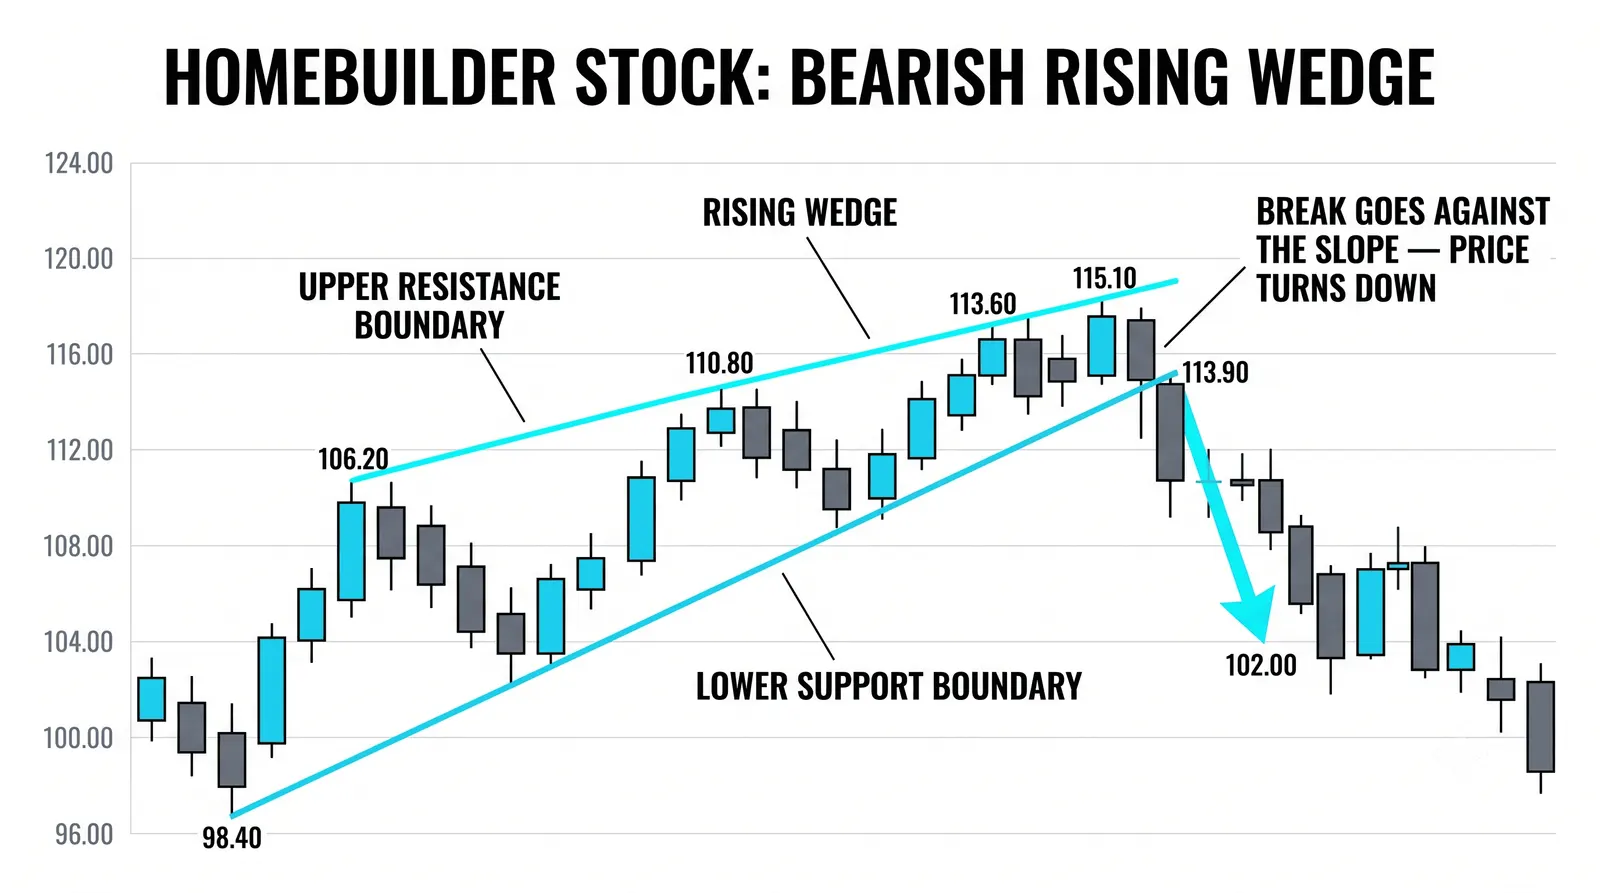
A wedge is three pushes in one direction with the range narrowing as it goes. Both boundary lines slope the same way, but they converge. Price is still making progress, yet each push travels less than the one before.
Context decides how you read it. In a mature uptrend, a rising wedge is a warning. Buyers are still pushing, but with shrinking force, and the pattern often breaks downward. That is the reversal use.
As a pause inside a trend, though, a wedge can resolve either way. A falling wedge in an uptrend frequently breaks upward and continues the move, but the failure rate is higher than with flags and pennants. That makes the wedge the honest odd one out among continuation shapes. It asks for more patience and more confirmation than its cousins.
The practical adjustment is simple. With a flag, a break of the flag line is often enough. With a wedge, many traders wait for the break plus a hold, or a close beyond the boundary, before committing.
What Makes These Patterns Trustworthy
Start with the pole. No pole, no flag. The pole is what the pattern is pausing from. A drift after a slow, grinding climb is just a drift. You want a sharp, committed move first, because that is the energy the continuation is supposed to resume.
Next, judge the pause itself. Shallow and orderly is the standard. A common guideline is that the flag should not retrace much more than a third to a half of the pole, and it should do so on shrinking volume. Deeper than that, and the "pause" story gets hard to defend.
Then weigh the trend context. Continuation patterns in strong trends outperform the same shapes in weak or choppy conditions. A flag in a clean uptrend with rising volume on advances is a different animal from an identical-looking flag inside a directionless range.
A quick checklist before you act on any of these shapes:
- Pole present: a steep, fast move precedes the pause.
- Shallow drift: the pause gives back little of the pole.
- Contracting volume: activity fades during the pause, expands on the break.
- Trend alignment: the higher-timeframe trend points the same way.
- Defined invalidation: you know exactly where the idea is wrong.
That last point matters most. A pattern without a predefined exit is a hope, not a plan.
The Flag After a Pole
Here is a hypothetical example with round numbers, so you can walk the logic end to end.
A stock rallies from 50 to 58 in five sessions. That is the pole: 8 points of fast, directional movement. Volume expands during the rally, which supports the read that real participation drove it.
Then the stock drifts lower in a tight channel, from 58 down to 56.50 over four sessions. The candles are small, volume dries up, and price holds comfortably above 56. That is the flag: shallow, orderly, and clearly a pause rather than a reversal. The retracement is 1.50 against an 8-point pole, well within the shallow range you want.
On the next session, the stock closes at 58.20, above the top of the flag channel. That close is the trigger. The pause has resolved in the direction of the pole.
Now the measured target. The pole height is 8 points. Project that from the breakout area near 58, and you get a rough target of 66. Treat this as an estimate, not a promise. Measured targets describe what the pattern implies if the trend resumes with similar energy. Markets do not owe you the full projection.
For risk, a stop under 56.20 makes sense, sitting below the flag's low and the 56 area that held during the drift. From an entry near 58.20, that is about 2 points of risk against roughly 8 points of potential reward to the target. A 1-to-4 profile on paper.
Notice what the numbers do and do not say. They define the idea, the risk, and the invalidation. They say nothing about certainty. Plenty of clean flags break out, stall, and stop you out anyway. The edge comes from repeating a sound structure with controlled risk, not from any single trade working.
Common Questions About Flags and Wedges
Does a flag have to slope against the trend?
Yes, in the strict definition. A flag after a rally should tilt downward, and after a decline it should tilt upward. If the pause is perfectly flat, you are looking at a rectangle, which is a related but separate pattern. If the pause slopes with the trend and converges, you are in wedge territory, which behaves differently and deserves more caution.
How long can a flag last before it stops being one?
A flag should be short relative to the pole, typically a handful of sessions on a daily chart, and rarely more than two to three weeks. The longer the pause drags on, the more the pole's energy dissipates, and the more the shape starts to look like a range or a top. If the pause outlasts the move that created it, the continuation story is weak.
What if the break of the flag fails?
Failed breakouts happen regularly, and your response should be mechanical: exit at your predefined stop and reassess. A failed flag break often flips meaning, because the buyers who chased the breakout are now trapped and become sellers. Some traders treat a fast failure back through the flag as a signal in the opposite direction, but that is an advanced play. For now, respect the stop and move on.
Are wedges reversal or continuation patterns?
Both, depending on context. A rising wedge after a long uptrend leans toward reversal, while a falling wedge as a pause inside an uptrend often resolves upward as continuation. Because the wedge is less reliable than flags and pennants in either role, demand more confirmation before acting on it, and size the trade accordingly.
Once these pause shapes feel familiar, the natural next step is the rectangle lesson, where the pause flattens completely and the breakout logic shifts from drift to range. That is where continuation reading gets genuinely demanding.