When Support Becomes Resistance
Support becomes resistance when price breaks below a level that held before, because the traders who bought there are now underwater and will sell at breakeven when price returns. The same logic runs in reverse: when resistance breaks, the sellers trapped at that level buy back at breakeven on the way back down, and the old ceiling becomes a floor. This is one of the most dependable behaviors in price action, and it has nothing to do with magic lines on a chart. It comes from order flow and human arithmetic.

The Mechanics of the Flip
Start with a support level that has held. Every time price touched it, buyers stepped in and pushed price back up. Some of those buyers are still holding. They bought at the level, expecting it to keep working.
Now price breaks below. Every one of those buyers is sitting on a loss. They are not thinking about profit anymore. They are thinking about one thing: getting out even.
When price drifts back up to the old level, that is their chance. They sell at breakeven, relieved to escape. Their sell orders stack up exactly where the old support sat, and that supply is what turns the floor into a ceiling.
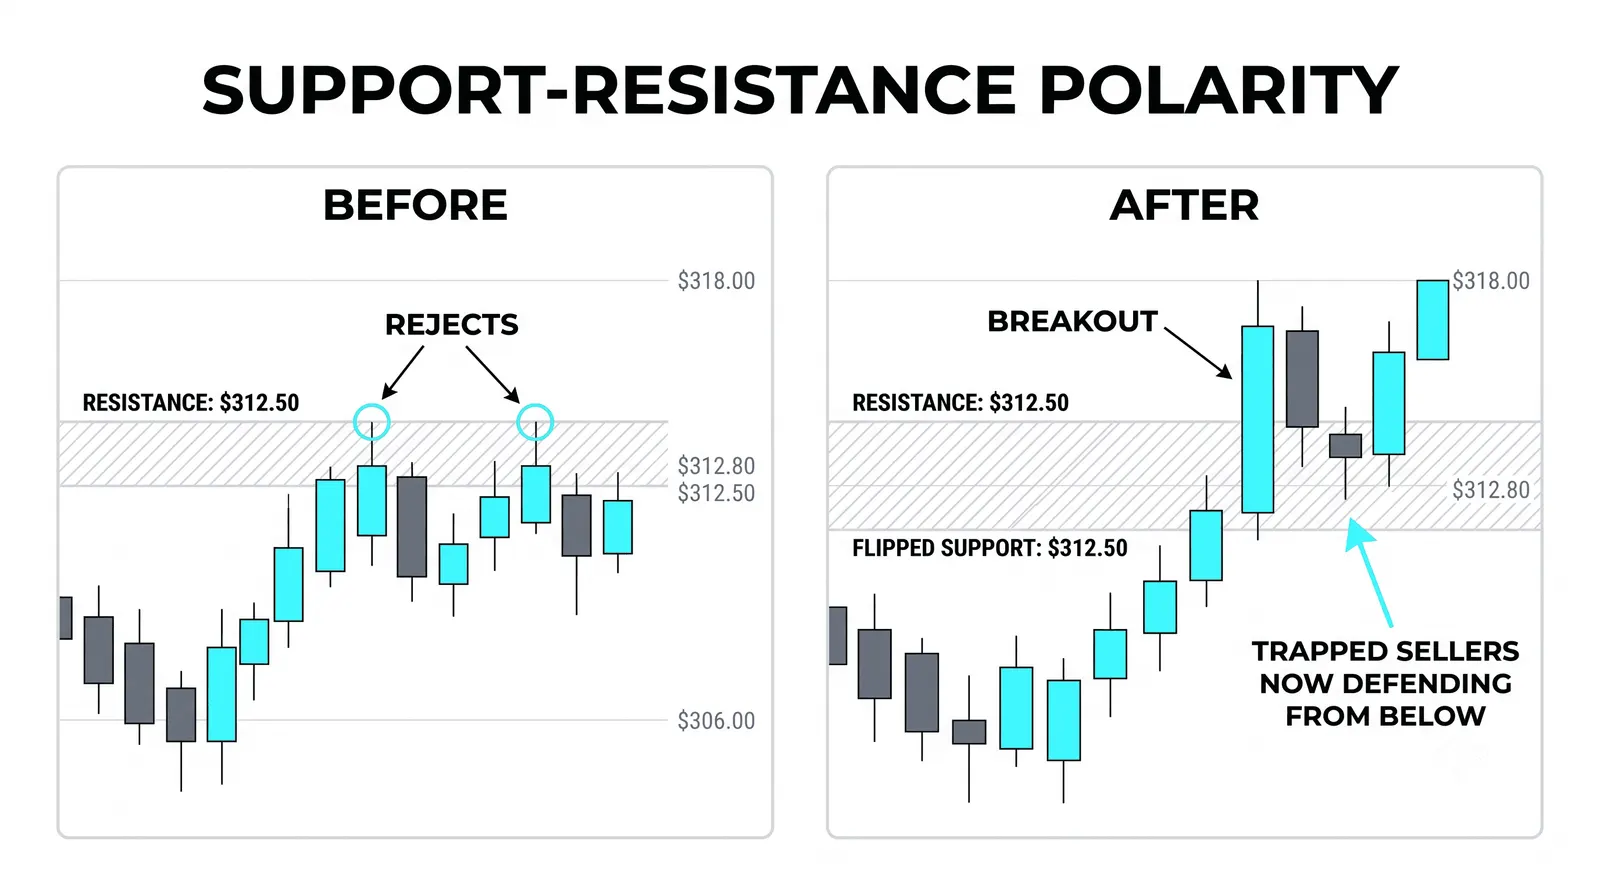
The reverse works the same way. Traders who shorted at resistance are trapped when price breaks above it. When price falls back to the level, they buy to close at breakeven. Their buy orders become the new floor.
Think of it like a former teammate who now plays against you. The defender who knew all your moves when you were teammates now uses every one of them against you.
Why This Behavior Keeps Repeating
The flip is reliable because it is built on the most predictable decision in trading. Breakeven is the one exit almost nobody needs convincing to take.
A trader holding a losing position faces real psychological pressure. Hope keeps them in. Pain pushes them out. The moment price offers an escape with no loss, the decision makes itself. Multiply that by thousands of traders at the same level and you get a wall of orders.
This is not mysticism. It is not the market remembering anything. It is trapped participants acting in their own interest, all at the same price, all at the same time.
That is also why the flip shows up across markets and across decades. Human arithmetic does not change. A trader underwater at a level in 1985 felt exactly what a trader underwater at that level feels today.
How Decisive the Break Must Be
Not every break creates a flip. The level only fills with trapped traders if the break is real enough to convince people it failed.
A wick poking through support traps almost nobody. Price dipped, snapped back, and the buyers at the level were never in serious trouble. They have no reason to sell at breakeven later, because they were never truly underwater.
A close beyond the level is different. When a candle closes through support, especially on a timeframe people respect, the message spreads: the level gave way. That is when holders start planning their exit. That is when the zone fills with future sellers.
As a rough filter, look for these signs of a meaningful break:
- A candle close beyond the level, not just an intrabar poke.
- Follow-through after the break, not an instant snap back.
- Increased volume or range on the break, showing real participation.
- Time spent beyond the level, which deepens the trap.
The deeper and longer price trades past the level, the more trapped inventory builds, and the stronger the flip tends to be.
Trading the Retest
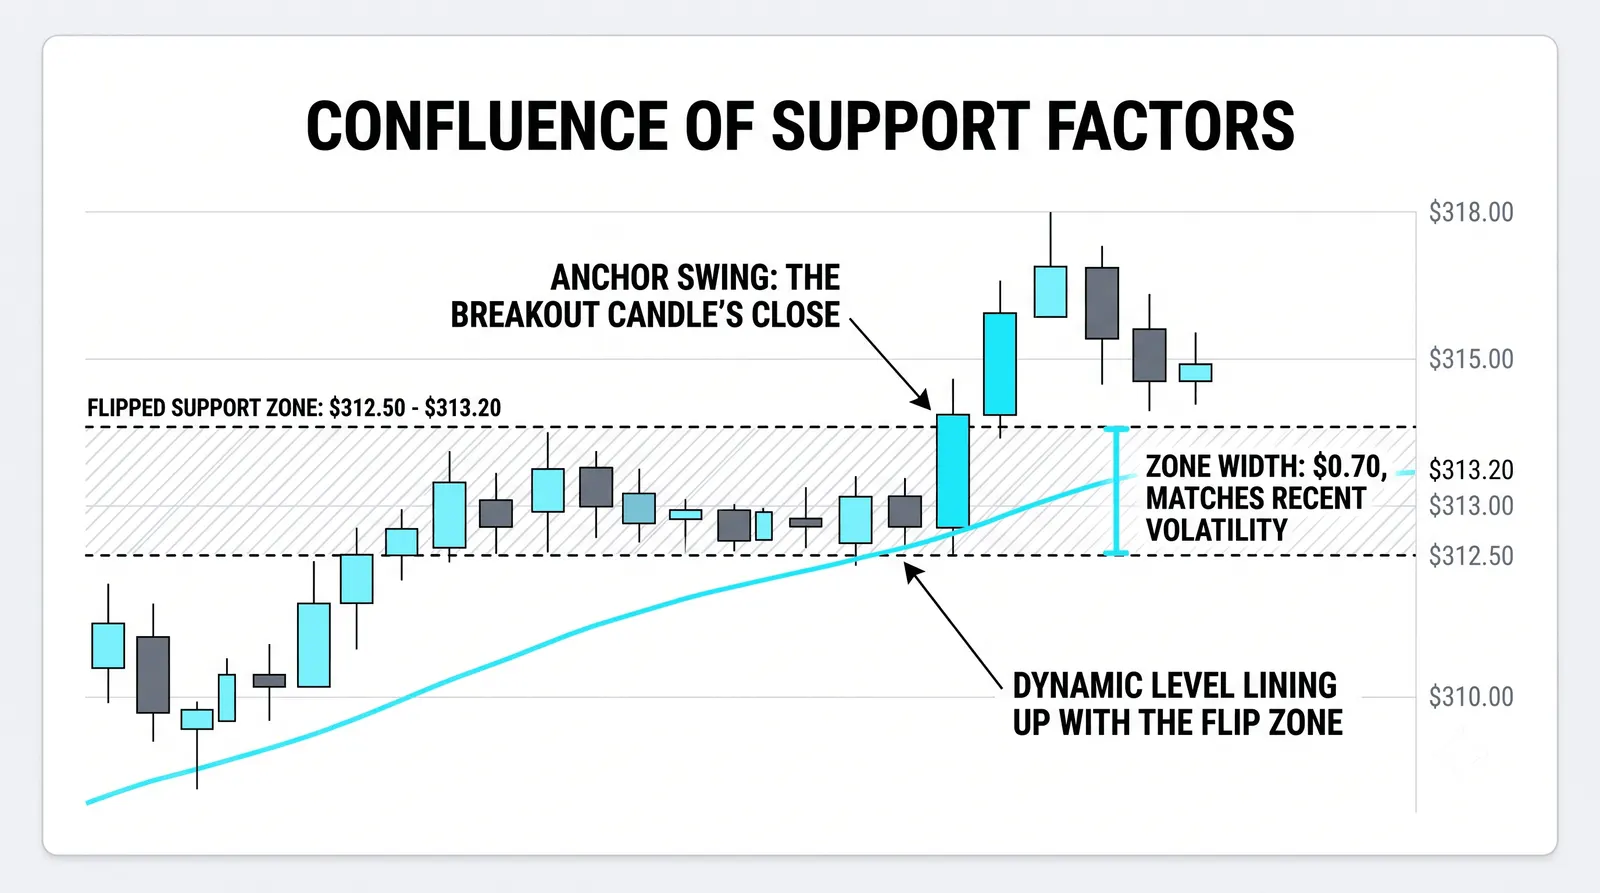
The flip hands you a second chance. You do not need to chase the break. You wait for price to come back and test the flipped level.
The retest is the entry. If support broke and price rallies back into the old zone, you look for signs the level is now acting as resistance: stalling momentum, rejection candles, failure to close back above. Then you take the short.
The recent extreme is the invalidation. For a short at flipped resistance, the stop goes above the high of the retest, or above the level itself if you want more room. If price closes back through, the flip failed and your reason for the trade is gone.
The trade writes its own stop. That is the real gift of this setup. You are not guessing where you are wrong. The structure tells you.
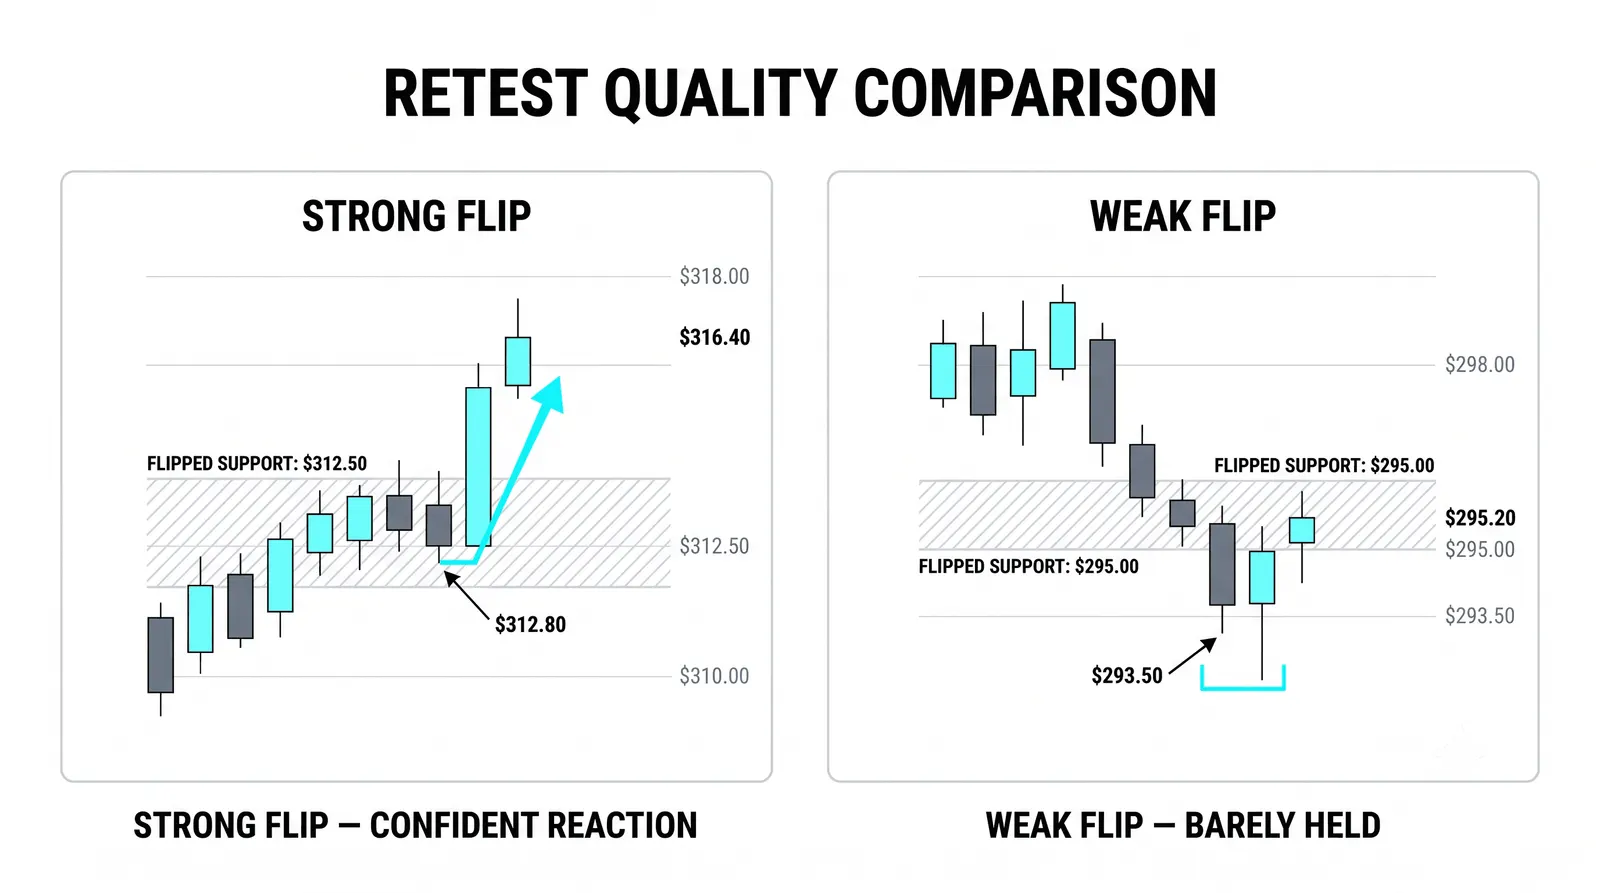
Keep your expectations honest. A retest entry with a tight invalidation gives you a good risk-to-reward profile, but it still loses sometimes. No pattern pays a salary. Size the trade so a loss is a cost of doing business, not a wound.
When the Flip Fails
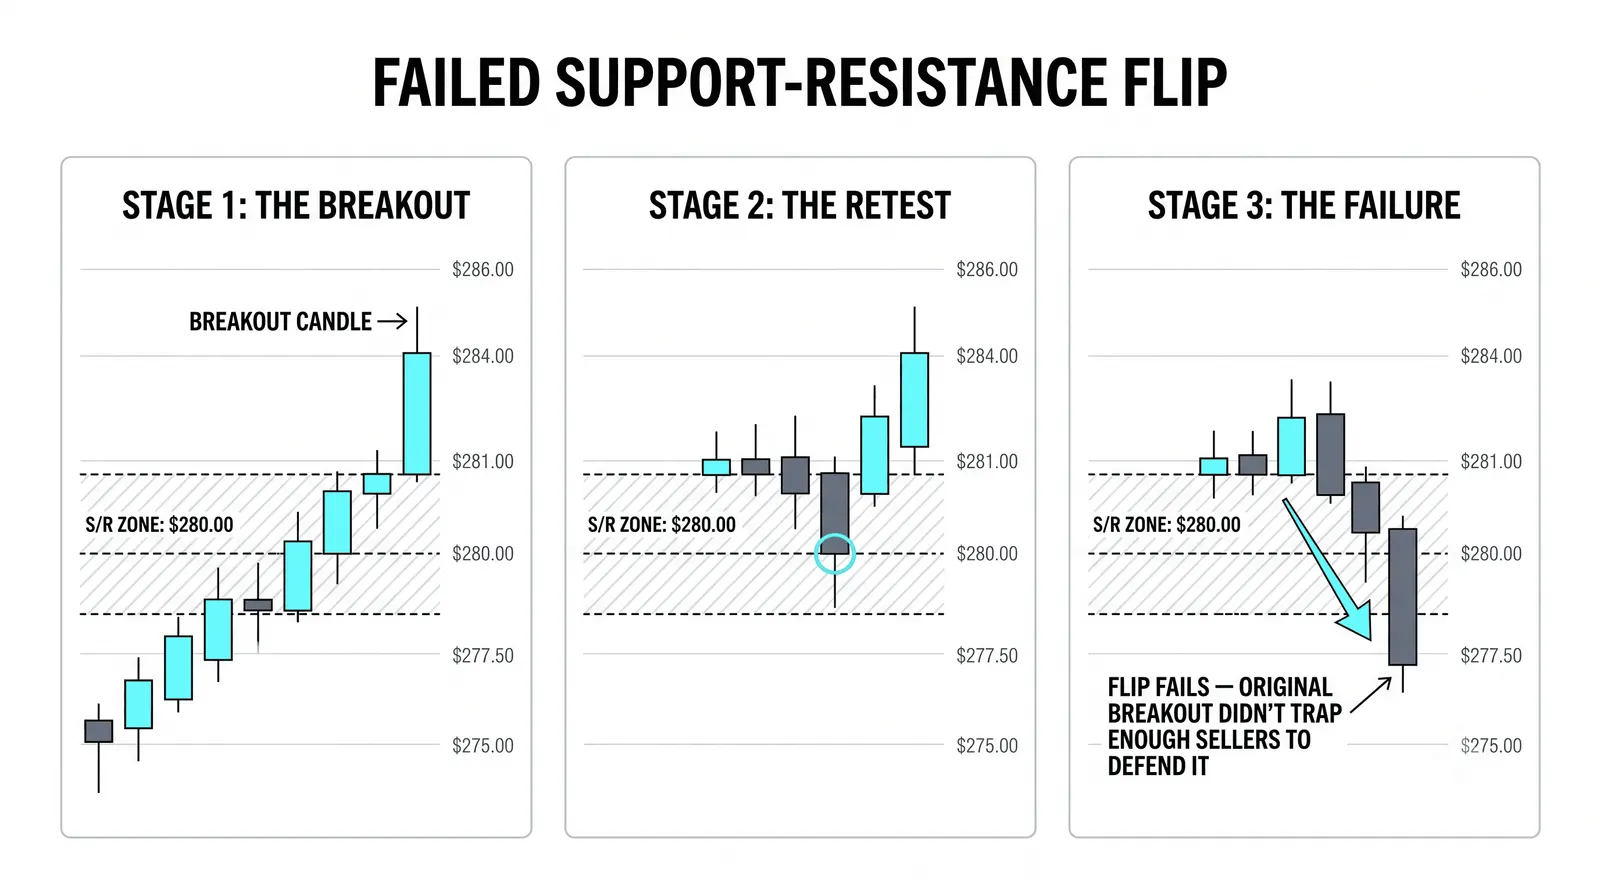
Sometimes price breaks a level, comes back, and slices straight through it. The flip does not hold. This is not a reason to abandon the concept. It is information.
A failed flip tells you the break was noise. The traders you expected to sell at breakeven either were not there in size or were overwhelmed by buyers with stronger conviction. Price reclaiming the level fast, and holding above it, shows unusual strength.
Many traders treat a failed pattern as a pure loss. That is a waste. A failed bearish flip is often a bullish signal in its own right, because the market just proved the sellers at that level are not in control, which is continuation announcing itself.
The rule is simple: respect the flip while it holds, and respect its failure just as quickly. Stubbornness about a level is how small losses become big ones.
The Flip at 460
Here is a hypothetical example with round numbers. Nothing about it is a recommendation; it is a walkthrough of the mechanics.
A stock holds support at 460 twice over several weeks. Both times, buyers step in and price bounces. Traders who bought those bounces feel good. The level looks solid.
Then a daily candle closes at 449, roughly two percent through the level. That close changes everything. Every buyer from the two bounces at 460 is now underwater, and they know it.
Price drifts down to 438 over the next few sessions. The trapped longs are sitting on losses and hoping for a recovery. Then the rally comes. Price climbs back to 459, right into the old support zone.
Watch what happens at 459. The trapped buyers from 460 finally see breakeven, or close to it. They sell to escape. Their sell orders hit the rally, and price stalls inside the old zone. It cannot close back above 460. It rolls over.
A trader reading the flip shorts near 459 with a stop above the retest high, say 463. Price continues lower, back toward 438 and beyond. The old floor did its new job as a ceiling.
Name the players clearly: the trapped are the longs who bought the two bounces at 460. Their breakeven selling is the supply that stopped the rally at 459. Nothing mysterious happened. Arithmetic did the work.
Support and Resistance Flips: Your Questions, Answered
Does a broken level always flip?
No. A level flips only when the break was decisive enough to trap real inventory, and even then the flip can fail if stronger flow overwhelms it. Treat the flip as a tendency, not a law, and let the retest confirm before you commit.
How long does the flip last?
A flipped level usually matters most on the first retest, and it weakens with each visit after that. Every touch lets trapped traders exit, which drains the supply or demand that created the flip. Old levels from weeks or months ago can still react, but expect less from them.
Does this work on every timeframe?
Yes, because the psychology behind it does not change with the clock. A flip on a five-minute chart traps scalpers; a flip on a weekly chart traps position traders. Higher timeframes generally produce flips with more weight, because more participants see and respect those levels.
What is the difference between a flip and a retest?
The flip is the change in the level's role, from support to resistance or the reverse. The retest is price coming back to visit that flipped level. The flip is the condition; the retest is the event you trade.
Once you start seeing flips, you will spot them on every chart you open. The next step is learning to read how price behaves at the retest itself, because the quality of that reaction is what separates a clean entry from a coin flip. That is where candlestick context and momentum reading come in, and that is where we go next.