The Anatomy of a Downtrend
A downtrend is a repeating structure of lower highs and lower lows, and it stays alive for exactly as long as that repetition holds. Every rally inside it is a pause, not a rescue. Those pauses refill the selling, and then the decline resumes.

Think of sand running through an hourglass: now and then a clump bunches up and stops the flow for a moment, but the drain continues. That clump is the bounce. The drain is the trend.
You already know what a lower low and a lower high are, so we will not re-derive them here. This lesson is about what the whole sequence means, how to read its health, and how to recognize the moment it stops being a downtrend at all.
The Shape of Decline
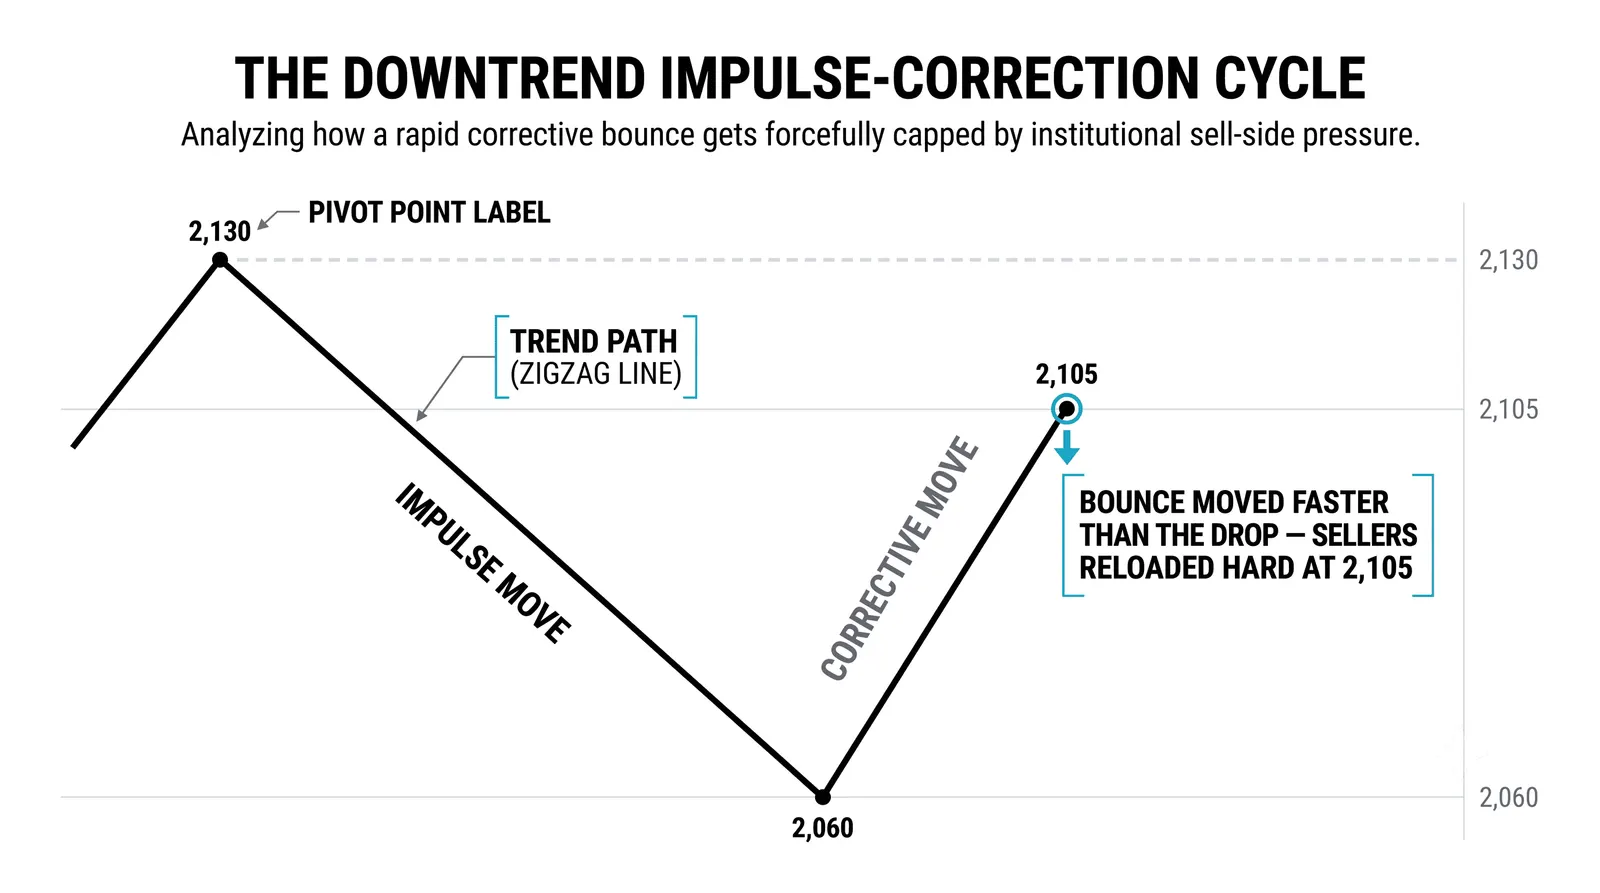
Price does not fall in a straight line. It falls, bounces, and falls again, and the bounces are deliberate: each one is where two groups meet: trapped longs who bought higher and finally get a chance to exit with smaller losses, and new sellers who waited for a better price to short from.
Both groups sell into the same rally. That is why bounces in a downtrend tend to be sharp, short, and disappointing. They start fast because short sellers take profits and bargain hunters step in, then they stall because the overhead supply is real and motivated.
The bounce is not weakness in the downtrend. It is fuel for it. Every rally that fails below the prior swing high confirms that sellers still control the higher prices, and each failed rally hands the decline a fresh batch of stop-losses sitting underneath the most recent low.
The Rules That Keep It Valid
A downtrend has a short rulebook, and you should be able to recite it without thinking:
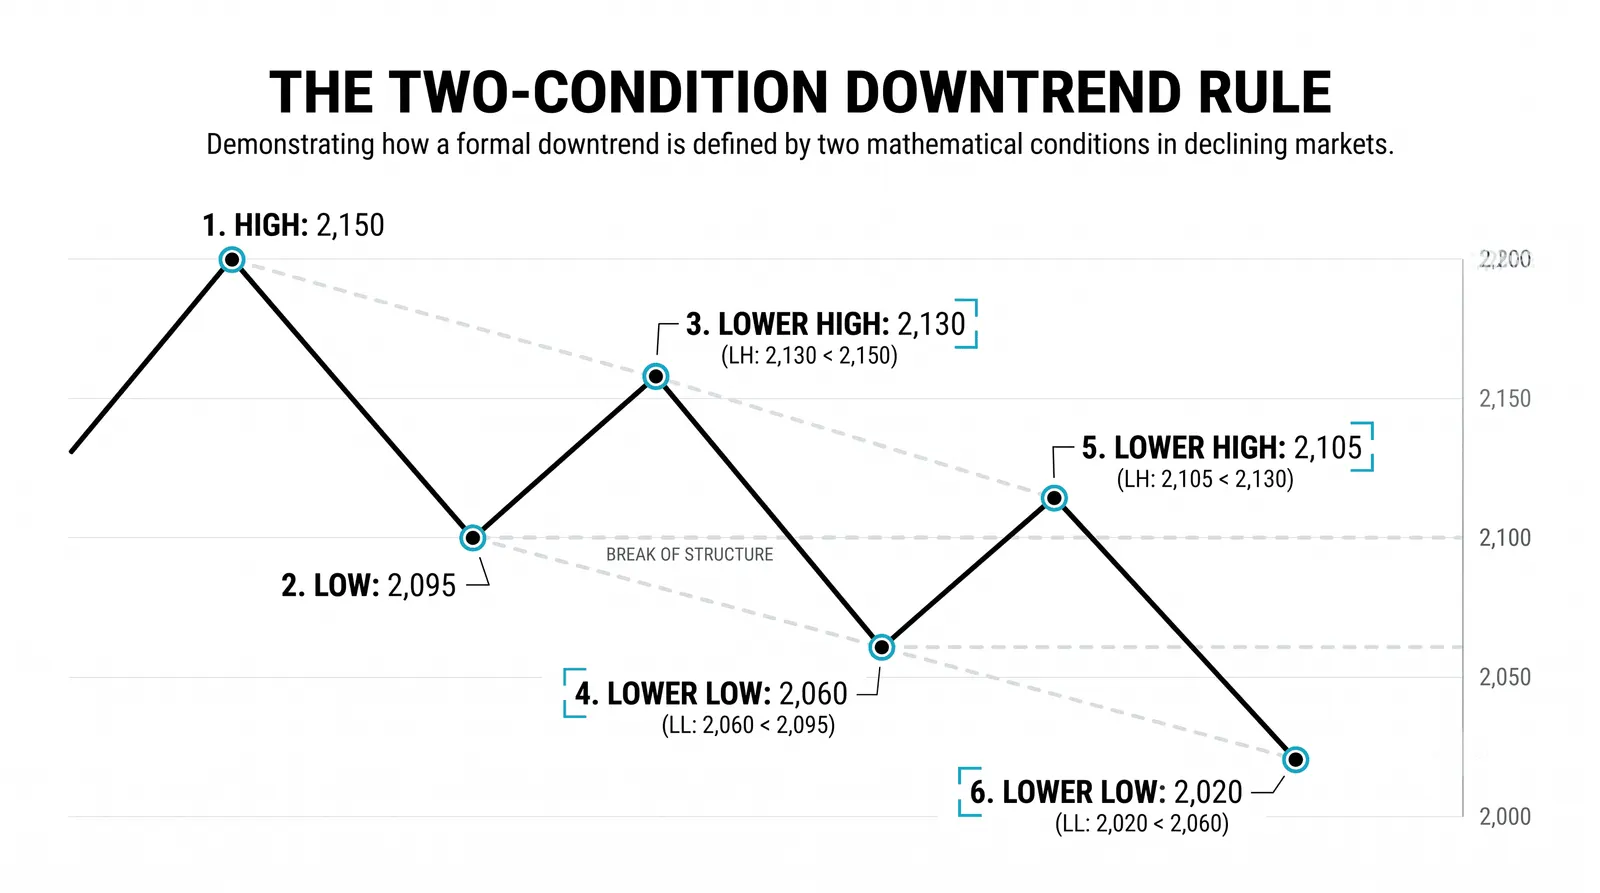
- Each swing high must form below the previous swing high.
- Each swing low must form below the previous swing low.
- Bounces should die at or under the prior swing high, ideally well under it.
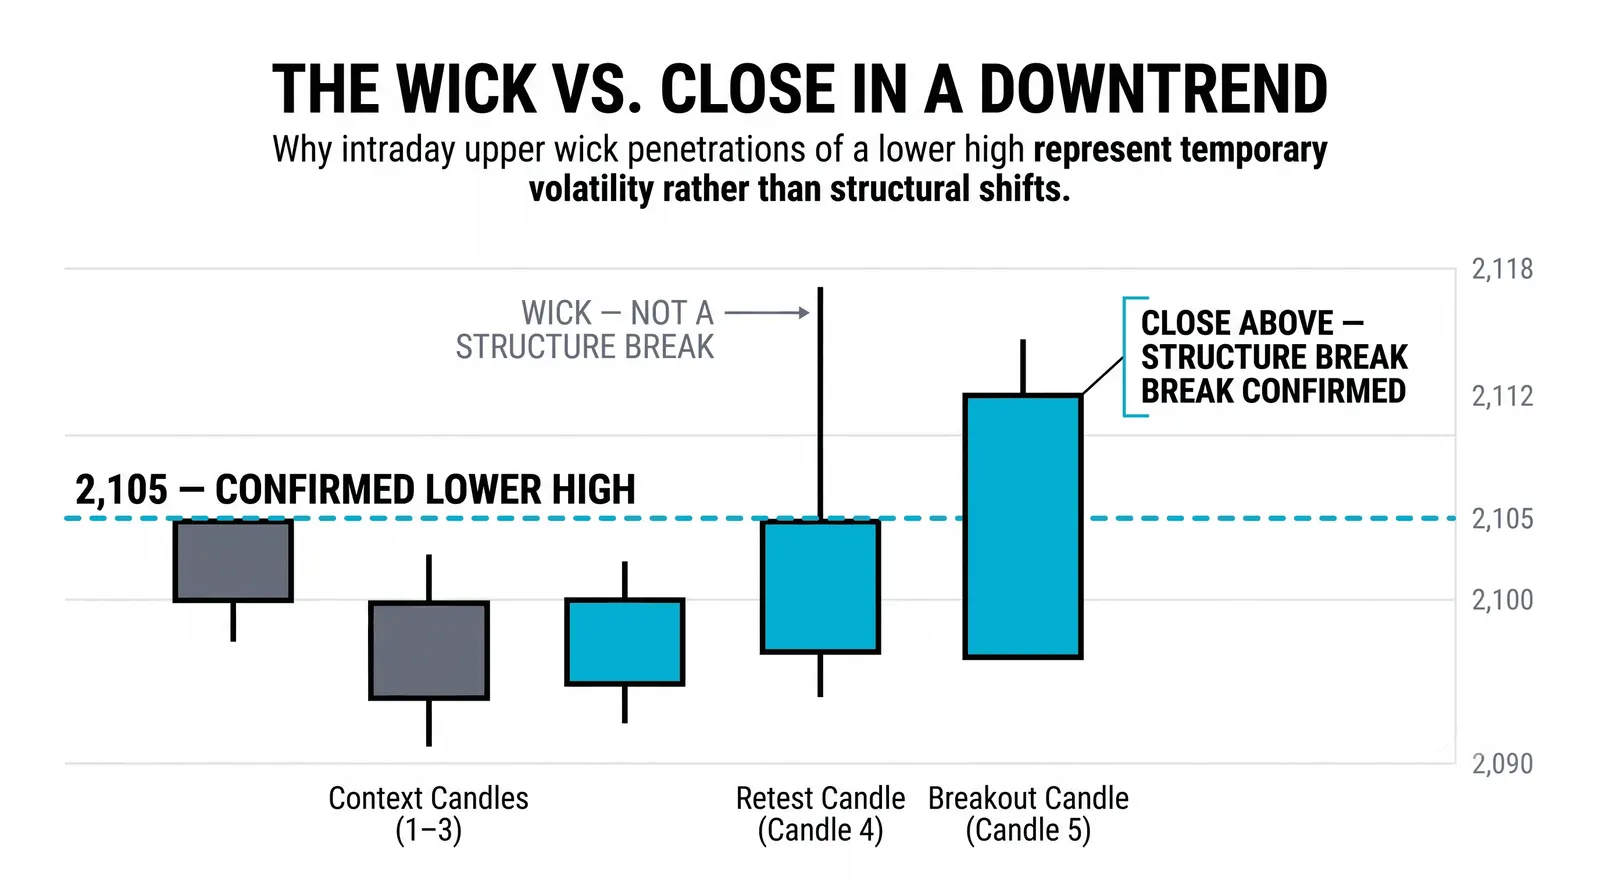
- A close above the most recent lower high is the first formal warning that the structure is slipping.
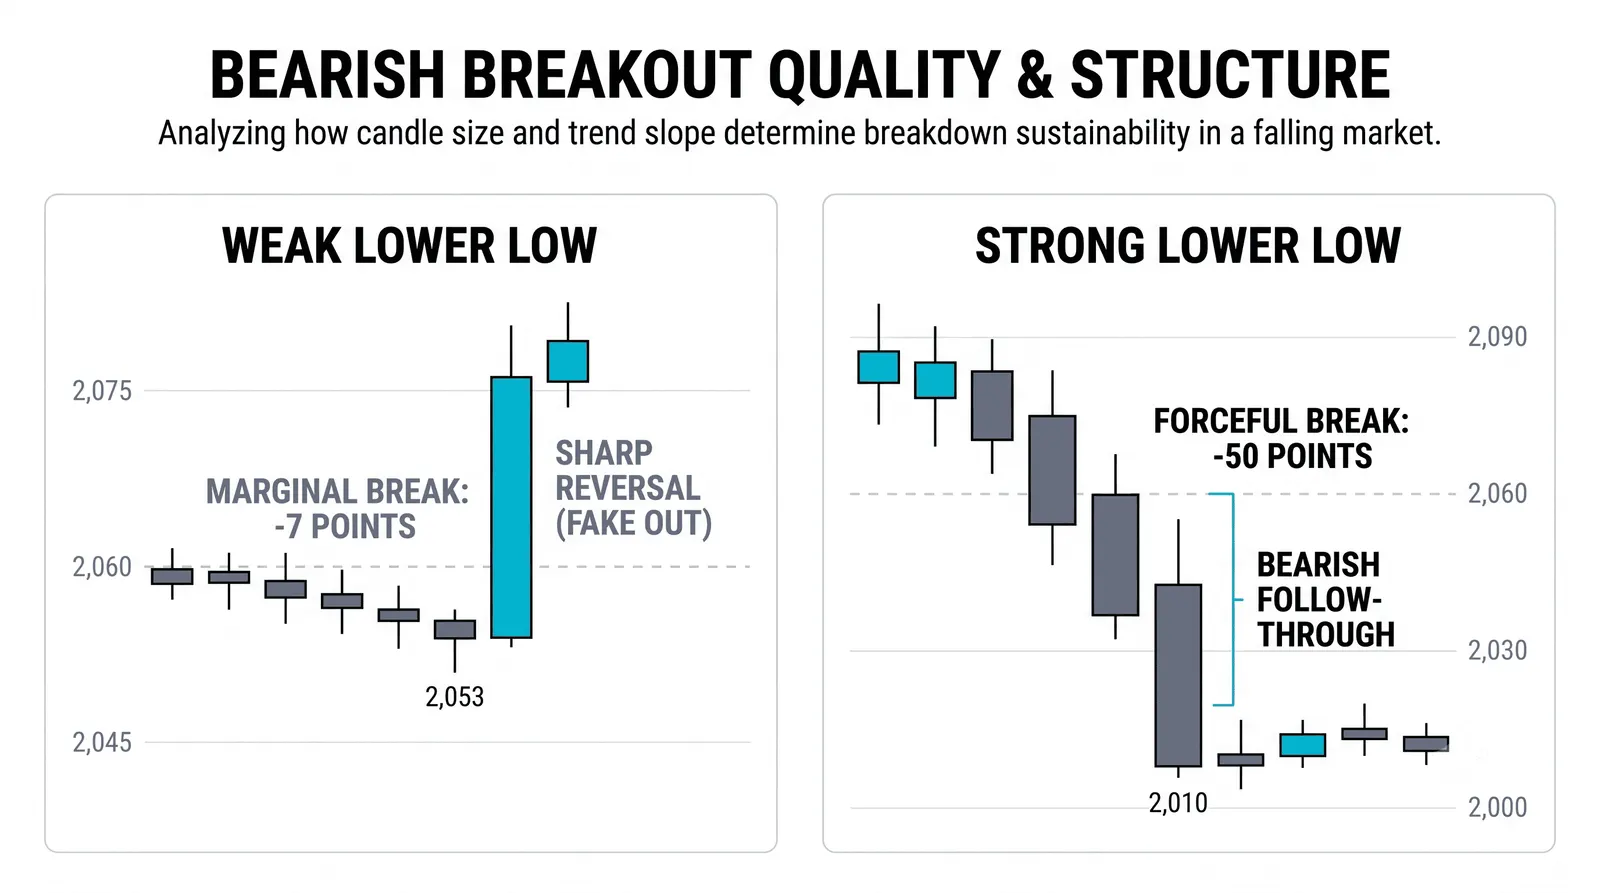
Note the word "close." An intraday poke above a lower high means little. Sellers fade those pokes all the time. A candle that closes above the level is a different statement, because it means buyers held the ground through the end of the session.
One violation is a warning, not a funeral. Trends can survive a single broken rule if the next decline still makes a new low. Two violations in a row, a higher high followed by a higher low, and the structure you were trading no longer exists.
Reading the Impulse and the Bounce
In a downtrend, the declines are the impulse phase and the rallies are the correction. This flips the instinct most new traders bring, which is to treat every up-move as the "real" move and every drop as the interruption. In a downtrend the opposite holds. The drops carry the intent. The rallies carry the doubt.
Pay attention to how the two phases compare in speed and shape. Healthy impulses tend to cover ground quickly and close near their lows. Healthy corrections tend to be slower, choppier, and smaller than the decline they follow.
Now the nuance. A bounce that retraces deeply and overlaps most of the prior drop is a different animal from a clean, fast bounce that gives back a third of the decline and rolls over. Heavy overlap tells you buyers are absorbing supply with real aggression, more than short-covering alone. It does not end the downtrend by itself, but it lowers the quality of the next short and raises the odds the structure is tiring.
Healthy Versus Tired
A healthy downtrend has a rhythm you can feel. Declines are long and decisive. Bounces are brief and shallow. Each new low arrives without much struggle, and sellers do not need to work hard to push price down.
A tired downtrend looks different, and the signs are measurable:
- Bounce legs get longer, both in price and in time.
- Declines get shallower, making new lows by smaller and smaller margins.
- Sellers need more candles and more volume to achieve less ground.
- Bounces start closing above the midpoint of the prior drop instead of dying in the lower third.
None of these signs ring a bell at the bottom. They accumulate. Your job is to notice that the effort-to-result ratio is shifting, and to stop treating every bounce as an automatic short when the evidence says the sellers are running out of stamina.
How a Downtrend Ends
Downtrends end when the sequence fails, and the failure has an order to it. First comes a higher high: a bounce that closes above the last lower high. Then comes the part most traders skip, a higher low: the next decline that refuses to make a new low. When both have printed, the lower-high, lower-low chain is broken in both directions.
The bottom is a process, rarely a single candle. Markets usually stop falling because large buyers accumulate over weeks, absorbing supply in a zone rather than chasing price up in one dramatic session. The dramatic reversal candle you see in screenshots is usually the last act of a quiet accumulation that was visible in the structure for some time.
So do not try to catch the exact low. Wait for the structure to prove itself: a higher high, then a higher low, then a pullback that holds. You will miss the first portion of the recovery. That is the cost of trading with evidence instead of hope, and it is a cost worth paying.
One Downtrend, Four Legs
Here is a hypothetical stock, with round numbers, so you can watch the rules operate. Suppose the stock falls from 88 to 80. That is leg one, a decline. It bounces to 84. That is leg two, a bounce, and note it dies below 88, so the first lower high is in place.
Leg three: the stock falls from 84 to 74. New lower low, below 80. The structure is confirmed, not assumed. Leg four: it bounces from 74 to 79. That bounce stalls below 84, printing another lower high. Sellers are still in control of the higher ground.
Then price breaks toward 68, undercutting 74. The chain extends: lower high at 84, lower high at 79, lower low at 74, and now a push toward a new low at 68.
Now mark your warning levels before you need them. A close above 79 puts the most recent lower high at risk, which is the first formal warning. A close above 84 breaks the structure outright, because it takes out two lower highs in one move. Below 79, nothing has changed and the downtrend deserves the benefit of the doubt. Between 79 and 84, you are on alert. Above 84, the downtrend read is wrong and you act accordingly.
Common Questions About Downtrends
Should I short every bounce in a downtrend?
No. Shorting every bounce ignores location, momentum, and the health of the trend itself. The bounces worth shorting are the ones that stall into a prior swing area with fading momentum, early or mid-trend. Late in a tired downtrend, the same bounce shape carries much worse odds, because the declines it depends on are running out of power.
How deep can a bounce go and still count?
A bounce can retrace most of the prior decline and still leave the downtrend technically intact, as long as it does not close above the last lower high. Depth alone does not break structure. That said, retracements beyond roughly two-thirds of the prior drop usually signal weakening seller control, so treat deep bounces as lower-quality short setups even when the rules still hold.
Does low volume change the read?
Yes, mostly on the bounce side. Low volume on a rally supports the idea that the move is short-covering rather than genuine buying, which favors continuation lower. Low volume on a decline is more ambiguous: it can mean sellers are exhausted, or simply that nobody is interested either way. Read volume as confirmation of what the structure already suggests, never as a standalone signal.
When does a downtrend become a range?
A downtrend becomes a range when price stops making lower lows but has not yet made a higher high. You get a low that holds, a bounce that fails at the same ceiling as the last one, and then repeated tests of both edges. At that point the trend rules no longer apply, and you either switch to range tactics or stand aside until the structure picks a direction again.
Once you can read a downtrend this way, leg by leg, with warning levels marked in advance, the next skill is placing that structure inside the larger timeframe above it. A downtrend on your chart is often just a pullback on someone else's, and knowing which one you are looking at changes every decision you make.