Rectangle Pattern and Horizontal Channels
The rectangle pattern is a pause where price bounces between two horizontal walls: flat support below, flat resistance above. After a trend, it usually resolves in the direction of the move that came before it. That last part is what separates it from a random range, and it is the part most beginners skip.

Price inside a rectangle behaves like a ball bouncing between two cushions, losing a little energy each time until one cushion finally gives way. Your job is not to predict which cushion breaks. It is to recognize the structure, respect the walls, and act when the market shows its hand.
What the Rectangle Pattern Actually Is
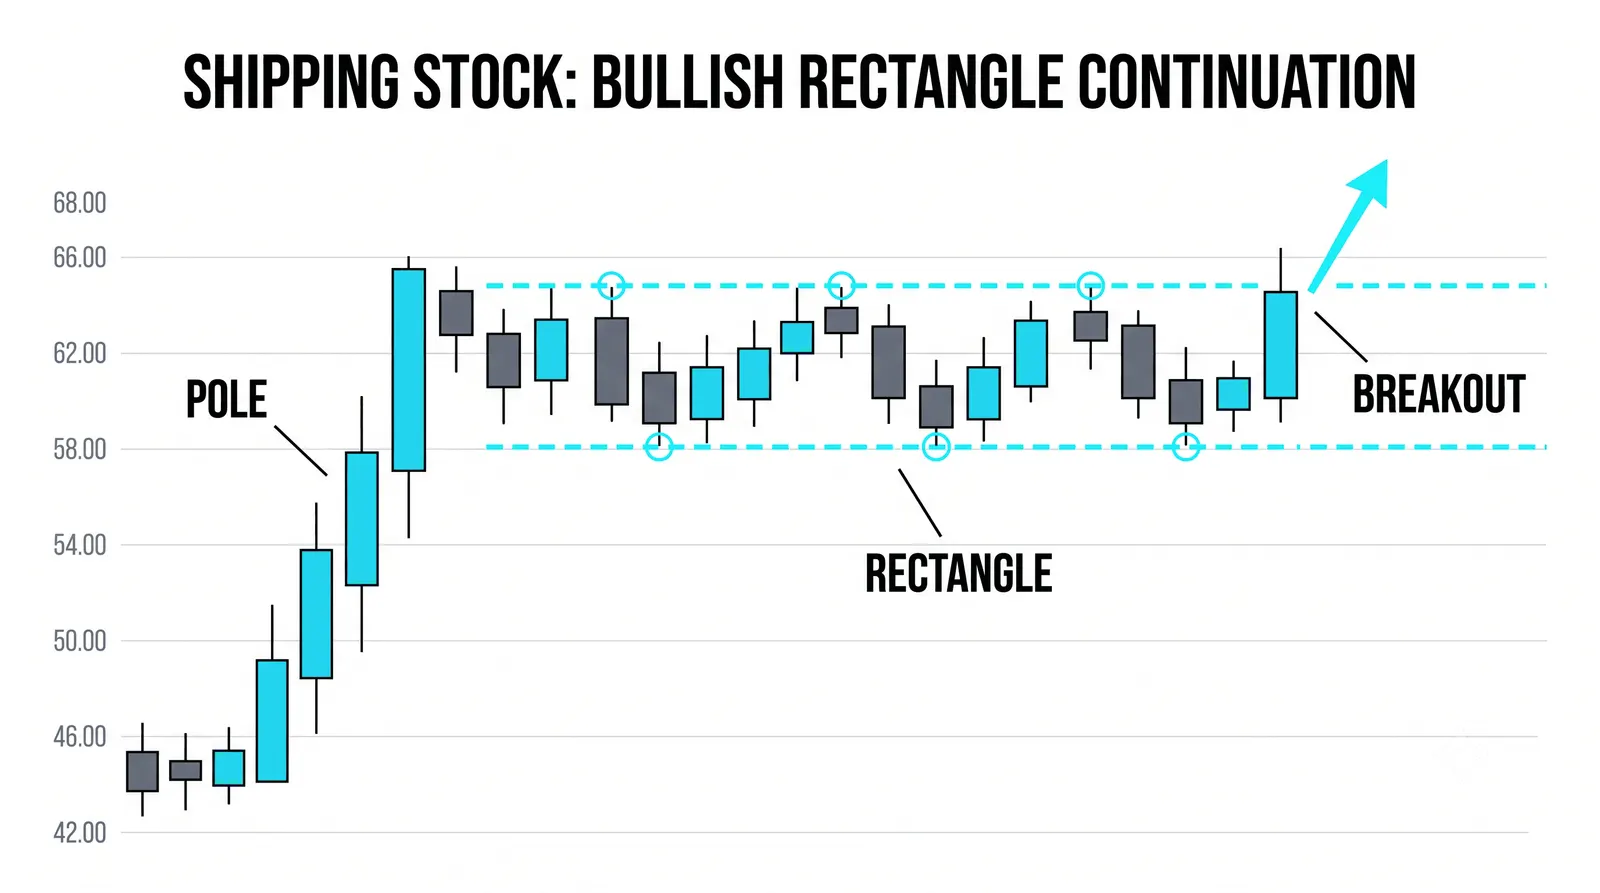
A rectangle has two parallel, flat boundaries. Resistance sits on top, support sits on the bottom, and price lives between them for days to weeks.
You need at least two touches of each wall before the pattern earns its name. One touch is a level. Two touches that hold is a wall. Three or more touches make the wall obvious to everyone, which cuts both ways.
The walls should be horizontal, or very close to it. If the boundaries slope, you are looking at a channel or a flag, and those carry different behavior. Precision in naming matters because the statistics behind each pattern differ.
Time matters too. A rectangle that forms over three sessions is noise. One that holds for two to six weeks represents a real standoff between buyers and sellers, and standoffs resolve with force.
Why Rectangles Form After Trends
After a strong move up, early buyers want to lock in profit. Their selling creates the ceiling. At the same time, traders who missed the move want in, and their buying creates the floor.
The key detail is where the floor forms. If profit-taking gets absorbed at a higher level than the old breakout zone, willing buyers are accepting the new price. That is strength, not weakness. The bigger trend is resting, not dying.
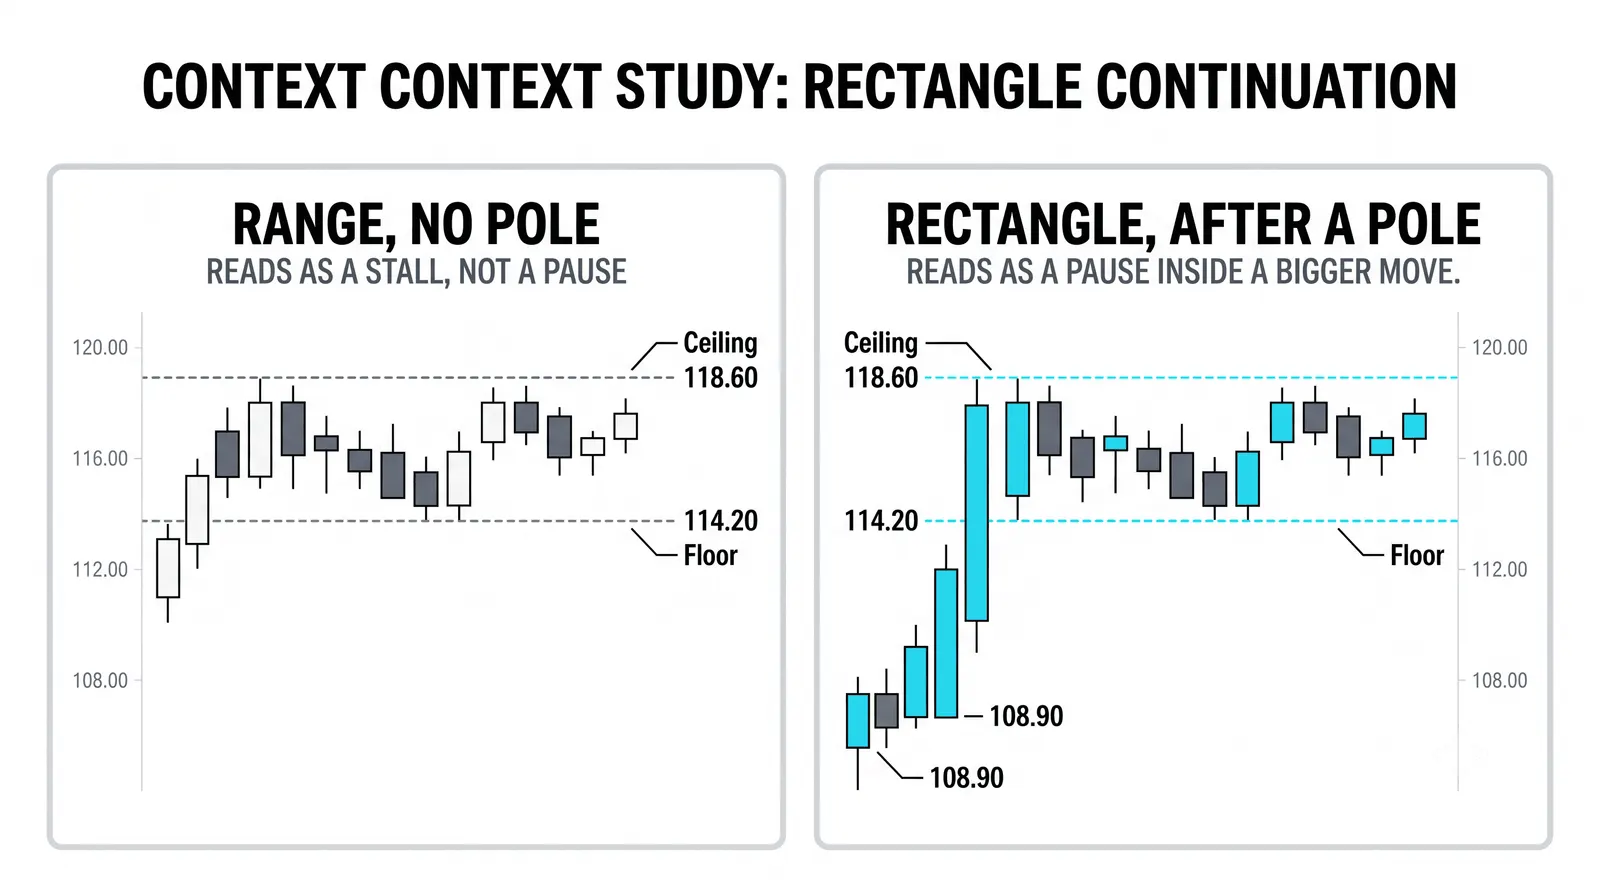
This is why context decides everything. A rectangle after an uptrend is a continuation candidate by base rates. The same shape after nothing, sitting in the middle of a chart with no prior move, is just a range with no directional edge at all.
Same drawing, different meaning. Always ask what came before the box before you decide what the box means.
Life Inside the Box
Volume usually dries up toward the middle of the pattern. Interest fades while both sides wait. Then volume picks up near the edges, where the actual fight happens.
The middle of the range is a punishment zone. Price chops back and forth with no edge for anyone, and impatient traders get chewed up taking positions at 50 when the walls are at 45 and 55.
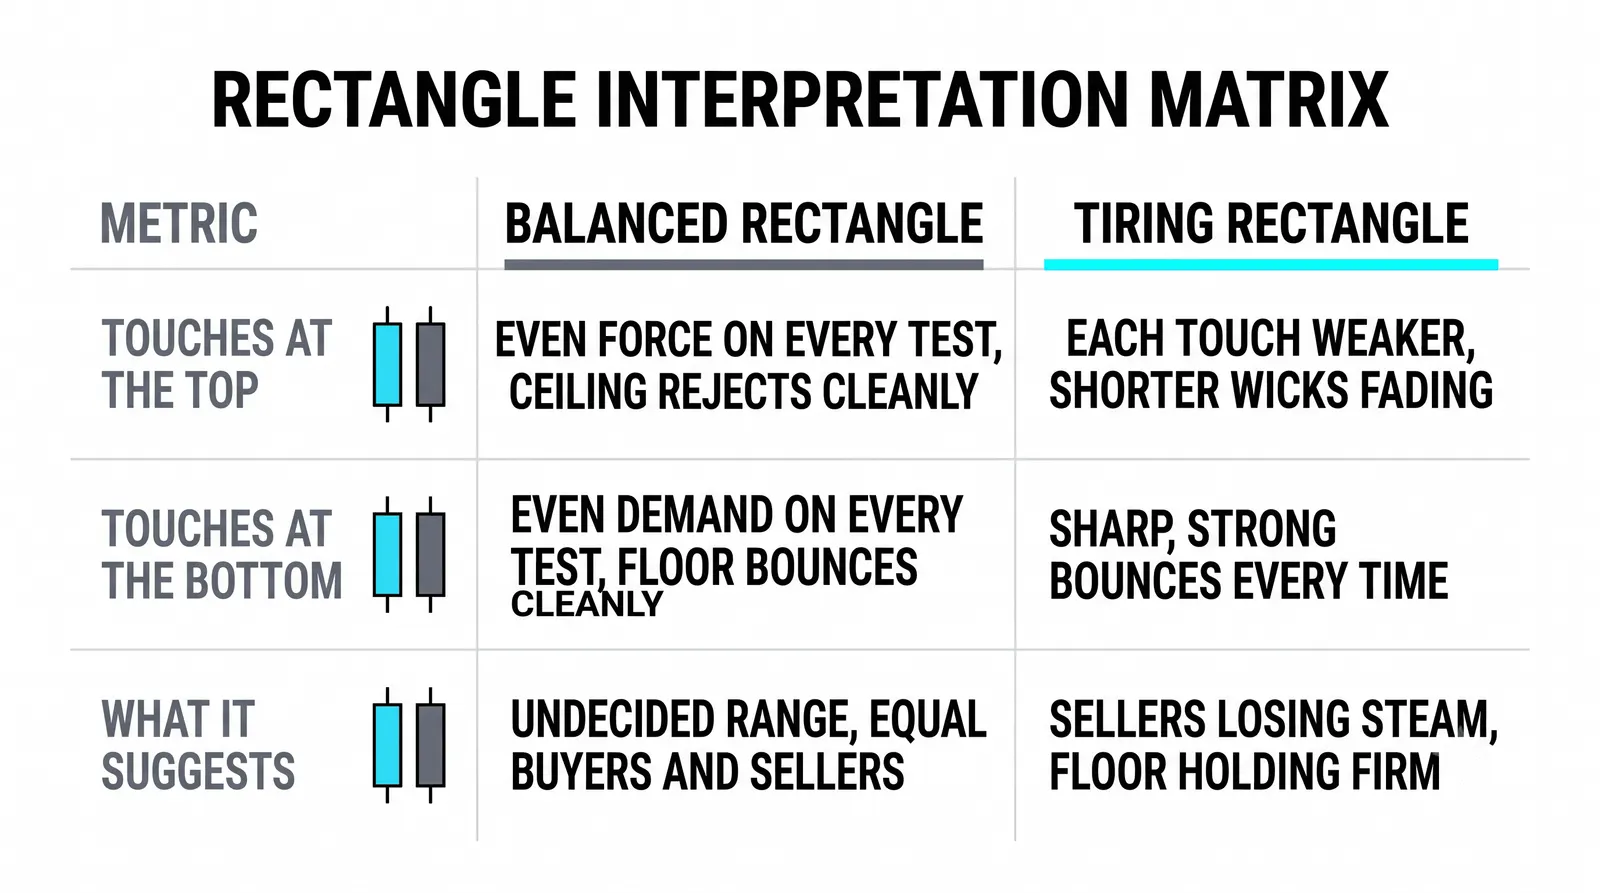
Watch the touches themselves. Clean rejections with long wicks tell you the wall is defended. Slow, grinding approaches that sit on the wall tell you pressure is building against it.
Most traders lose money inside rectangles not because the pattern failed, but because they traded the middle. The middle has no information. The walls have all the information.
Trading the Walls Versus Trading the Break
You have two honest ways to trade a rectangle, and they demand different temperaments.
The first is fading the edges. You sell near resistance, buy near support, and place your stop just outside the wall. This works until it does not, because the final touch is the one that breaks. Your win rate is high and your last trade is a loss.
The second is waiting for the break. You let price close decisively beyond a wall, then enter on the retest of that wall from the other side. You give up the early entries in exchange for confirmation.
The measured target for a break is simple: take the height of the rectangle and project it from the break point. A six-point box that breaks upward aims six points higher. It is a planning tool, not a promise.
Two Walls, One Range
Here is a hypothetical walkthrough with round numbers. Nothing about it is a recommendation; it is a mechanics drill.
A stock trends up from 80 to 100. Then it stalls. Over the next four weeks, price bounces between 94 and 100, touching each wall twice with clean rejections. That is your rectangle: six points tall, formed after a clear uptrend.
Volume fades in the middle weeks. Each test of 100 gets a little more active. You mark the walls and wait.
Then price closes at 101.50 on strong volume. That is a decisive close above the wall, not a wick. You do not chase it.
Two sessions later, price pulls back to 100 and holds. Old resistance becomes new support. You enter on the retest at 100.50, with a stop back inside the box, say at 98.50.
The measured target is 106: the six-point height added to the 100 break point. Your risk is two points, your target is five and a half. That is a trade you can evaluate honestly, win or lose.
The False Break Problem
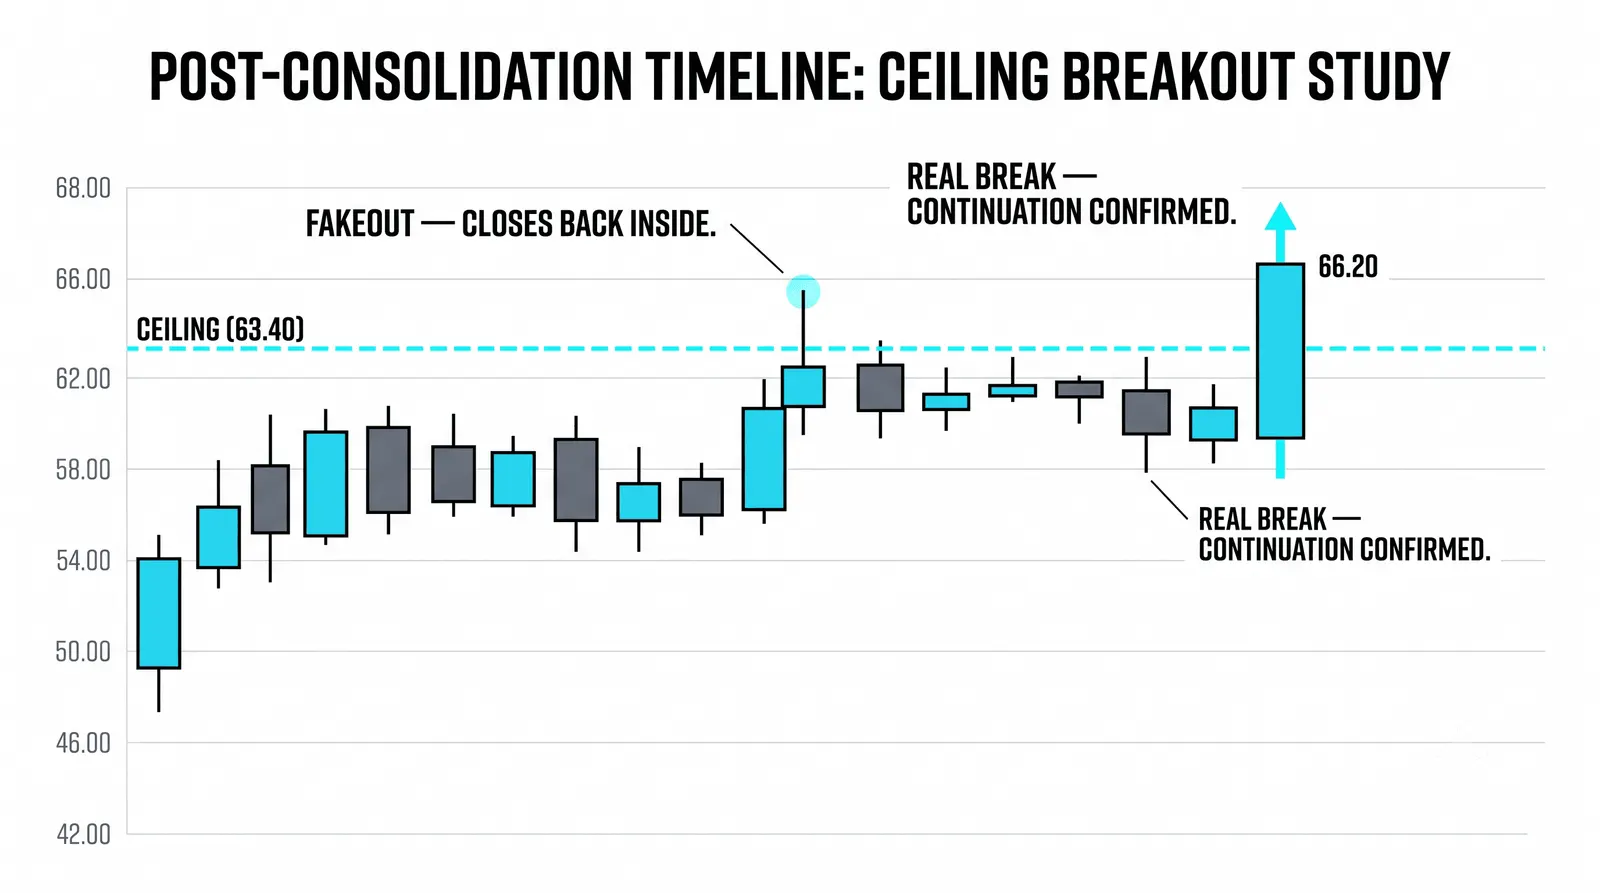
Rectangles produce traps. A wick pokes through the wall, breakout traders pile in, and price closes back inside the box. That wick is not a break. It is bait.
This is why the close matters more than the intraday extreme. A close beyond the wall means someone was willing to hold the position there. A wick means someone tried and failed.
Most lessons skip the strongest signal of all: a failed break in the opposite direction. If price breaks below support in an uptrend rectangle, traps sellers, and rips back inside, that failure tells you the floor is defended with real commitment. Upside breaks that follow such failures tend to be violent.
When a break fails, do not just shrug and move on. The failure itself is information, and often the best information the pattern will give you.
Two Ways to Trade It, Side by Side
| Approach | Entry | Stop | Target | Main Risk |
|---|---|---|---|---|
| Fading the walls | Near support or resistance touch | Just outside the wall | Opposite wall | The final touch breaks through |
| Trading the break | Close beyond the wall, or the retest | Back inside the rectangle | Box height projected from the break | False break snaps back into the range |
| Trading the failed break | Re-entry into the box after a failed break | Beyond the failed break's extreme | Opposite wall, then the eventual break | Failure was real weakness, box collapses |
None of these is universally better. Fading the walls pays often and loses big once. Trading the break pays less often and skips the chop. Pick the one that fits your temperament and your schedule, then execute it consistently.
Questions About Rectangle Patterns
What if the walls are slightly tilted?
A small tilt is acceptable as long as both walls tilt together and stay roughly parallel. If the boundaries slope meaningfully, treat it as a channel or flag instead, because those patterns carry their own continuation rates and target logic.
How many touches does a rectangle need?
Two touches of each wall is the minimum. More touches strengthen the level but also raise the odds that the next touch is the break, since every test consumes some of the orders defending the wall.
Does volume matter?
Yes. Volume should contract inside the pattern and expand on the break. A break on weak volume deserves suspicion, and a break on heavy volume deserves respect, though neither one guarantees follow-through.
What do I do when the break fails?
Exit if you are in, then reassess. A failed break back inside the box often sets up a move to the opposite wall, and a failed break against the trend is frequently the launchpad for the real continuation move.
Next, put this to work on historical charts. Find twenty rectangles that formed after clear trends, mark the walls, and record how each one resolved. That personal sample will teach you more about this pattern than any definition can.