PCE: The Fed's Preferred Inflation Gauge
Personal consumption expenditures, or PCE, measures what households actually spend each month, across a basket that adapts as spending habits change, and its core version is the Fed's preferred inflation gauge, the one it formally targets. That is why markets treat PCE day as the Fed's own report card. Every other inflation release is graded by someone else. This one is graded by the institution that sets rates, against the target it chose for itself.

Earlier in this level, you studied the CPI report in detail. CPI and PCE both measure inflation, and they often tell similar stories, but they are built differently. Think of it this way: the CPI is the menu, and the PCE is the tab that actually arrives, including the lines someone else covered. The menu lists prices. The tab shows what was really consumed and what was really paid, even when an insurer or an employer picked up part of the bill.
What PCE Actually Measures
PCE tracks actual household spending on goods and services. That sounds like CPI, but the scope is wider. PCE counts spending made on behalf of households, not only spending out of household pockets. The clearest case is medical care. When your employer's insurance plan pays a hospital bill, that payment barely registers in CPI, because CPI measures what urban consumers pay directly. PCE includes it, because the care was consumed by a household and someone paid for it.
Mechanically, PCE inflation is built as a deflator. Statisticians take total spending at current prices and compare it with the same spending valued at base-year prices. The ratio between the two is the price index. If nominal spending rises only because quantities rose, the deflator stays flat. If spending rises because prices rose, the deflator rises.
The report is published monthly, and it is revised. The first estimate uses partial source data, and later vintages fill in better information as it arrives. Annual benchmark revisions can rewrite several years of history at once. A trader quoting an old PCE print should always check whether the series has been revised since.
Core PCE vs Core CPI: Why Two Inflation Gauges Exist
Both reports publish a core version that strips out food and energy, because those categories swing on weather and geopolitics more than on domestic demand. The interesting part is why the two core readings still diverge.
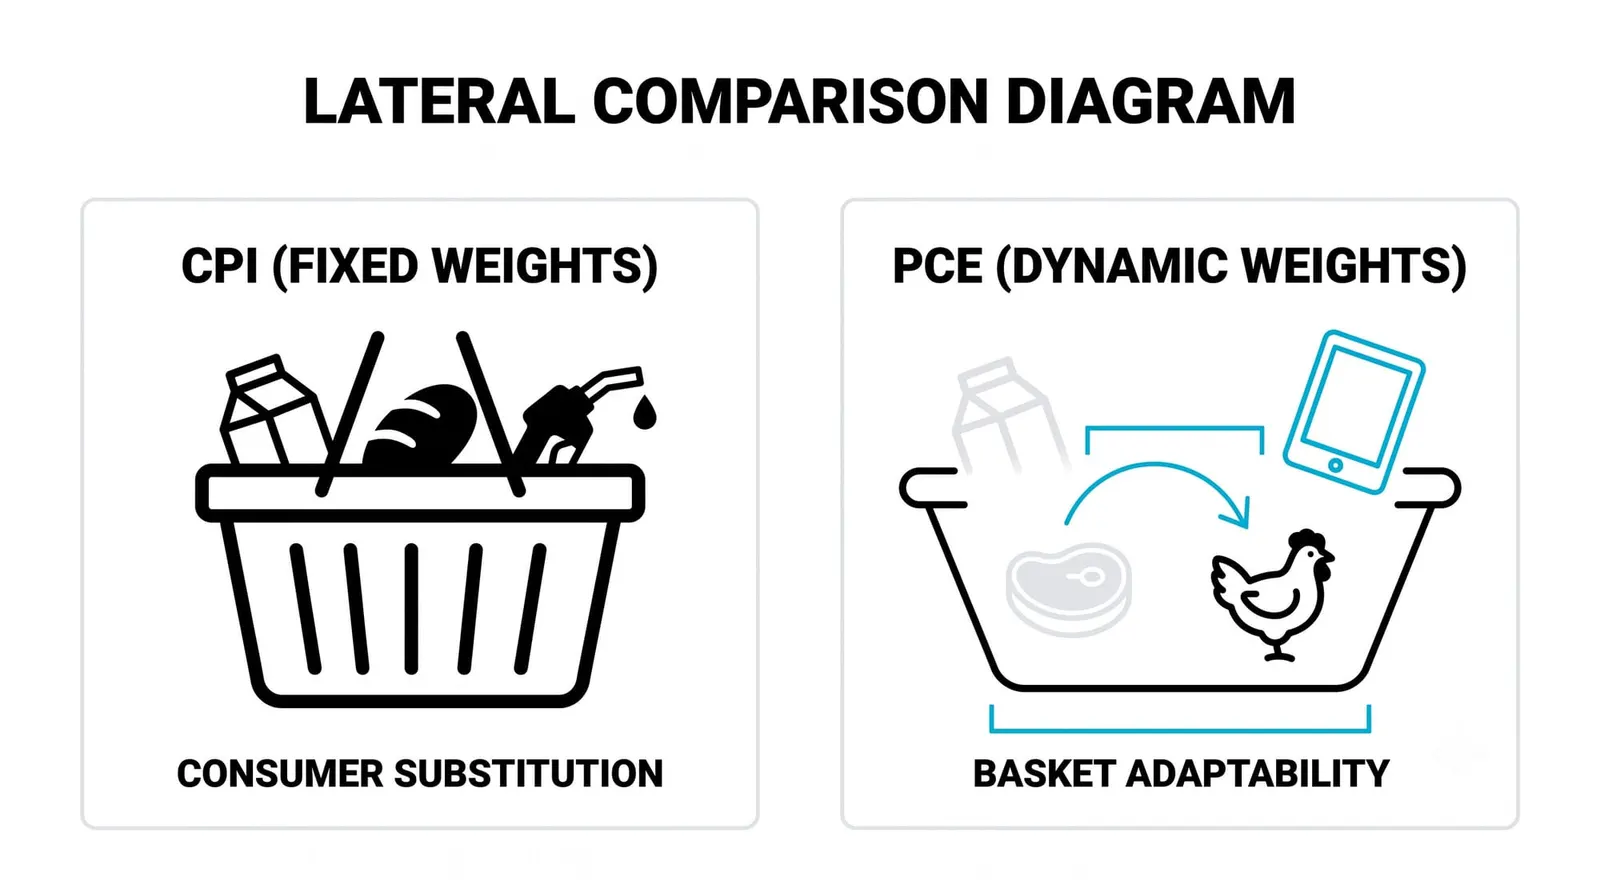
The first reason is substitution. The CPI basket holds its weights fixed for a stretch of time, so if beef becomes expensive, CPI keeps charging you the same share of beef. The PCE basket updates every month, so when shoppers switch from beef to chicken, the index reflects the switch. Statisticians call this the formula effect, and it tends to make PCE inflation run cooler than CPI over time.
The second reason is weights. Shelter carries a much larger share of CPI than of PCE. When housing costs run hot, CPI feels it harder. Medical care runs the other way: because PCE counts the bills insurers and employers pay, health services carry more weight there.
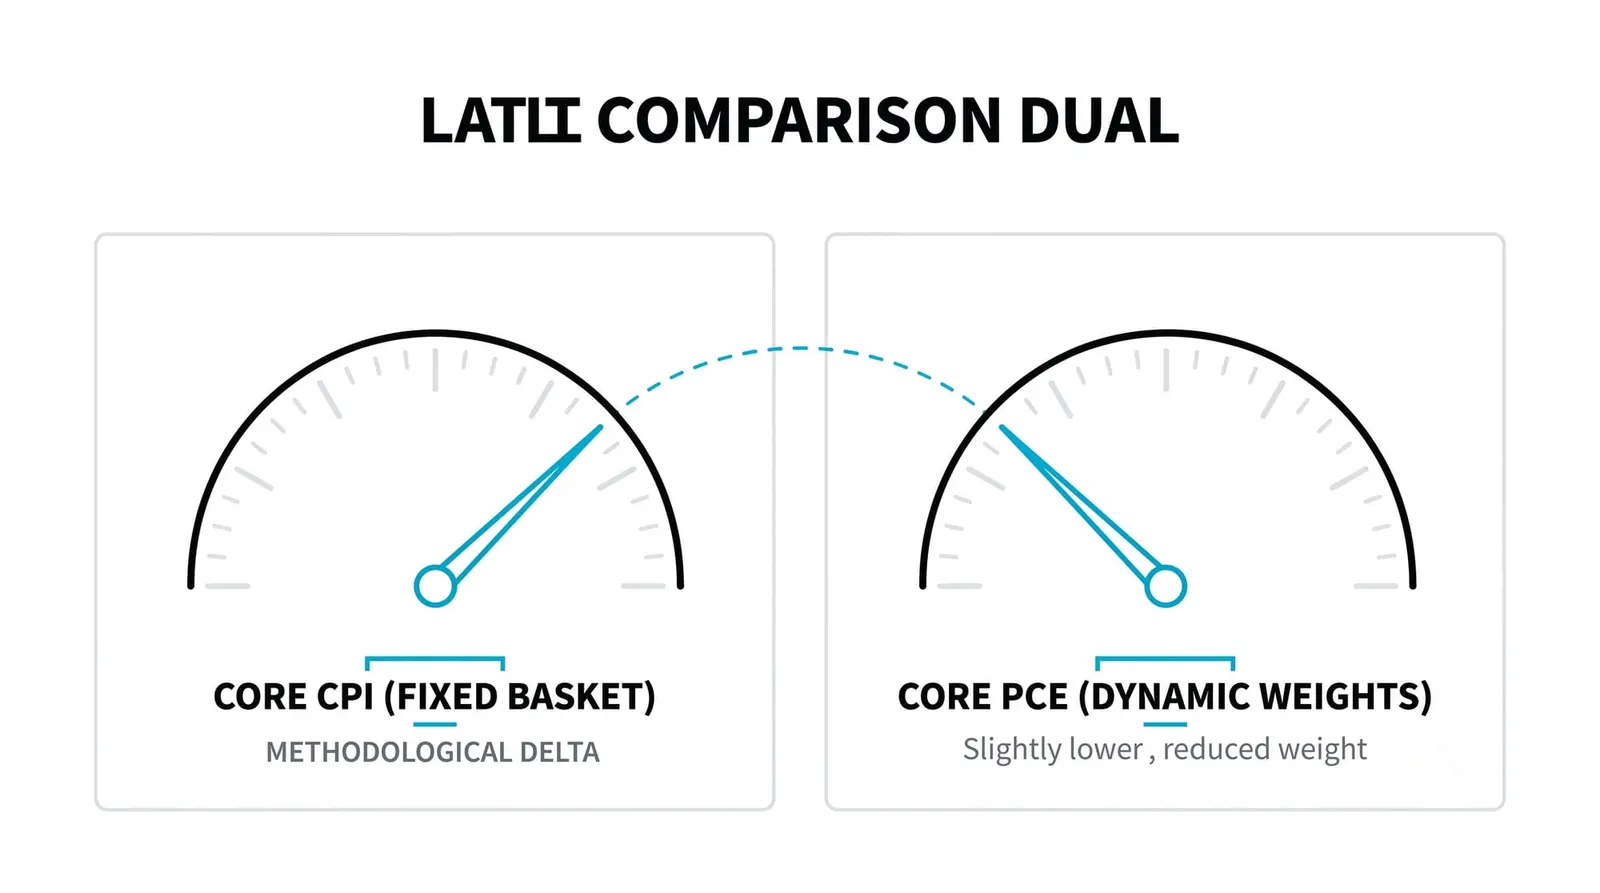
The result is that the two gauges can disagree by a few tenths of a percent for months at a stretch, and both are honest. They answer slightly different questions. CPI asks what a typical urban consumer pays out of pocket. PCE asks what the whole household sector consumed and what it cost, whoever settled the bill.
Why the Fed Leans on PCE Specifically
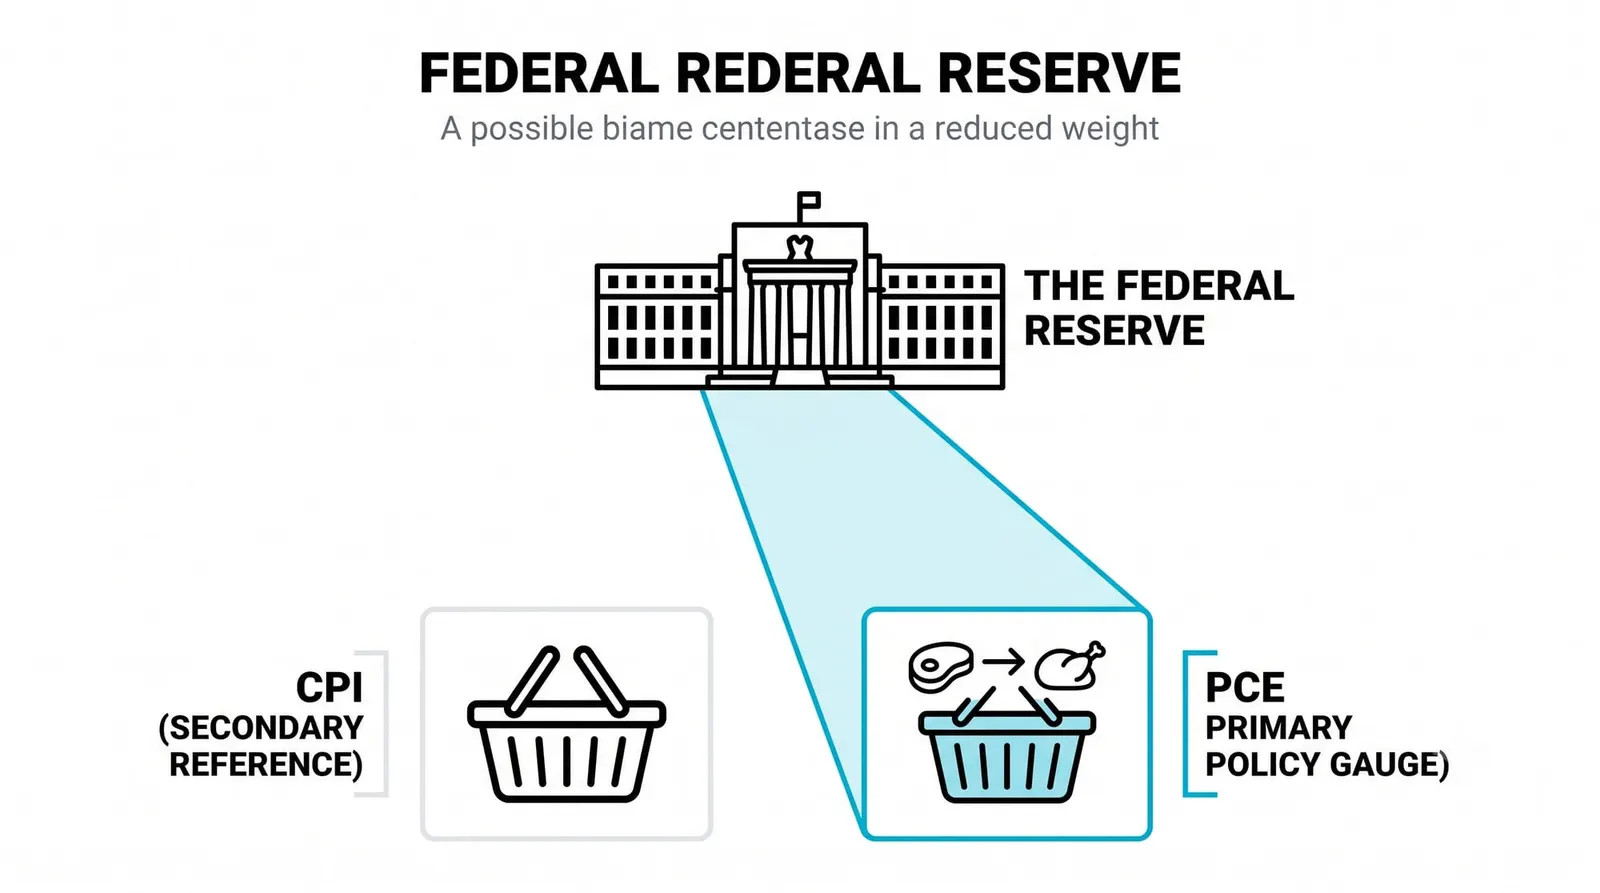
As you saw in the central bank lessons, the Fed's mandate comes with a formal inflation objective, and that objective is written as 2 percent on the PCE price index, measured over time. The target is stated in PCE terms, full stop. Core PCE gets the closest attention because it filters out the noisy categories and shows the trend the Fed believes policy can actually influence.
The logic is consistent with the construction. The Fed wants a gauge that maps to what households actually experience across the whole economy, including the big-ticket services paid on their behalf. A measure that misses most of the medical economy would miss a large slice of household cost pressure.
There is also a paperwork reason that matters to traders. The Fed's own projections, the ones published quarterly by its policy committee, are written in PCE terms. Growth, unemployment, and inflation forecasts all live in the same document, and the inflation column is PCE. When officials say inflation is moving toward target, they are reading the PCE line.
Trading Around a PCE Release
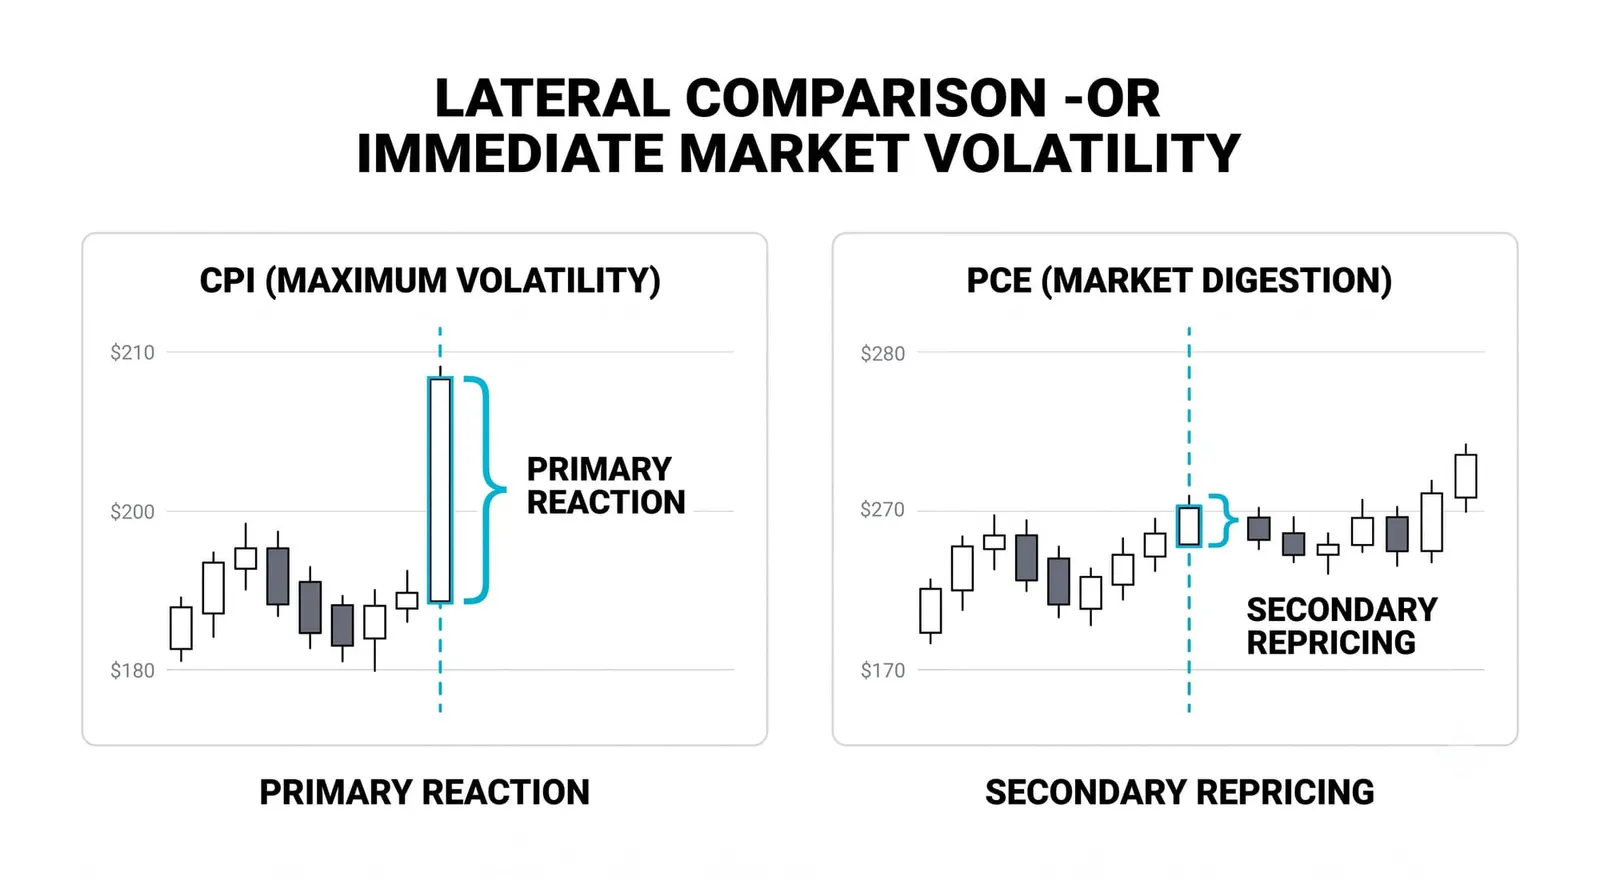
PCE day is usually quieter than CPI day, and the reason is arithmetic. By the time PCE prints, the CPI and producer price data for the same month are already public, and much of the PCE path can be estimated from those components. Forecasters often land within a tenth of the actual print. A genuinely shocking headline is rarer than on CPI day.
The surprises tend to hide in the services detail. Components like financial services, recreation, and health care draw on data that CPI does not pre-reveal cleanly. When core PCE misses expectations, the miss frequently comes from those lines rather than from the goods categories everyone already saw.
Timing matters too. When the release lands close to a quarterly Fed projection update, traders read it as the last data point before officials pencil in new forecasts, and reactions get sharper. How those projections feed into rate decisions and how to trade them is covered later in this level. For now, hold one blunt rule: the Fed trades on its own gauge, and so does everyone who trades the Fed.
Two Gauges, One Economy
Suppose, purely as an illustration, that core CPI prints 3.4 percent year over year in a quarter while core PCE prints 3.0 percent over the same stretch. Both numbers are invented round figures. The question is how they can both be true.
Start with substitution. Imagine rent and dining out both rose sharply during the quarter. Households responded by eating out less and shifting to cheaper groceries. The CPI basket kept the old dining-out weight, so the price surge kept hitting the index at full force. The PCE basket updated monthly and gave the shrunken restaurant spending a smaller role. Same economy, smaller measured inflation.
Now the weights. Say shelter costs climbed 5 percent. Shelter might represent roughly a third of the CPI basket but a noticeably smaller share of PCE, so the same housing inflation contributes more to the CPI print. Meanwhile, medical services stayed calm, and because PCE counts the full medical bill that insurers and employers pay, that calm pulled PCE down more than it pulled CPI.
Now the trading read. A core CPI at 3.4 percent fuels headlines about sticky inflation, and rate-cut expectations might drift further out on the calendar. Then core PCE prints at 3.0 percent, and the market partially re-prices, because the Fed's target and projections are written in PCE terms. The CPI number shaped the mood. The PCE number shaped the policy math. When the two disagree, the building that sets rates reads its own line first.
| Feature | CPI | PCE |
|---|---|---|
| Basket | Fixed for stretches; updated on a set schedule | Updates monthly as spending shifts |
| Formula | Out-of-pocket prices paid by urban consumers | Deflator: current-price spending vs base-year prices, including third-party payments |
| Shelter weight | Large, roughly a third of the index | Noticeably smaller share |
| Fed target | Not the targeted gauge | The formal 2 percent target is written on this index |
The PCE Report, Answered
Why does the Fed prefer PCE over CPI?
Because PCE covers the full scope of household consumption, including spending made on households' behalf, and its basket adapts as people change what they buy. The Fed judged that this better reflects the inflation households actually experience, and it wrote its 2 percent target on that index.
Why is PCE usually lower than CPI?
Mainly because the PCE basket updates monthly, so it captures substitution toward cheaper goods, while the CPI basket holds still. Shelter's smaller weight in PCE also softens the index when housing costs run hot. The gap is structural, not a sign that either report is wrong.
How often is PCE released?
Monthly, as part of the personal income and outlays report. Each release covers the prior month's spending, income, and price data, with headline and core readings.
Can PCE figures revise?
Yes. Initial estimates rest on partial source data and get revised in later months, and larger annual revisions can restate several years at once. Always check the latest vintage of the series before using an old print in your analysis.
Your next step in this level is connecting this gauge to the decisions it feeds: how the Fed's projections, the policy statement, and the press conference turn a PCE trend into a rate path, and how to position around those events without chasing the first move.