Multi-Timeframe Fibonacci
Multi-timeframe fibonacci is the same ratio work run on the swings of two timeframes at once: the larger swing of the higher chart and the smaller swing of the lower chart. When a retracement line from each lands at the same price, that overlap is the strongest grade a zone can carry. Every other tool in this course measures one chart. This practice measures two and asks whether they agree.

Think of a wall clock and a wristwatch: the big one sets the day's plan, the small one confirms the moment, and when both show the same hour the timing is right. The higher chart is the wall clock. The lower chart is the wristwatch. Neither replaces the other, and the trader who checks only one is working with half the information.
The structure lesson joined the measured line to the structure lines on a single chart. This lesson lifts the same practice between charts. The higher timeframe grades the zones. The lower timeframe trades them.
The Higher Chart Owns the Zone
The higher timeframe owns fewer, heavier swings. A daily swing of ten points contains dozens of four-hour swings inside it, and the retracement lines drawn from that daily swing mark the prices the larger crowd watches. Funds, position traders, and patient money work from daily and weekly charts. Their orders cluster at their lines.
The lower timeframe owns the entries. Its swings are smaller and more numerous, and its retracement lines mark where its own faster crowd joins. That crowd is quick but thin. Its lines alone carry less weight.
The practice is ordered, and the order matters. Draw the higher timeframe's swing first and mark its lines. Then draw the lower timeframe's swing and mark its lines. Then look for the overlap. The higher timeframe's line defines the zone. The lower timeframe's line times the join. Reversing that order means letting the fast chart decide what matters, and the fast chart decides wrong too often.
Fibonacci cluster practice runs the same market on every timeframe it trades. The 240-minute chart and the daily chart each contribute the swings that stand out on that chart, and the analysis repeats unchanged per timeframe. No special treatment, no adjusted ratios. Same method, two charts, then the comparison.
The price action canon supplies the reason the alignment carries weight. The higher timeframe's crowd is larger and slower. When the lower timeframe's measurement lands where the larger crowd already acts, the entry joins the deeper flow of orders rather than a passing ripple of fast money.
Finding the Alignment
Start on the higher chart with nothing drawn. Pick the dominant swing, the one that defines the current leg, and run the retracement. Write down the prices of its lines. Then drop to the lower chart, pick its dominant swing, and run the same retracement there. Keep the two sets of lines separate in your notes before you compare them.
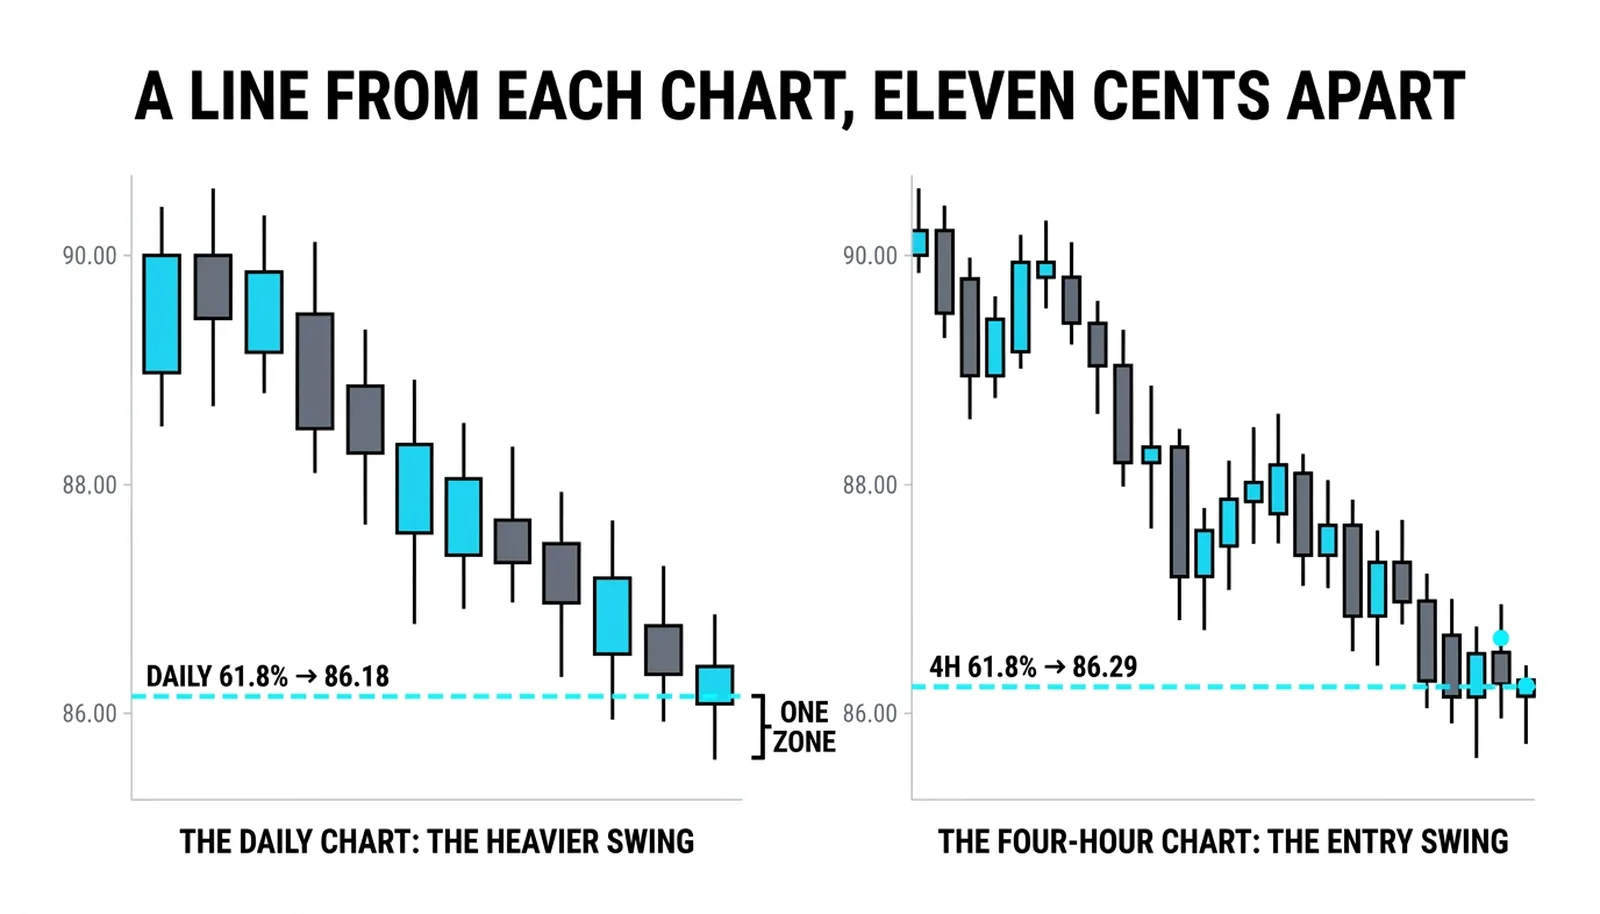
The overlap test is simple. A line from the higher chart and a line from the lower chart sit within a narrow band of each other, a few ticks or cents depending on the instrument. That band is the zone. It does not need to be exact to the tick. Two lines eleven cents apart on an eighty-dollar instrument are one zone, not two.
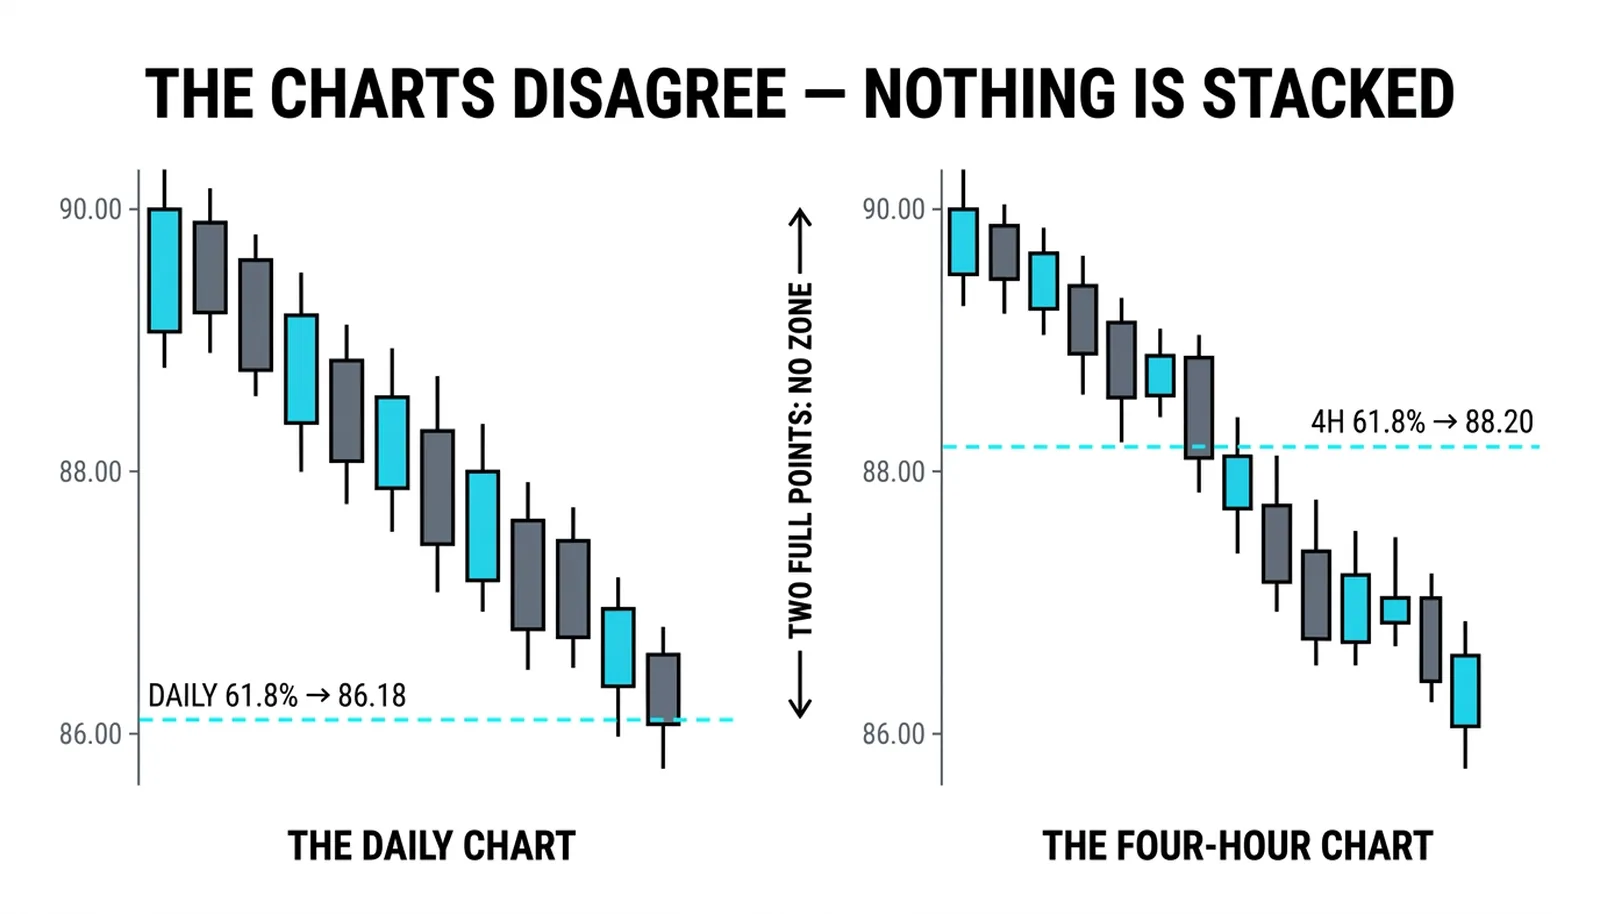
Here is the honesty, and it deserves a blunt sentence. Two timeframes can disagree forever. Most of the time, they do. The trader who redraws swings until the charts agree has manufactured the same false stack the stacking lesson warned about. The alignment is found, never fitted. If no overlap exists, the answer is no trade, not a different swing choice.
A useful habit: check the higher chart once per session, not once per bar. Its swings change slowly. Redrawing them constantly invites the temptation to nudge a swing until it agrees with the lower chart. Fix the higher chart's lines, then let the lower chart do its faster work underneath them.
Trading the Aligned Zone
The entry happens on the lower chart. Price pulls back into the zone, the lower timeframe shows the turn, and the trade is taken on that turn. The higher chart contributed the location. The lower chart contributes the moment. Each chart does the job it is built for.
The stop goes below both lines, beyond the far edge of the zone. If the zone is real, price should not trade through it. A stop inside the zone is a stop inside the very area the thesis says will hold, which makes no sense. Give the zone room to do its work or skip the trade.
The failure belongs to the higher chart. A daily close below both lines ends the larger crowd's defense of the zone, and the four-hour agreement dies with it. The lower chart never overrides the higher chart's read on the zone. It only chooses the moment, and the moment is worthless once the zone itself has closed. Traders who hold through a higher-timeframe close against the zone are no longer trading the alignment. They are trading hope with a fibonacci label on it.
The Zone at 86.18
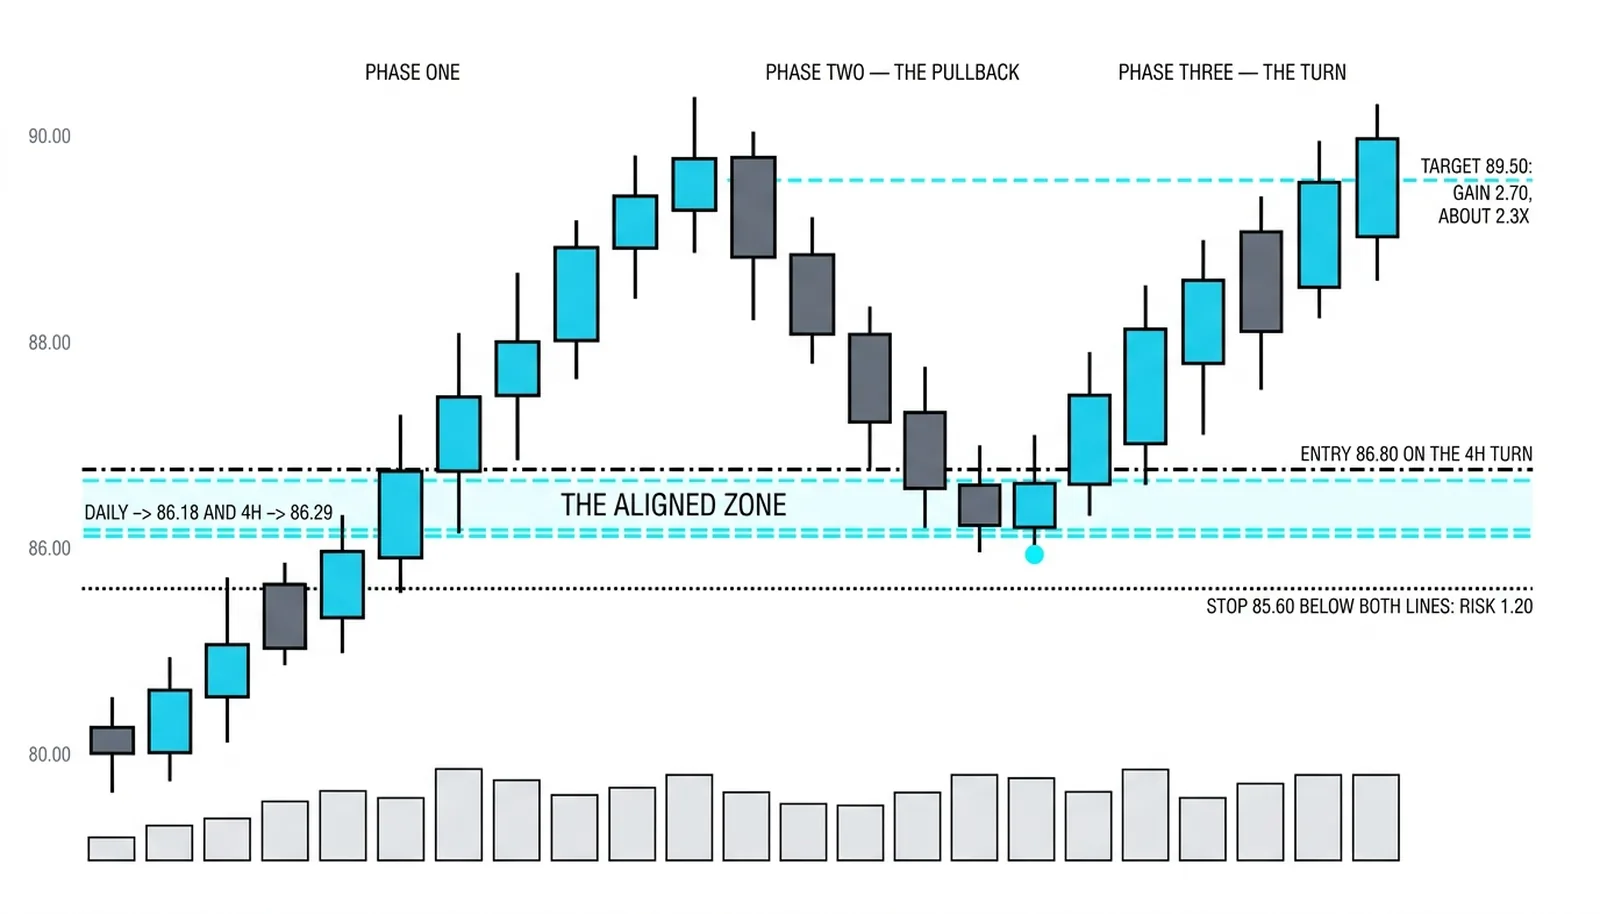
A hypothetical example with round numbers. The daily chart shows a clean swing from 80.00 to 90.00, ten points. Its 38.2 percent retracement line sits at 86.18. That is the higher timeframe's contribution, the price the larger crowd watches.
The four-hour chart shows its own swing from 84.00 to 90.00, six points. Its 61.8 percent retracement line sits at 86.29. The two lines overlap in a zone running from 86.18 to 86.29, eleven cents wide. Two independent measurements, two different crowds, one price band.
Price pulls back to 86.25 on the four-hour chart, inside the zone, and turns. The long is taken at 86.80 on the turn. The stop sits at 85.60, below both lines, risking 1.20. The first target is 89.50, just under the old high at 90.00, for a gain of 2.70. That is about 2.3 times the risk, a clean trade built entirely from the overlap.
The failed version: price closes the daily at 85.70, below both lines. The larger crowd's defense of the zone is over. The four-hour agreement dies with it, no matter how pretty the lower chart's turn looked an hour earlier. The zone closed, so the trade idea closed.
| Timeframe | Swing It Owns | Line It Contributes | Weight It Carries |
|---|---|---|---|
| Daily | 80.00 to 90.00 | 38.2 percent at 86.18 | Defines the zone; its close ends the trade |
| Four-hour | 84.00 to 90.00 | 61.8 percent at 86.29 | Confirms the zone; times the entry |
| Daily | The dominant leg | The heavier line | The larger, slower crowd |
| Four-hour | The smaller leg inside it | The faster line | The quick crowd that joins |
Timeframe Questions, Answered
What is multi-timeframe fibonacci?
Multi-timeframe fibonacci is the practice of running the same retracement ratios on the swings of two timeframes and looking for a line from each to land at the same price. The higher chart's swing supplies its lines, the lower chart's swing supplies its lines, and the overlap of one line from each forms the highest-grade zone the method can produce.
Which timeframes should you combine?
Combine the timeframe you trade with the next meaningful one above it, typically a ratio of four to six between them. A four-hour chart pairs naturally with a daily chart; an hourly chart pairs with a four-hour. Gaps that are too small make the two charts redundant. Gaps that are too large disconnect the entry from the zone.
What if the timeframes disagree?
If the timeframes disagree, there is no trade, and that is the correct outcome. Disagreement is the default state of two independent charts. The mistake is redrawing swings until agreement appears, which manufactures a false stack. Wait for a genuine overlap or stay out.
Does the higher timeframe always win?
Yes, on the question of the zone, the higher timeframe always wins. Its close beyond the zone's lines ends the idea regardless of what the lower chart shows. The lower chart's only authority is timing: it chooses the moment of entry inside a zone the higher chart has already validated.
The ratios have now left the single chart and started working across frames. Next, they leave the price axis entirely: the same proportions applied to bars, windows, and cycles, where the question shifts from where price will react to when.