What Is Fibonacci Time Analysis
Fibonacci time analysis is the ratio work moved to the chart's horizontal axis: the same ratios that measured the legs in dollars now counted in bars. Where price analysis answers where the market will react, time analysis answers when. The swing high and low still get measured, but the measurement is a count of candles, and the projections land on future bars rather than future prices.

Think of it as a train timetable, which says when the train is due and nothing about what the station looks like, the schedule drawn before the journey and checked against the clock as the journey runs. The schedule proposes a moment. The market decides whether anything happens at that moment. That split between proposing and deciding is the discipline itself, and this lesson keeps it in view from the first count to the last trade.
The multi-timeframe lesson graded zones by chart, stacking daily levels against hourly levels to see which ones carried the most weight. This lesson leaves the price axis entirely. The ratios stop counting dollars and start counting bars, and the question changes from where the market will react to when.
Counting Bars Instead of Dollars
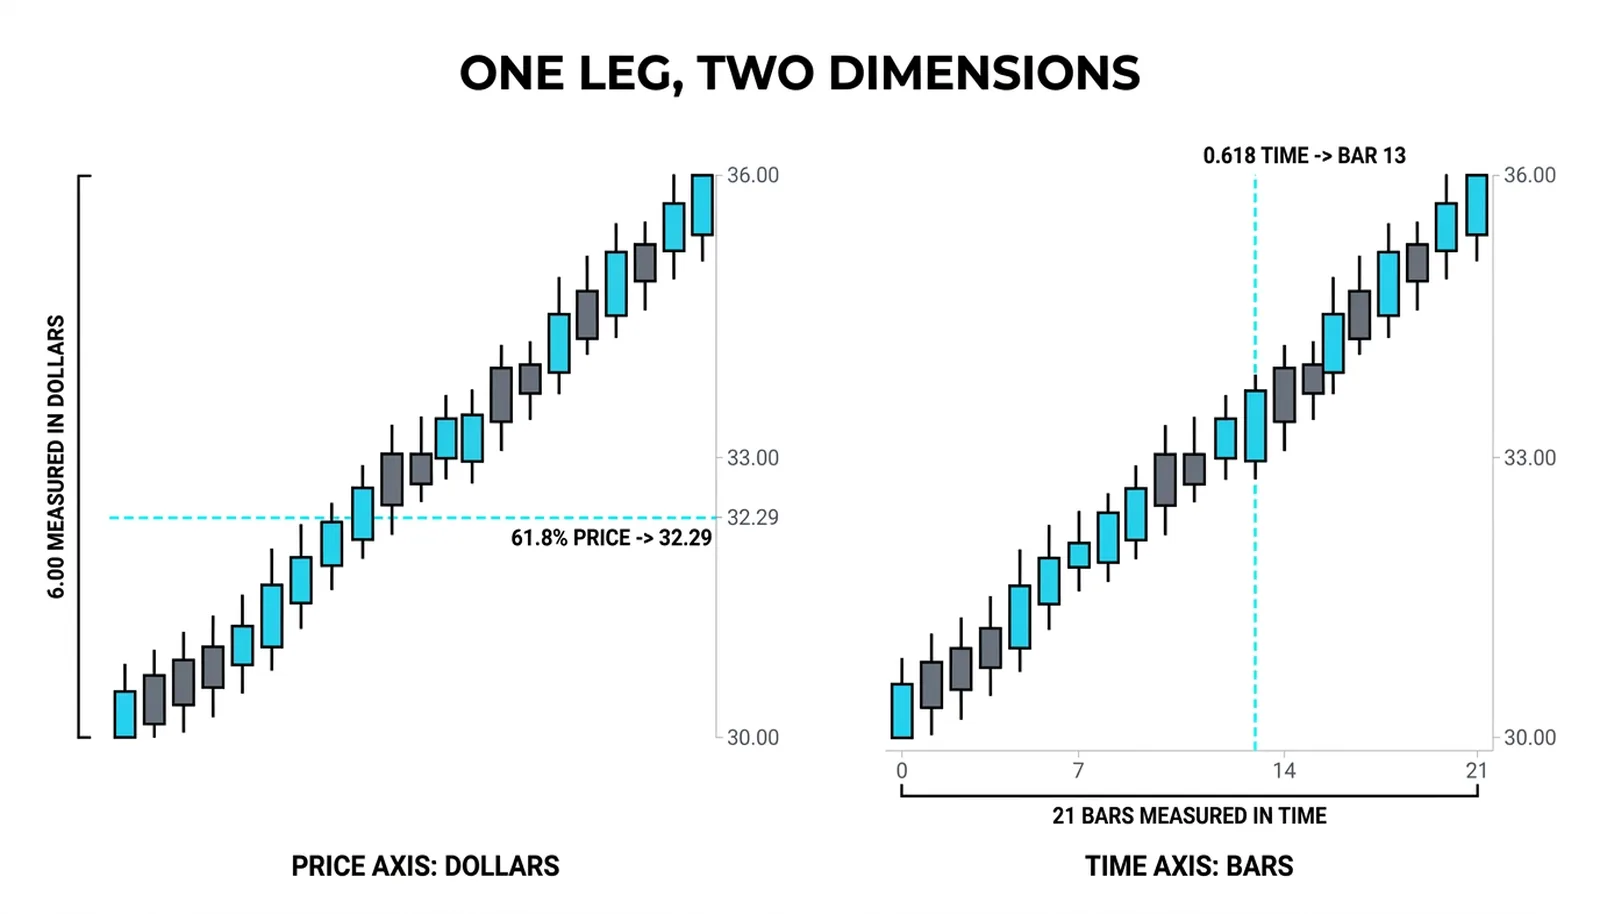
Start with a leg measured twice. On the price axis, the leg runs from 30.00 to 36.00, a six-dollar move, and the retracement work marks its lines: 61.8 percent of the leg sits at 32.29, and the other ratios fall where they fall. That is the familiar half of the method, and nothing about it changes here.
Now measure the same leg on the horizontal axis. Count the candles from the low at 30.00 to the high at 36.00. Say the count comes to twenty-one bars. That number is the time-axis equivalent of the six-dollar range, the raw material every projection is built from.
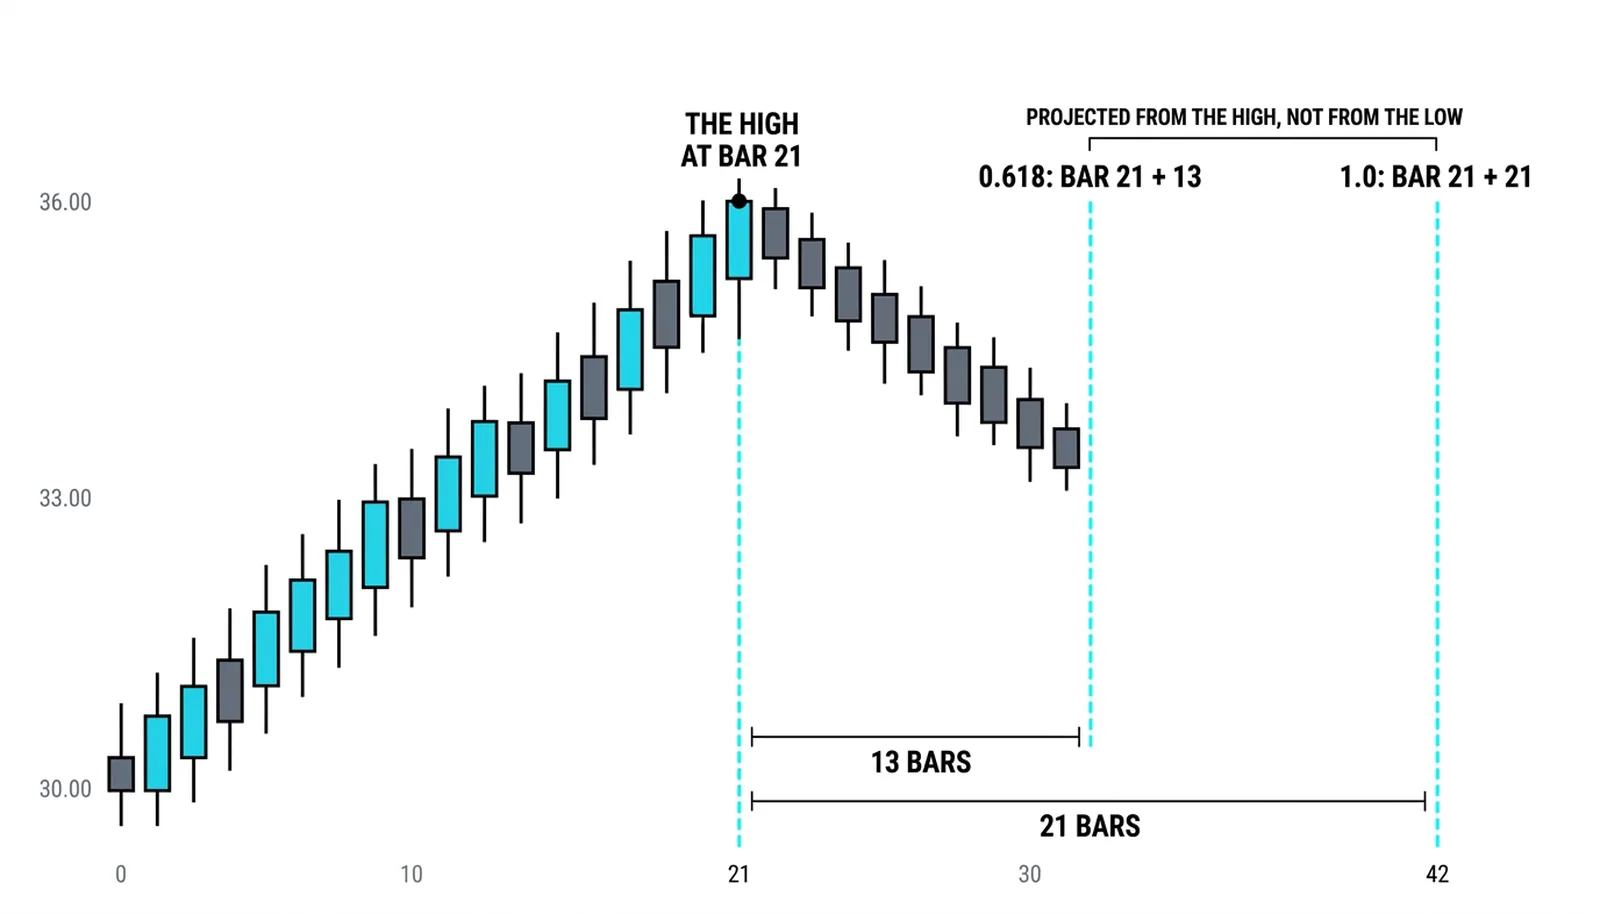
The projections are ratios of the count, taken forward from the swing's end. From the high at bar twenty-one:
- 0.618 of twenty-one is thirteen bars, the first minor window.
- 1.0 of twenty-one is twenty-one bars, the symmetric projection.
- 1.618 of twenty-one is thirty-four bars, the extended projection.
Each projection marks a bar, and a bar is a place on the calendar. Count thirteen bars forward from the high and mark it. Count twenty-one and mark it. Count thirty-four and mark it. Those marks are the windows, the stretches of the chart where a turn is statistically more interesting than on any random bar.
The cluster method applies the same ratios to the time axis that the price work already uses, and fibonacci cluster practice treats a single projected window as a candidate and a clustering of windows from different swings as the standout. When the thirteen-bar projection from one leg lands within a bar or two of the twenty-one-bar projection from a larger leg, the overlap is the signal. One window is a suggestion. Two windows landing together is an appointment.
The counting itself is mechanical, which is the appeal. No judgment enters until the window arrives. The leg either took twenty-one bars or it did not, the arithmetic either produces thirteen or it does not, and the marked bar sits on the chart whether the trader feels bullish or not. The subjectivity that poisons so much chart work gets squeezed out at the measurement stage.
What a Window Can and Cannot Say
A bar carries no price. That sentence deserves to stand alone, because everything honest about this method follows from it. The thirteen-bar window says the market has reached a moment where a turn is more likely. It says nothing about the level where that turn would happen, nothing about direction, nothing about size.
The price action canon supplies the caution that keeps the method grounded: every measured projection is a proxy for orders, but orders sit at prices, so a time window acts only through the price locations it happens to reach. A window that arrives while price floats in the middle of nowhere, far from any retracement line or prior level, is a clock striking in an empty room. The moment passes and nothing answers it.
The coordination is the point. The window arriving while price sits at a retracement line is the setup this entire lesson builds toward. Time proposes the moment, price proposes the location, and the trade exists only where the two proposals overlap. Strip either half away and what remains is a calendar or a ruler, each useless without the other.
The sideways drift is the outcome nobody advertises. A market can arrive at its window and simply go quiet, sliding sideways through the marked bars without turning and without breaking anything. That is not the method failing. That is the market declining the proposal, which it does regularly. The window that passes without a turn is one candidate retired, not a method broken, and the correct response is to unmark the bar and wait for the next count.
Time analysis grades attention and schedules the watch. It tells the trader which bars deserve full focus and which bars can be ignored, and that alone has value even when no trade follows. A method that narrows twenty bars of noise down to three bars of interest has done real work, because attention is the scarcest resource on a trading desk.
Trading the Window and the Line
The trade requires both measurements to arrive together. The window supplies the when, the retracement line supplies the where, and the entry waits for price to confirm inside the overlap. No confirmation, no trade, no matter how elegant the count looks.
Entry mechanics stay simple. Price pulls back into the retracement line during the marked window, a reversal candle forms and closes, and the position is taken on that close or just beyond it. The stop goes below the line and below the window's low, because a market that trades under both has rejected the setup on both axes at once. Targets project back toward the prior extreme or to the next measured objective.
The failure mode teaches the most. The window arrives on schedule, the count was perfect, and the market closes straight through the line. The schedule was kept and the trade is dead. Time proposed the moment and price declined it, and that outcome is not a flaw in the arithmetic. It is the arithmetic doing its one job, which is proposing, while the market keeps its right to refuse.
Neither measurement carries the trade alone. A trader who buys every window without a price level is trading a calendar. A trader who buys every line without a window is trading a ruler. The method pays only where the calendar and the ruler agree, and the discipline is refusing every setup where one half shows up without the other.
The Window at Bar Thirteen
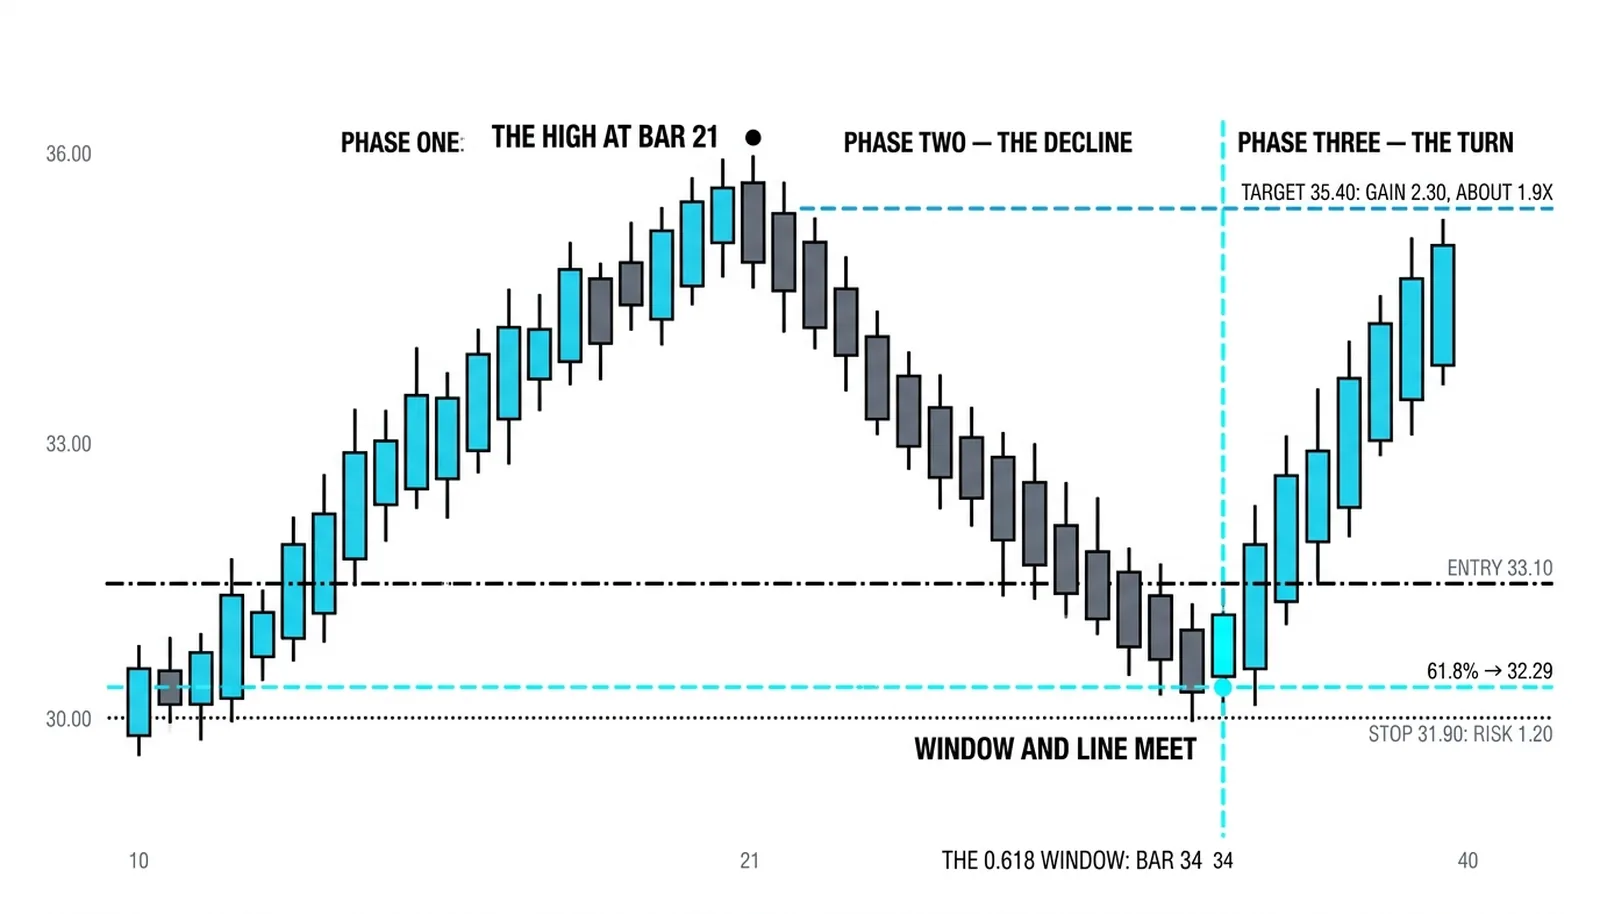
Here is the full sequence with round numbers, all hypothetical. The leg runs from 30.00 to 36.00 and takes twenty-one bars to do it. The price-axis work marks the 61.8 percent retracement line at 32.29. The time-axis work projects 0.618 of the twenty-one-bar count forward from the high, landing on the thirteenth bar after the peak.
The market pulls back. As the thirteenth bar arrives, price is trading at 32.40, sitting just above the 32.29 line, inside the window. A reversal candle forms and closes at 33.00. The long is taken at 33.10 on that close.
The stop goes at 31.90, below the retracement line and below the window's low at 32.10. The risk is 1.20 per share. The first target is 35.40, just under the prior high, a gain of 2.30 per share. That is about 1.9 times the risk, a clean asymmetric trade built from one count and one line.
Now the failed version, same numbers. The thirteenth bar arrives on schedule, price touches the area near the line, and then the market closes at 31.80, straight through 32.29. The window was kept and the trade never existed, because the reversal candle never formed and the close broke the level. The count was right and the trade is dead anyway. That is the honesty this method demands: time proposed, price declined, and the flat position is the correct result.
| The measurement | What it counts | What it projects | What it cannot say |
|---|---|---|---|
| Price retracement | Dollars in the leg | Levels where a turn may happen | When the turn will come |
| Time projection | Bars in the leg | Windows where a turn is more likely | The price of the turn |
| Clustered windows | Counts from multiple swings | The standout moments on the calendar | Direction or size of the move |
| The combined setup | Bars and dollars together | Entry, stop, and target in one structure | Certainty that the turn will happen |
Time Analysis Questions, Answered
What is fibonacci time analysis?
Fibonacci time analysis is the application of the Fibonacci ratios to the horizontal axis of the chart, counting the bars in a swing and projecting ratios of that count forward from the swing's end. The projections mark future bars where a change in trend is more likely. The method answers when, and leaves the question of where to the price work.
How is time analysis different from price analysis?
Price analysis measures a move in dollars and marks levels; time analysis measures the same move in bars and marks moments. A retracement line says where a reaction may occur and stays valid until price breaks it. A time window says when a reaction is more likely and expires as the marked bars pass. The two tools measure different axes of the same leg and are strongest when used together.
Which ratios work on the time axis?
The same ratios used in the price work: 0.382, 0.618, 1.0, 1.618, and 2.618, applied to the bar count of a completed leg. The 0.618 and 1.0 projections tend to draw the most attention as single windows, and clusters form when projections from different swings land within a bar or two of each other. The cluster matters more than any single ratio.
Can time analysis be used alone?
No, and the reason is structural: a bar carries no price, so a window can propose a moment but never a level. Used alone, time analysis produces a calendar of interesting bars with no entry, no stop, and no target attached. The window earns its keep only when price arrives at a real level inside it, which is why the method belongs alongside the retracement work rather than in place of it.
The next lesson takes the time axis further, from single-leg projections into cycles: counting the spacing between lows and between highs to find the rhythm a market keeps repeating, and learning when that rhythm deserves trust and when it is just noise wearing a pattern.