The Key Fibonacci Ratios, Explained
The fibonacci ratios every chart tool draws are five: 23.6 percent, 38.2 percent, 50 percent, 61.8 percent, and 78.6 percent. Each one marks a fraction of a prior price move, and the tool plots them as retracement levels the moment you anchor it to a swing. Four of the five are direct arithmetic descendants of the golden ratio, and the fifth earned its seat through a century of observed behavior rather than mathematics.

Think of the family as a set of gears cut from one cog, every gear a different size, all of them turning at speeds fixed by the same original teeth. One source, five outputs, each related to the others by the same underlying constant. That is why the levels cluster and echo each other on a chart instead of scattering at random.
Earlier lessons built the Fibonacci sequence itself and introduced 1.618 and its inverse. This lesson lays out the working family those lessons produce, the five numbers every retracement tool ships with, and shows exactly where each one comes from.
One Cog, Five Wheels
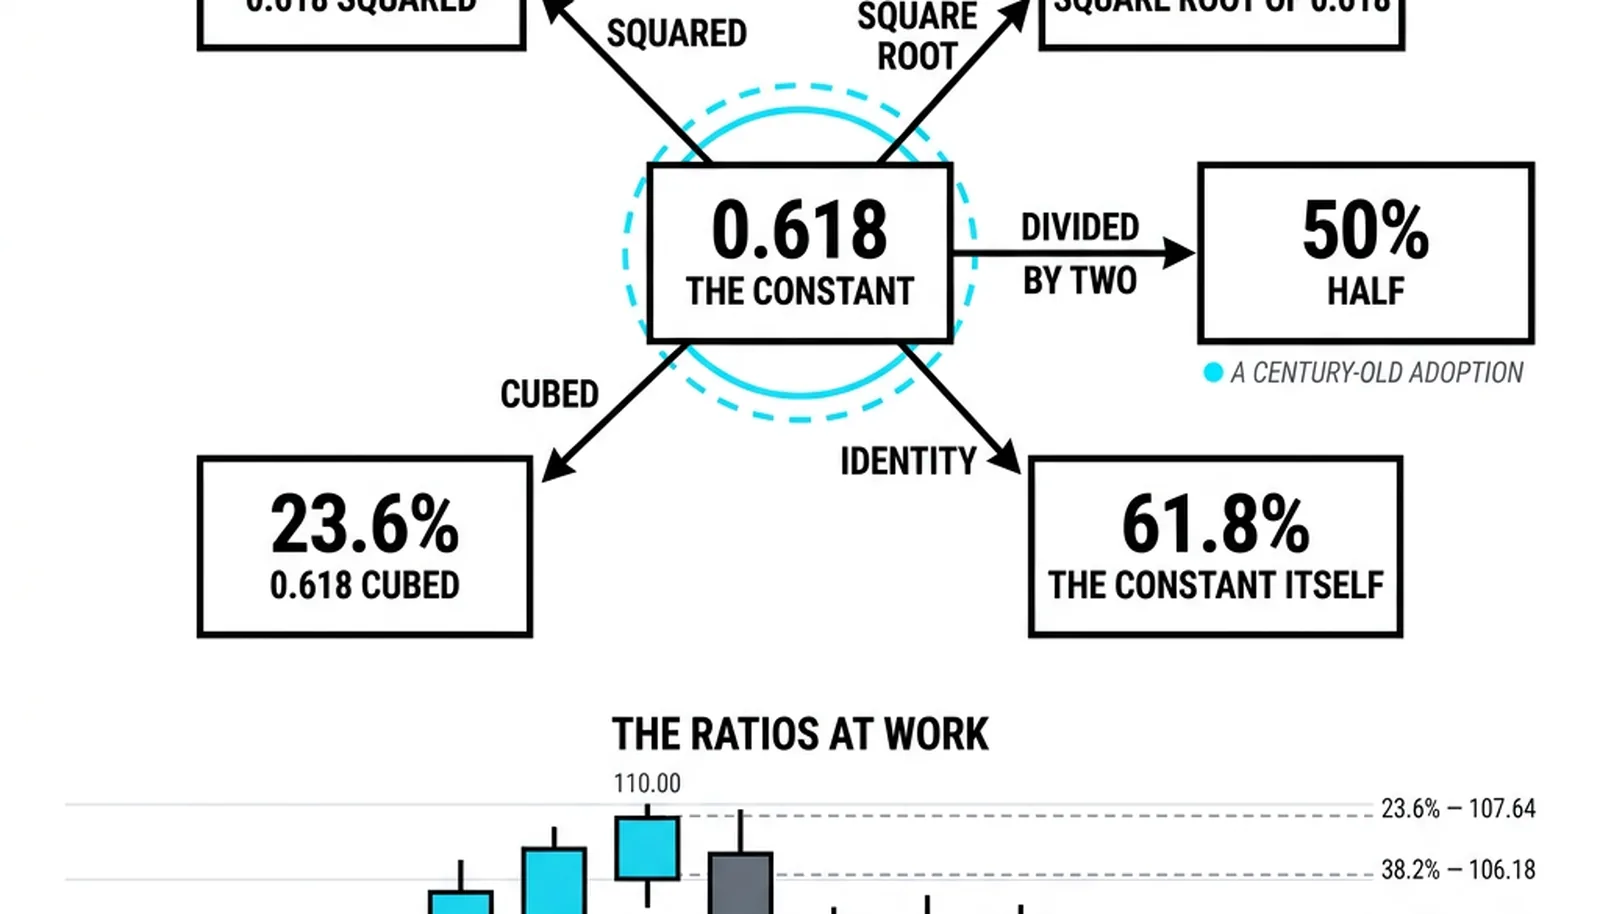
Start with the golden ratio, 1.618. Its inverse, 1 divided by 1.618, gives 0.618. That is the 61.8 percent level, the most watched of the five, and the anchor of the whole family.
Square that inverse and you get the next member. Multiply 0.618 by 0.618 and the result is 0.382, the 38.2 percent level. The same number falls out of plain subtraction: 100 minus 61.8 equals 38.2. Two different paths, one answer, which is part of why chartists trust it.
Cube the inverse and the family gets its shallowest member. Multiply 0.618 by itself three times and you land near 0.236, the 23.6 percent level. This is the line of trends so strong that the counter-move barely stirs before the dominant side resumes.
The deepest member comes from a square root. Take the square root of 0.618 and you get roughly 0.786, the 78.6 percent level. This is the last station before the prior swing point itself is in danger. A retracement that reaches 78.6 percent has handed back nearly everything, and the trend's survival is an open question.
Then there is the 50 percent level, the most famous of them all, and it is not a Fibonacci ratio at all. It is plain division in half. It sits in every toolkit because half-retracements happen constantly, and because chartists watched them for decades before Fibonacci tools existed. The toolkit inherited the halfway line from Dow-era practice, not from de Pisa's series. Treat it as an adopted member: respected, useful, and honest about its origins.
The cluster method treats this family as one system rather than five separate curiosities. In that framing, the arithmetic matters less than the relationships: each level is a different depth of the same question, which is how much of the prior move the counter-trend side can reclaim.
What Depth Signals
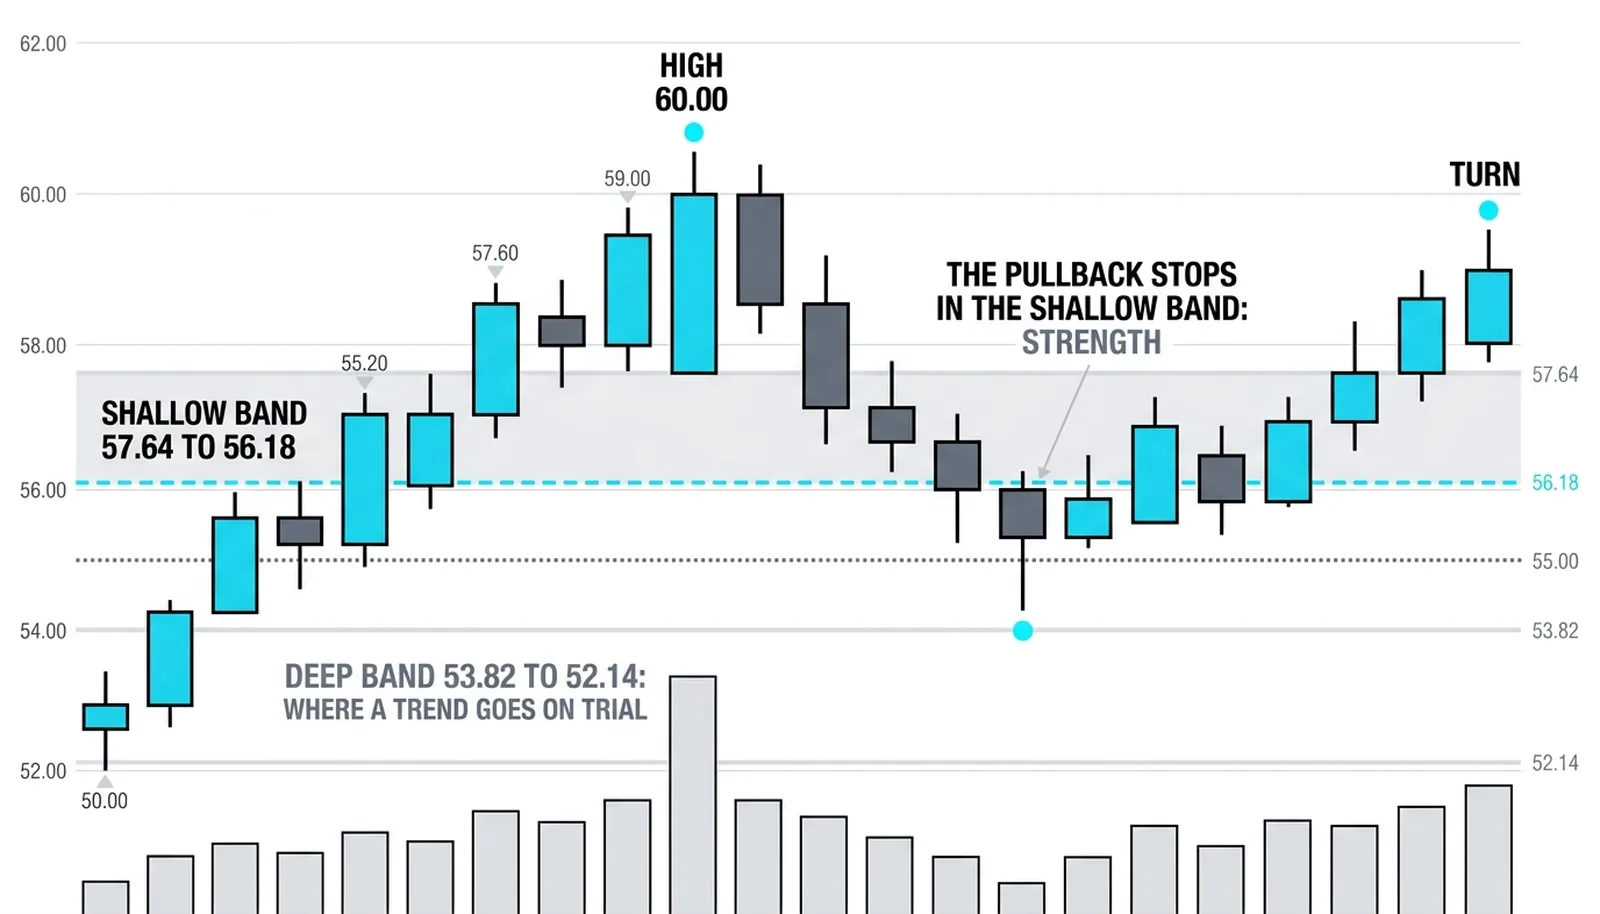
The family splits into two camps, and the split carries the trading meaning. The shallow pair, 23.6 and 38.2 percent, belongs to confident trends. When a pullback stalls in that zone, the dominant side barely yielded anything. Buyers or sellers in control barely blinked, absorbed the counter-move, and resumed.
The deep pair, 61.8 and 78.6 percent, belongs to trends under test. A pullback reaching 61.8 percent has erased most of the prior leg. One reaching 78.6 percent has erased nearly all of it. The trend may still survive, but the burden of proof has shifted.
The 50 percent line sits between the camps, a border post rather than a member of either. A hold at the halfway mark is neutral-to-healthy. A slice through it on heavy selling tells you the shallow-trend story is probably finished.
The ordering matters more than any single line. A trend that keeps holding its pullbacks at 38.2 percent is telling you something different, week after week, than a trend whose pullbacks keep reaching 61.8. Depth is a running measure of conviction. Watch how the depth changes across a trend's life and you get an early read on fatigue long before the trend actually breaks.
Shallow retracements signal strength. Deep retracements signal strain. That single sentence is the working core of the whole family.
Reading the Gauge, Not Five Predictions
The practical discipline is to treat the five lines as one depth gauge, not five independent forecasts. The question is never "will price reverse at exactly 61.8 percent." The question is "how deep did the counter-move get before the dominant side responded, and what does that depth say about who holds control."
A pullback that stalls at 38.2 percent lets a trader believe the trend is healthy and the counter-move was routine profit-taking. A pullback that slides through 50 percent and keeps going forces a downgrade: the trend may still be intact, but confidence should drop with each deeper line it visits. A pullback that reaches 78.6 percent lets a trader believe almost nothing except that the next few bars will decide the argument.
Now the honesty, stated plainly. No single line owns the turn. Price blows through levels, pauses between them, reverses three ticks before them, and pokes through them before snapping back. The space between two adjacent lines is where a great deal of the actual decision-making happens, and the lines mark the boundaries of those zones rather than laser-precise reversal points.
The 50 percent level deserves its own honesty note. It is in the family by adoption, not arithmetic, and pretending otherwise makes the whole toolkit look like numerology. It stays because half-retracements are real, repeated, observed behavior. That is a behavioral justification, and it is a legitimate one.
Read the levels as a graded set of locations where reactions become progressively more meaningful. A bounce at 23.6 percent is routine. A bounce at 61.8 percent, after everything above it gave way, is an event. Same tool, same lines, very different information content depending on which depth produced the reaction.
One Leg, Five Lines
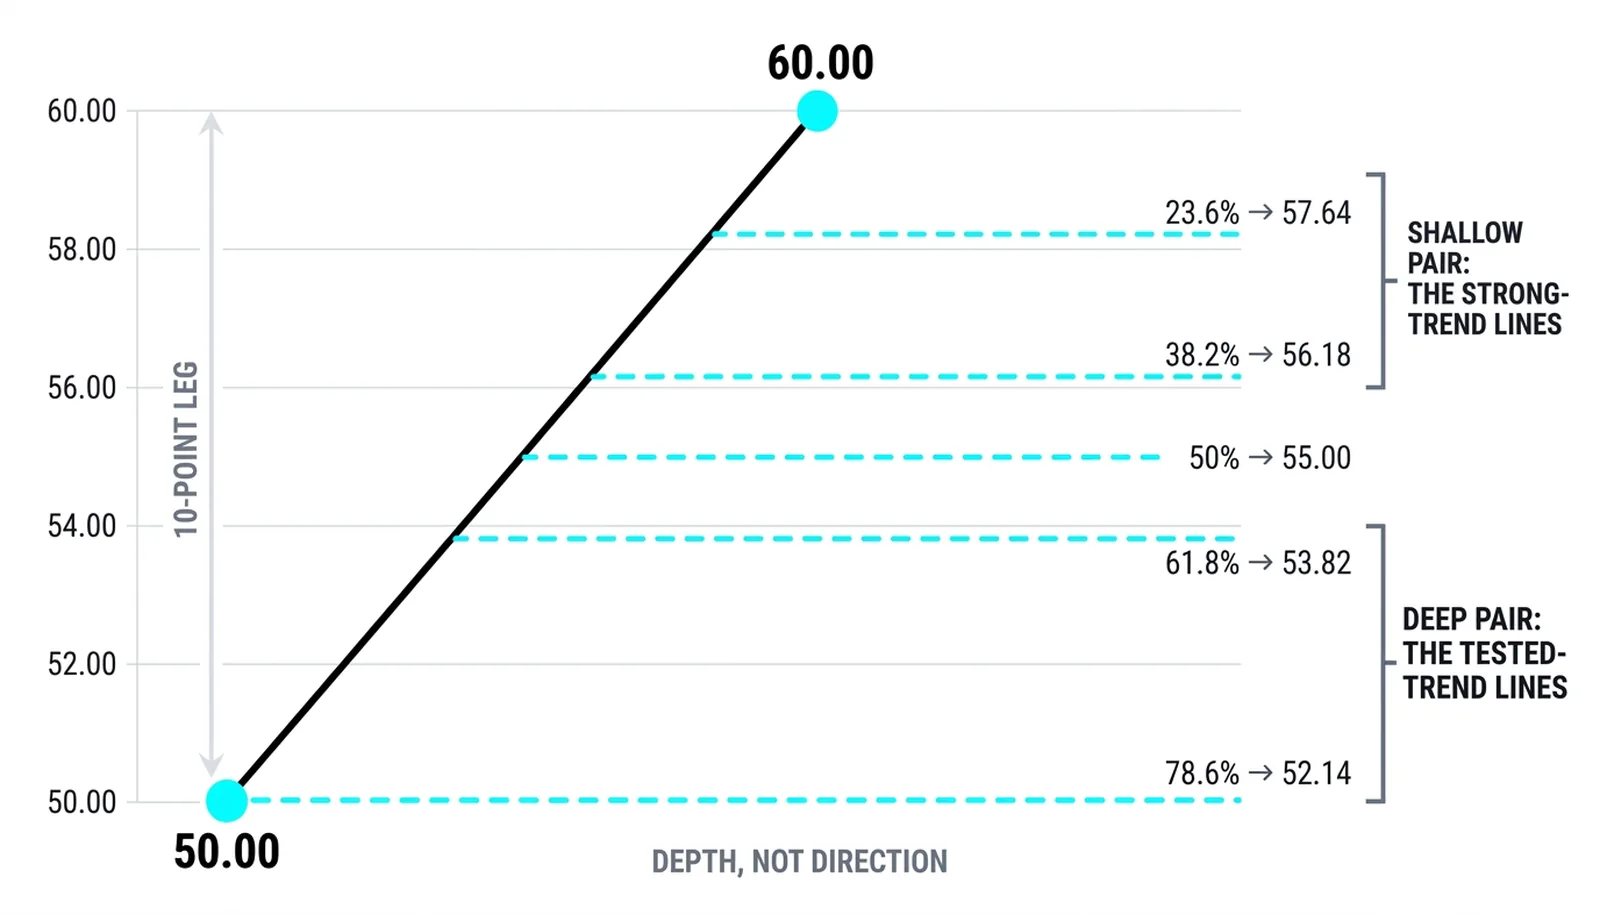
Take a hypothetical leg that runs 10.00 points, from 50.00 up to 60.00. Anchor a retracement tool to those two swings and the five lines land at 57.64, 56.18, 55.00, 53.82, and 52.14. Every number below is an illustration, not a market quote.
The shallow pair, 57.64 and 56.18, are the strong-trend lines. A pullback that dies at 56.18 has surrendered only 38.2 percent of the leg, and the read is that buyers remain firmly in charge. The deep pair, 53.82 and 52.14, are the tested-trend lines. A pullback reaching 52.14 has surrendered 78.6 percent of the leg, and the trend is on trial.
The 55.00 line sits in the middle as the adopted half. A hold there is respectable. A clean break through it shifts the burden of proof onto the buyers.
The price between the lines is where the question gets argued. A pullback that hesitates between 56.18 and 55.00 is a trend under mild questioning. One that grinds between 53.82 and 52.14 is a trend fighting for its life. The lines frame the zones; the trading decision comes from watching which zone absorbs the counter-move.
| Ratio | Derivation | Price on this leg | Story it tells |
|---|---|---|---|
| 23.6% | 0.618 cubed | 57.64 | Shallowest line; counter-move barely stirs, trend at full strength |
| 38.2% | 0.618 squared, or 100 minus 61.8 | 56.18 | Strong-trend line; a stall here says buyers never lost control |
| 50% | Plain division in half, adopted from Dow-era practice | 55.00 | The halfway border; neutral ground between strength and strain |
| 61.8% | 1 divided by 1.618 | 53.82 | Deep line; trend under real test, most watched of the five |
The 78.6 percent line, the square root of 0.618, lands at 52.14 on this leg. It is the last station before the 50.00 swing low itself, and a hold there is the trend's final argument before the structure breaks outright.
Key Ratio Questions, Answered
What are the key fibonacci ratios?
The key fibonacci ratios are 23.6 percent, 38.2 percent, 50 percent, 61.8 percent, and 78.6 percent. Every retracement tool draws these five as fractions of a prior price move, and together they form one depth gauge rather than five separate predictions.
Where do the fibonacci ratios come from?
Four of the five come from the golden ratio, 1.618. The 61.8 percent level is its inverse, 38.2 percent is that inverse squared, 23.6 percent is the inverse cubed, and 78.6 percent is the square root of 0.618. The 50 percent level is the exception, adopted from older charting practice because half-retracements are consistently observed behavior.
Is 50 percent a fibonacci ratio?
No. The 50 percent level is plain division in half, with no connection to the golden ratio's arithmetic. It stays in the toolkit because half-retracements happen repeatedly across markets and timeframes, a behavioral justification rather than a mathematical one.
Which fibonacci ratio is most important?
The 61.8 percent level is the most watched, but the better answer is that depth as a whole matters more than any single line. A trend that keeps holding shallow retracements is telling a different story than one that keeps reaching deep ones, and that running pattern of depth is the information worth trading.
The next lesson puts the family to work: how to anchor the tool correctly so the five lines land where the market actually respects them, and the anchoring mistakes that quietly ruin otherwise sound analysis.