Fibonacci Confluence with Market Structure
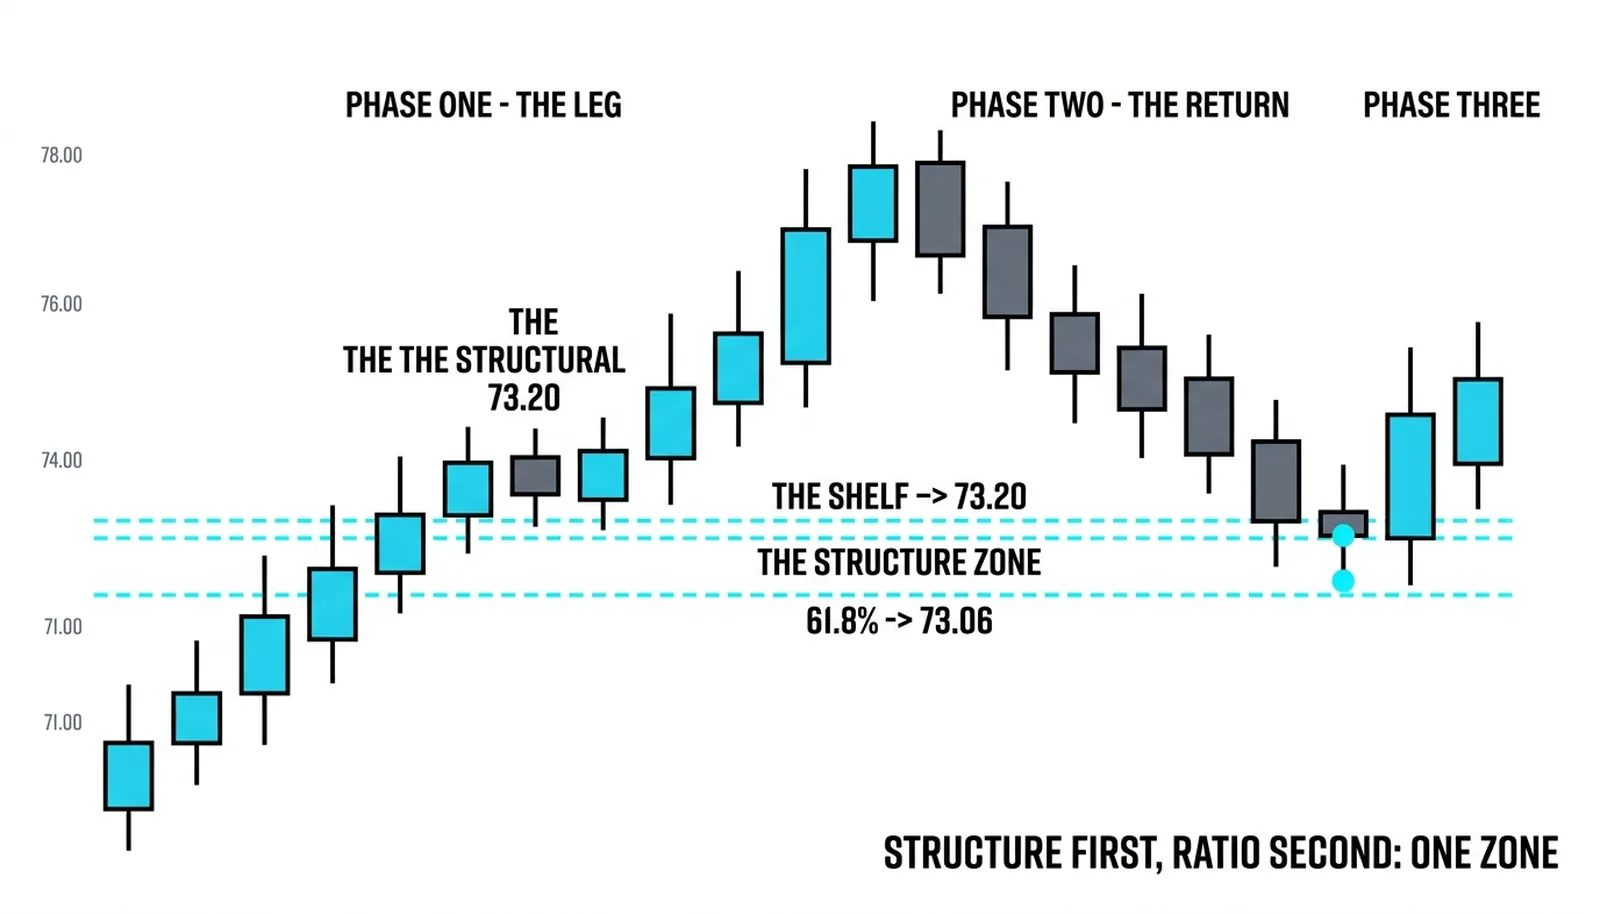
Confluence with market structure is the meeting of a fibonacci measurement with the lines the market's own structure has already drawn: the origin of the last impulse and the unfilled gap it left behind. The pairing works because the measured line and the structure line mark the same price for two different reasons. One comes from the mathematics of the leg. The other comes from what buyers and sellers actually did at that price. When both point at the same number, the zone carries two independent references instead of one.

Think of it as a belt and suspenders: two things holding the same load by two different means, either one doing the job alone, and the failure of one leaving the other still holding. The price action lesson closed by naming what remained outside it, the structure underneath the zone. This lesson joins the two. The measured line tells you where a pullback should stall. The structure tells you why traders are already standing there.
The Origin of the Move
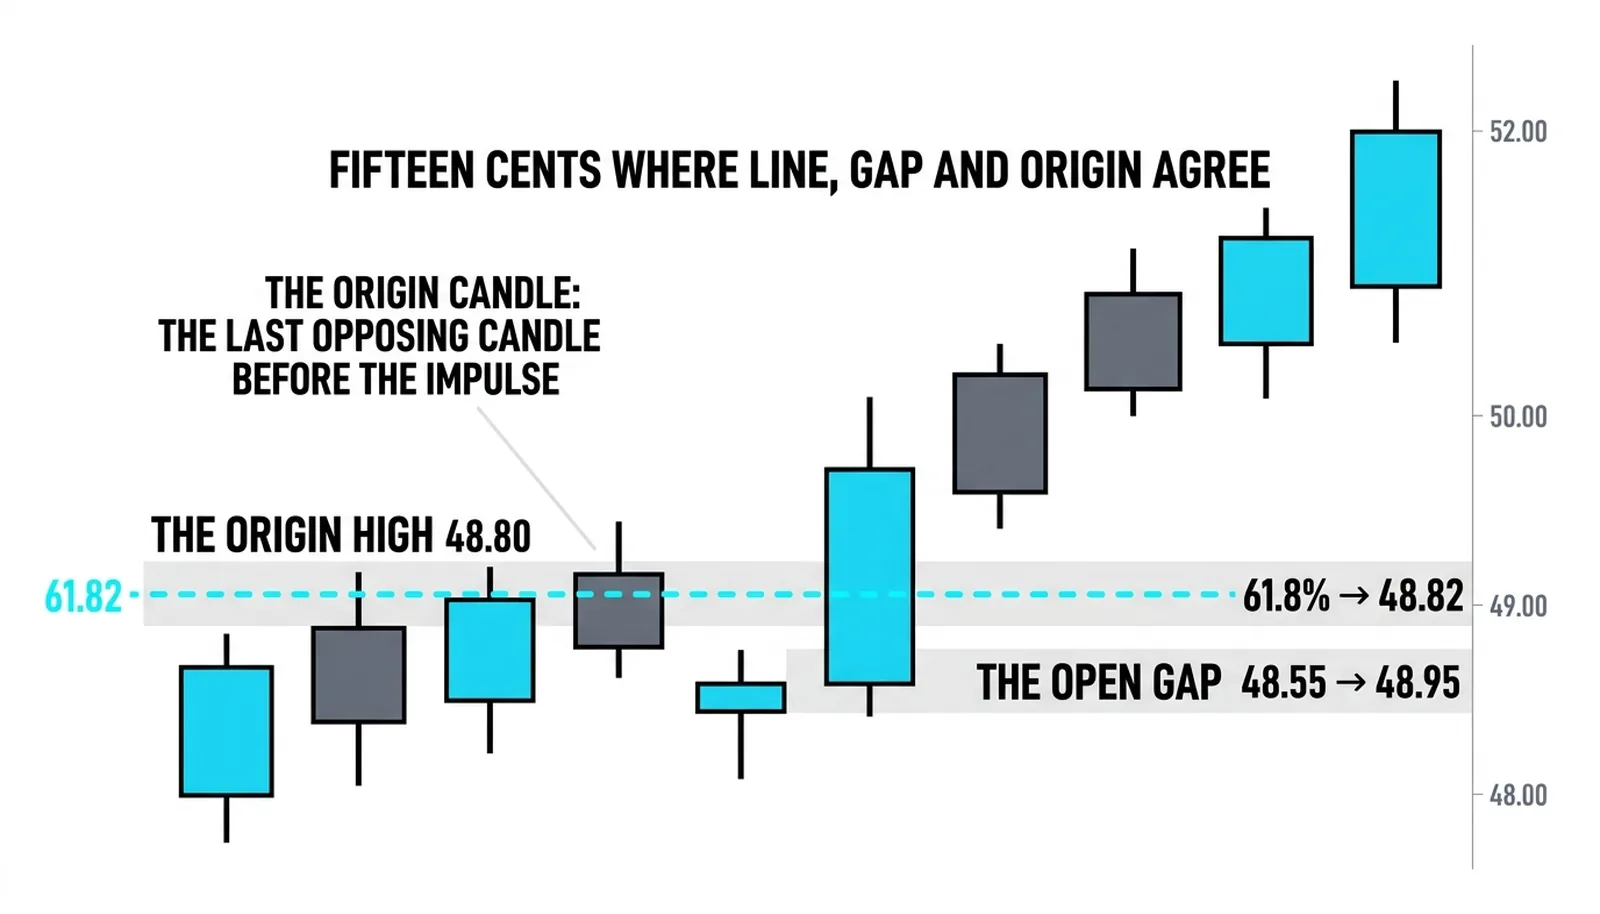
The first structure line is the origin of the move: the last opposing candle before the impulse launched. In an up leg, it is the final down candle before the run began. That candle is where the previous direction's orders were absorbed and the new direction began.
The teaching world that calls this candle an order block gave an old idea a new name. The name is worth knowing because the crowd watching that candle is large, and a watched level has more defenders than an unwatched one. The mechanism, though, is as old as swing reading. Sellers pressed into that candle and failed. Buyers took control there. Anyone who sold inside it and watched price run away is waiting to exit at breakeven, and anyone who missed the launch is waiting to buy the retest.
What makes an origin qualify is action, not appearance. The candle must have launched the leg. A random down candle in the middle of the range is not an origin. The test is simple: cover everything after the candle and ask whether the impulse visibly began there. If the answer is no, the candle is decoration.
The price action canon has taught for decades that every strong leg begins at a point where one side gave up, and the origin candle is that point drawn on the chart. The name changes across schools. The behavior does not.
The Unfilled Gap
The second structure line is the unfilled gap, the fair value gap of the same teaching world. It is three candles where the middle one's range was never revisited: the high of the first candle sits below the low of the third, leaving a band the market skipped on the way up because buying pressure did not let it trade there.
Imbalance is the older word for it, and imbalance is the more useful word. Markets trend on imbalance. A skipped band is proof that buyers were so aggressive they did not wait for two-sided trade at those prices. That same aggression is why the band pulls the pullback toward it. Buyers who missed the skipped prices get a second chance there, and sellers who were run over get a cleaner exit.
The gap only counts while it is open. Once price has traded back through the whole band, the imbalance is resolved and the line is spent. An unfilled gap is a live claim. A filled gap is history.
The cluster method rests on clustering measured lines and treating the cluster as the tradeable object; the unfilled gap adds a structural cluster member that no ratio can produce on its own.
Trading the Structure Zone
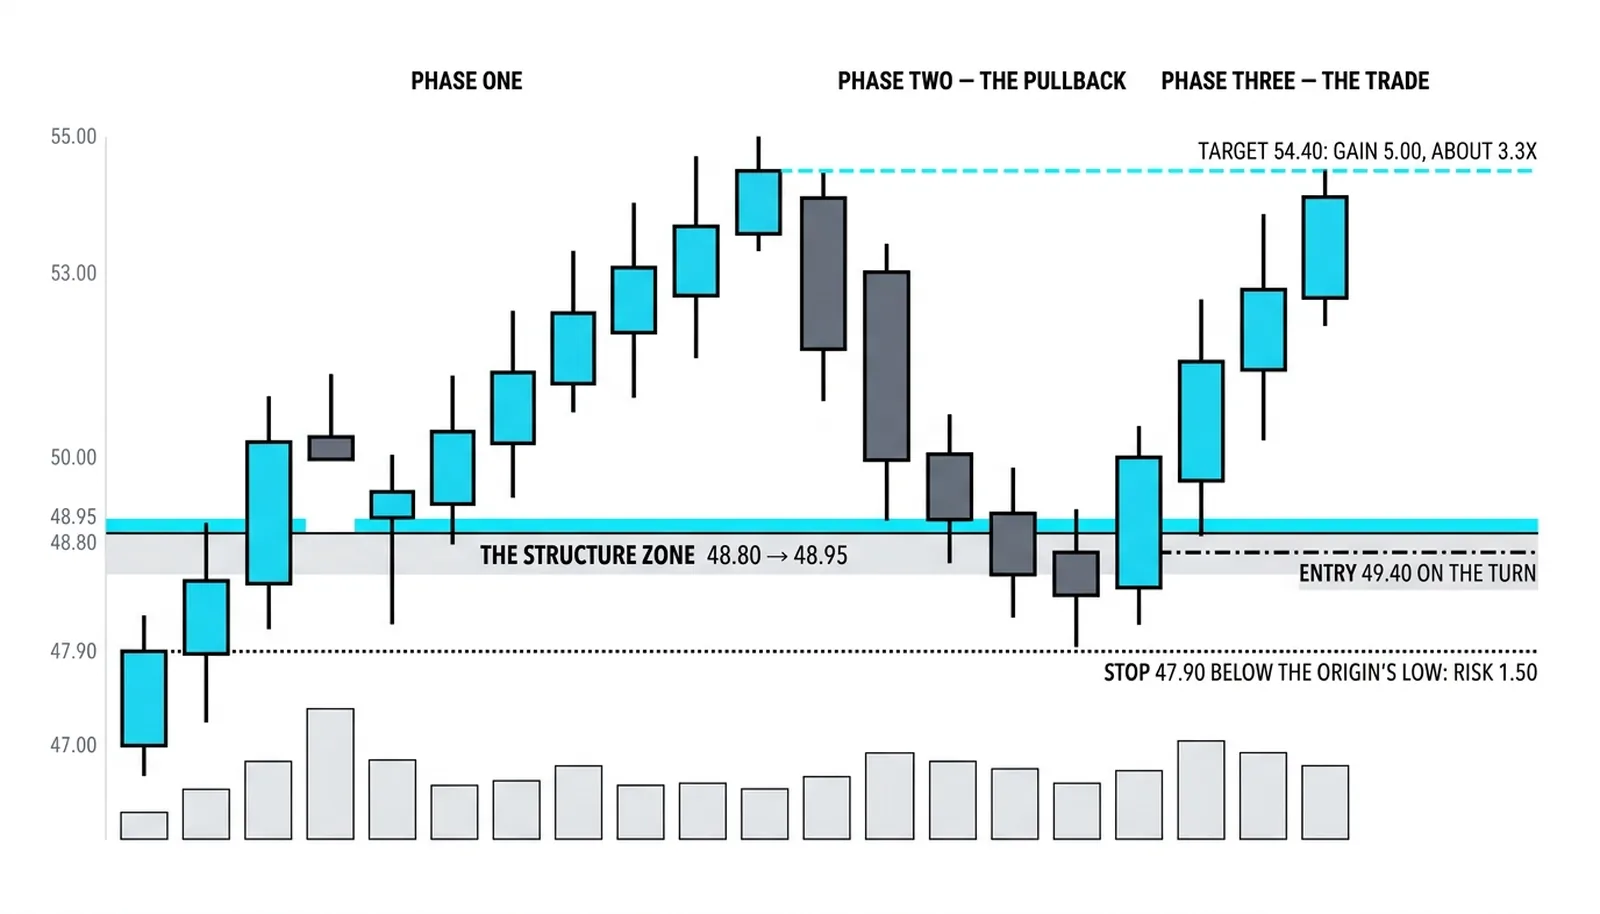
The trade follows the structure, not the measured line. The stop belongs below the origin's low, not a hair below the 61.8 percent line. The reason is the shared death of the structure lines. If price closes below the origin's low, the gap has been filled and broken and the origin has been absorbed, usually in the same candle. Both lines die together. That shared death is the defined risk, and it is what makes the stop placement honest rather than hopeful.
The entry waits for the turn. Price reaching the zone is an alert, not a signal. The zone tells you where to watch; the turn tells you the defenders showed up. Entering inside the zone on touch alone is buying a falling pullback and hoping the structure holds.
The names come from order-flow teaching, not from the measured line's own mathematics. A fibonacci line landing on an empty name would be confluence with vocabulary. The structure must have acted. The origin candle must have launched the leg. The gap must still be open. If either condition fails, there is one reference, not two, and the zone deserves half the respect at most.
The Zone at 48.80
All numbers here are hypothetical and invented for illustration. A leg runs 10.00 points, from 45.00 to 55.00. The 61.8 percent retracement line sits at 48.82.
The impulse launched from an origin candle whose high is 48.80 and whose low is 48.00. On the way up, the market skipped a band from 48.55 to 48.95 that it has not revisited since. The measured line lands inside the open band and two cents from the origin's high. The zone spans 48.80 to 48.95, fifteen cents wide, and every price inside it is backed by both the ratio and the structure.
Price pulls back to 48.88, inside the zone, and turns. The long is taken at 49.40 on the turn. The stop sits at 47.90, below the origin's low, risking 1.50. The first target is 54.40, just under the old high, a gain of 5.00. That is about 3.3 times the risk.
The failed version teaches the other half. Price closes at 47.60, below the origin's low. The gap is filled and then broken. The origin is absorbed. Both structure lines die in the same candle, and the trade is out at the stop for 1.50 while traders who placed stops a hair under 48.82 watch the same candle take them out at worse prices with no structural reason left to hold.
| Component | Its Own Evidence | Its Own Crowd | What It Contributes to the Zone |
|---|---|---|---|
| The 61.8 percent retracement | The mathematics of the leg | Ratio traders measuring the pullback | The precise line the zone is built around |
| The origin candle | The candle that launched the impulse | Order block watchers and missed-entry buyers | The lower boundary and the stop's anchor |
| The unfilled gap | A skipped band never revisited | Imbalance traders waiting for the fill | The upper band that catches the pullback early |
| The turn at 48.88 | Price stalling and reversing inside the zone | Confirmation traders waiting for proof | The entry trigger that converts the zone into a trade |
Structure Questions, Answered
What is fibonacci confluence with market structure?
It is a fibonacci measurement landing on a price that the market's own structure already marks, the origin of the impulse or an unfilled gap. The measured line and the structure line hold the same price for two independent reasons, which is what separates a real zone from a line on a chart.
What is an order block in trading?
An order block is the modern name for the last opposing candle before an impulse launched, the point where the previous direction was absorbed and the new one began. The idea is as old as swing reading; the name is new, and it matters mainly because of the size of the crowd now watching that candle.
What is a fair value gap?
A fair value gap is a three-candle pattern where the middle candle's range was never revisited, leaving a skipped band between the first candle's high and the third candle's low. The older word is imbalance, and the band attracts the pullback because the market skipped two-sided trade there on the way through.
Does confluence with structure work on all timeframes?
Yes, because both components are fractal: ratios measure any leg, and every timeframe has origin candles and skipped bands of its own. The higher the timeframe that produced the structure, the larger the crowd defending it, so a daily origin backing an hourly retracement is stronger than two hourly lines agreeing with each other.
The next lesson moves the same ratios off the price axis entirely, counting bars, windows, and cycles to ask when a move is due rather than where it should stall.