Higher Timeframes Control Lower Timeframes
Higher timeframes control lower timeframes because a level or trend that took weeks to build holds far more orders and attention than anything formed in an afternoon. The small chart's signals work best when they point the same way as the bigger one. Everything else in this lesson is learning to see that relationship before you click buy or sell.

Think of it this way: the higher timeframe is the climate and the lower timeframe is the weather. A cold snap can argue with the season for a few days, and the season still wins.
What Control Actually Means
Control is not a mystical force. It is permission. The daily trend decides which intraday signals are worth taking and which are traps.
Say the daily chart is in a clean uptrend, making higher highs and higher lows. On your 5-minute chart you will see dozens of sell signals every session. Bearish engulfing candles, breakdowns of small ranges, momentum rolling over. Most of them are noise. They fire against a tide they cannot beat.
The buy signals on that same 5-minute chart, the ones that trigger after pullbacks into rising structure, carry a different weight. They are aligned with where the larger flow of orders is already pushing. Same chart, same candlestick vocabulary, completely different reliability.
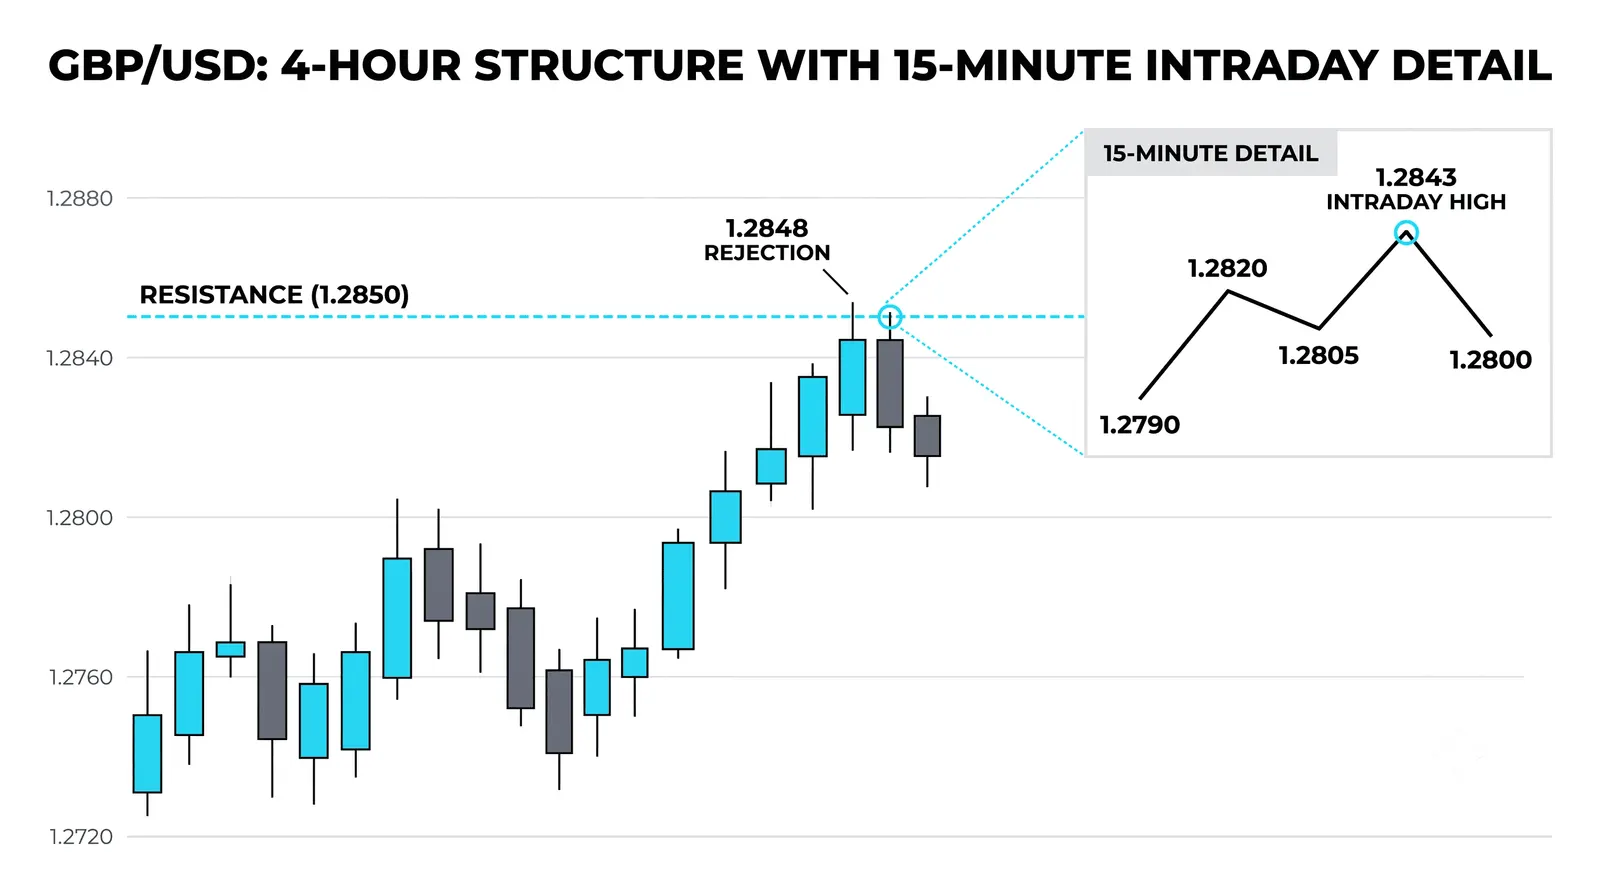
So the small chart's job is timing, not direction. It tells you when to act. The higher chart tells you whether acting makes sense at all. When you reverse those roles, you end up taking every pretty setup the 5-minute offers and wondering why your win rate is poor.
Context sets permission. The small chart only times the entry.
Why the Bigger Chart Outweighs the Small One
A daily support level is a record of where large numbers of participants decided price was cheap, and where many of them still have resting interest.
More participants planned around the weekly and daily levels than around anything on your intraday chart. Funds, swing traders, and algorithms all mark the same obvious daily swings. Their orders and their stops sit there. That concentration is the gravity the small chart moves inside.
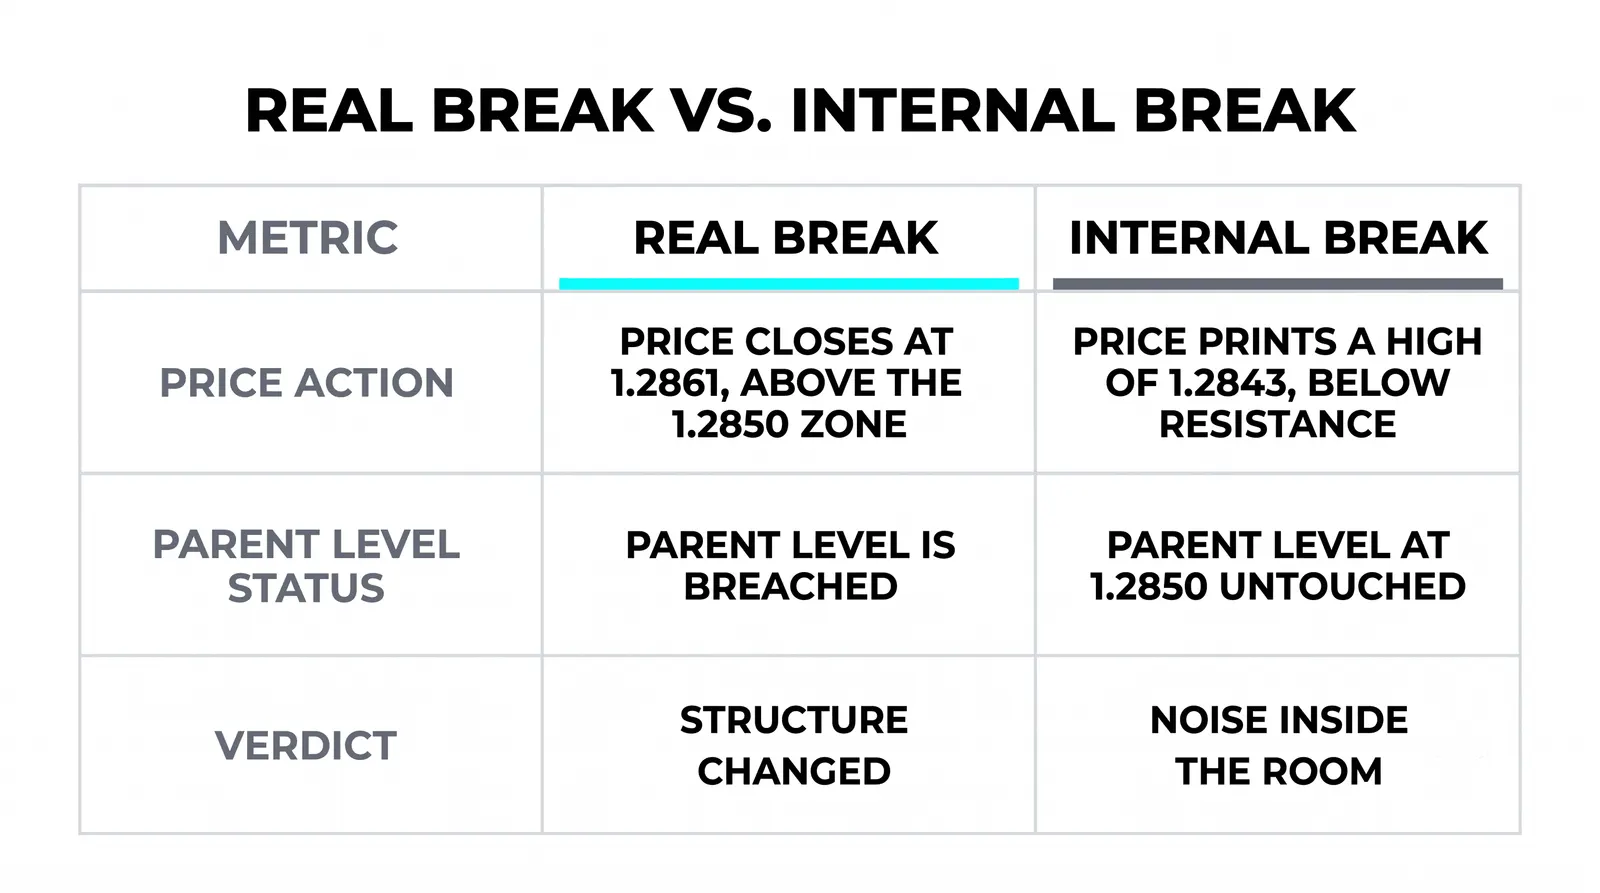
A 5-minute support level, by contrast, was formed by a few hours of trading. Fewer eyes, fewer orders, less commitment. It breaks easily because there is little standing behind it.
This is why a level that looks trivial on the daily can stop an intraday move dead. The small chart sees a random pause. The daily chart sees a wall of resting interest doing exactly what it was left there to do.
There is also a self-fulfilling element. Because so many traders watch the same daily levels, reactions at those levels get reinforced. You do not need to believe in anything mystical. You only need to respect that the crowd is bigger up there.
The Honest Exception
Control is read, not assumed. A lower timeframe can take control at the turn, and pretending otherwise will get you run over.
When a daily uptrend breaks its last higher low, the daily structure is damaged. At that moment the intraday downtrend is not fighting the trend. The intraday downtrend is the new context, and it stays in charge until the daily repairs itself by reclaiming structure.
This is how every major reversal actually begins. No daily trend dies on the daily chart first. It dies on the small charts, one failed bounce at a time, until the damage is visible to everyone. The traders who bought every dip on the way down were following a rule that had quietly expired.
So the rule has a condition attached. Respect the higher timeframe while its structure is intact. When the structure breaks, update your read instead of defending the old one. Stubbornness dressed up as discipline is still stubbornness.
What the Lower Timeframe Is Actually For
The small chart is not useless. It has three specific jobs, and it does them well.
- Precise entries. The daily tells you the zone. The 5-minute or 15-minute tells you the exact moment buyers step in, so your stop can sit tight behind the turn instead of under the whole zone.
- Early warning. When price approaches a major daily level, the small chart shows you the test in real time. You see the level being probed before the daily candle even closes.
- Reading the test. At a big level, the intraday chart shows whether the move is absorbing orders or folding. Absorption looks like repeated pushes into the level that fail to follow through, with quick recoveries. Folding looks like clean breaks that hold. Those are very different situations, and the daily chart alone cannot distinguish them until it is too late.
Used this way, the lower timeframe sharpens a decision the higher timeframe already made. Used alone, it generates opinions you should never have formed.
One Level, Two Charts
Here is a hypothetical with round numbers. A stock runs from 100 to 120 in a daily uptrend, then starts pulling back. The daily chart shows a support zone at 112 to 114, left behind by the last swing low before the push to 120.
Now drop to the 5-minute chart. Price breaks below 115.00 with strong momentum. On that chart alone, this is a clean short. The breakdown is real, the candles are heavy, and every intraday signal agrees.
Price slides to 113.50. That number sits inside the daily zone. The selling stalls, small candles cluster, and then price reverses. It closes the session back at 115.20.
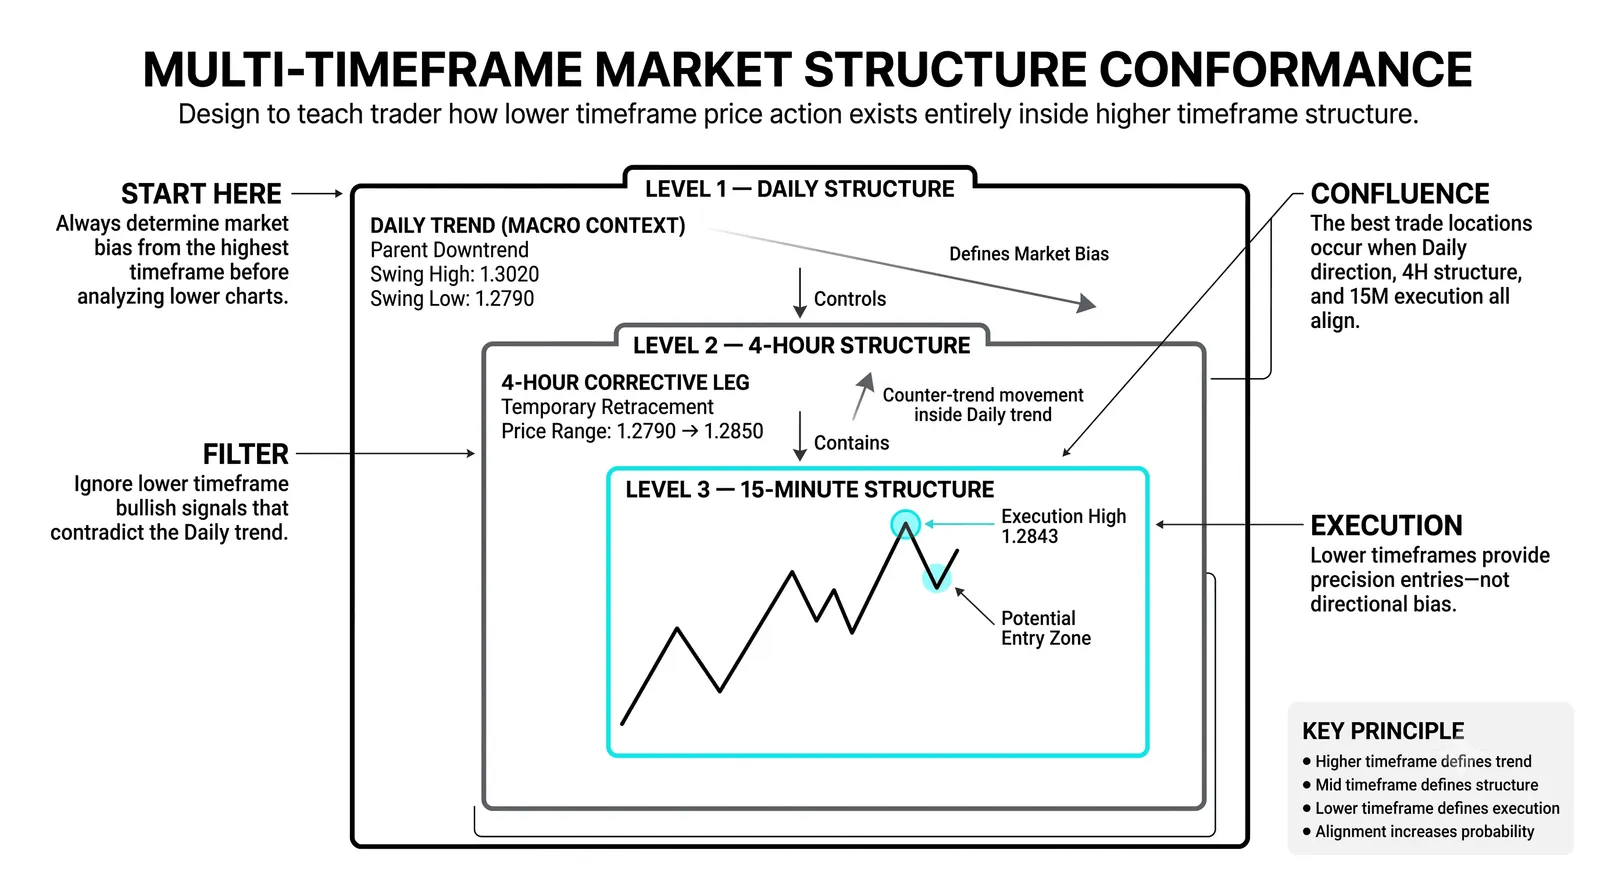
Walk through what happened. The 5-minute short looked clean on its own chart and lost, because it fired straight into the daily zone. The trader who only watched the 5-minute saw a breakdown. The trader who checked the daily first saw price falling into a floor that weeks of trading had built.
Notice the second detail. The bounce began at 113.50, inside the zone, before price ever reached the zone's lower edge at 112. Reactions inside a zone are normal because orders are spread across it, not stacked at one exact line. If you waited for a perfect touch of 112, you missed the turn entirely.
Same market, same hour. One chart produced a losing short. The other produced a high-quality long entry with a stop just under 112. The difference was not skill with candlesticks. It was which chart got asked first.
How to Act on This
Make it a two-step habit, done in this order, every time.
Step one: before opening any small chart, name the daily structure in one sentence. Out loud or written, it does not matter. "Daily uptrend, pulling back into support at 112 to 114." Or "Daily range, price mid-range, no edge." If you cannot say it in one sentence, you have not read the chart yet.
Step two: skip any small-chart signal that fights that sentence. Not "take it smaller." Not "watch it closely." Skip it. There will be another signal tomorrow that agrees with the daily, and that is the one worth your risk.
The exception from earlier still applies. If your one sentence is no longer true because the daily broke structure, write a new sentence. Then trade with the new one, not the old one.
This habit feels restrictive at first. You will pass on trades that would have worked. Over a hundred trades, the ones you skipped lose more than the ones you regret missing. That is the math that keeps accounts alive.
Higher and Lower Timeframes, Answered
Does a small-chart signal ever justify fighting the daily trend?
Only when the daily structure itself has broken, as covered above. A strong 5-minute signal inside an intact daily trend is a trap more often than an opportunity. If the daily's last higher low still holds, the trend still holds, and counter-trend signals deserve skepticism by default.
Which timeframes should I pair?
Keep the two charts far enough apart that they show genuinely different information. Daily with 5-minute or 15-minute works for day traders. Weekly with 4-hour or daily works for swing traders. Pairing the 5-minute with the 3-minute tells you nothing new, because both charts are describing the same weather.
How far back should I look on the higher chart?
Far enough to see the current structure clearly: the last two or three major swings and the levels they left behind. For most daily charts that means three to six months. Levels older than that matter only if price is approaching them now.
What if the two charts disagree?
Then the higher timeframe wins by default, and the disagreement itself is information. A small chart pushing hard against an intact daily trend usually marks a pullback, not a reversal. Stand aside or wait for the small chart to realign with the daily, and treat the moment they agree again as your opportunity.
Once this habit is automatic, the next skill is reading how price behaves at those higher-timeframe levels in real time, which is where absorption, failed breaks, and confirmation come in. That is where structure reading turns into actual trade selection.