How to Stack Fibonacci Levels
To stack fibonacci levels, draw the retracements of two separate completed swings on the same chart, a longer leg and the newer leg that grew out of its pullback, and mark the prices where a line from each swing lands close to a line from the other, because those overlaps are the zones both crowds watch at once. Each swing gets measured alone. The tool anchors once per swing, never blended across two. When a level from the older leg and a level from the newer leg agree on a price, that price carries double the attention of any single line.

Think of a double-exposure photograph: two pictures printed on one frame, and where the images overlap the picture is darker and harder to deny. The confluence lesson defined this overlap and explained why it concentrates attention. This lesson performs it, step by step, stacking levels from multiple swings of the same trend. The cluster method builds an entire methodology around exactly this practice, treating clustered levels as the only zones worth trading and dismissing isolated lines as noise. The premise is simple. A retracement level matters because traders watch it. Two levels at one price matter twice as much, because two separate groups of traders, measuring two separate swings, arrive at the same number.
The Two Swings
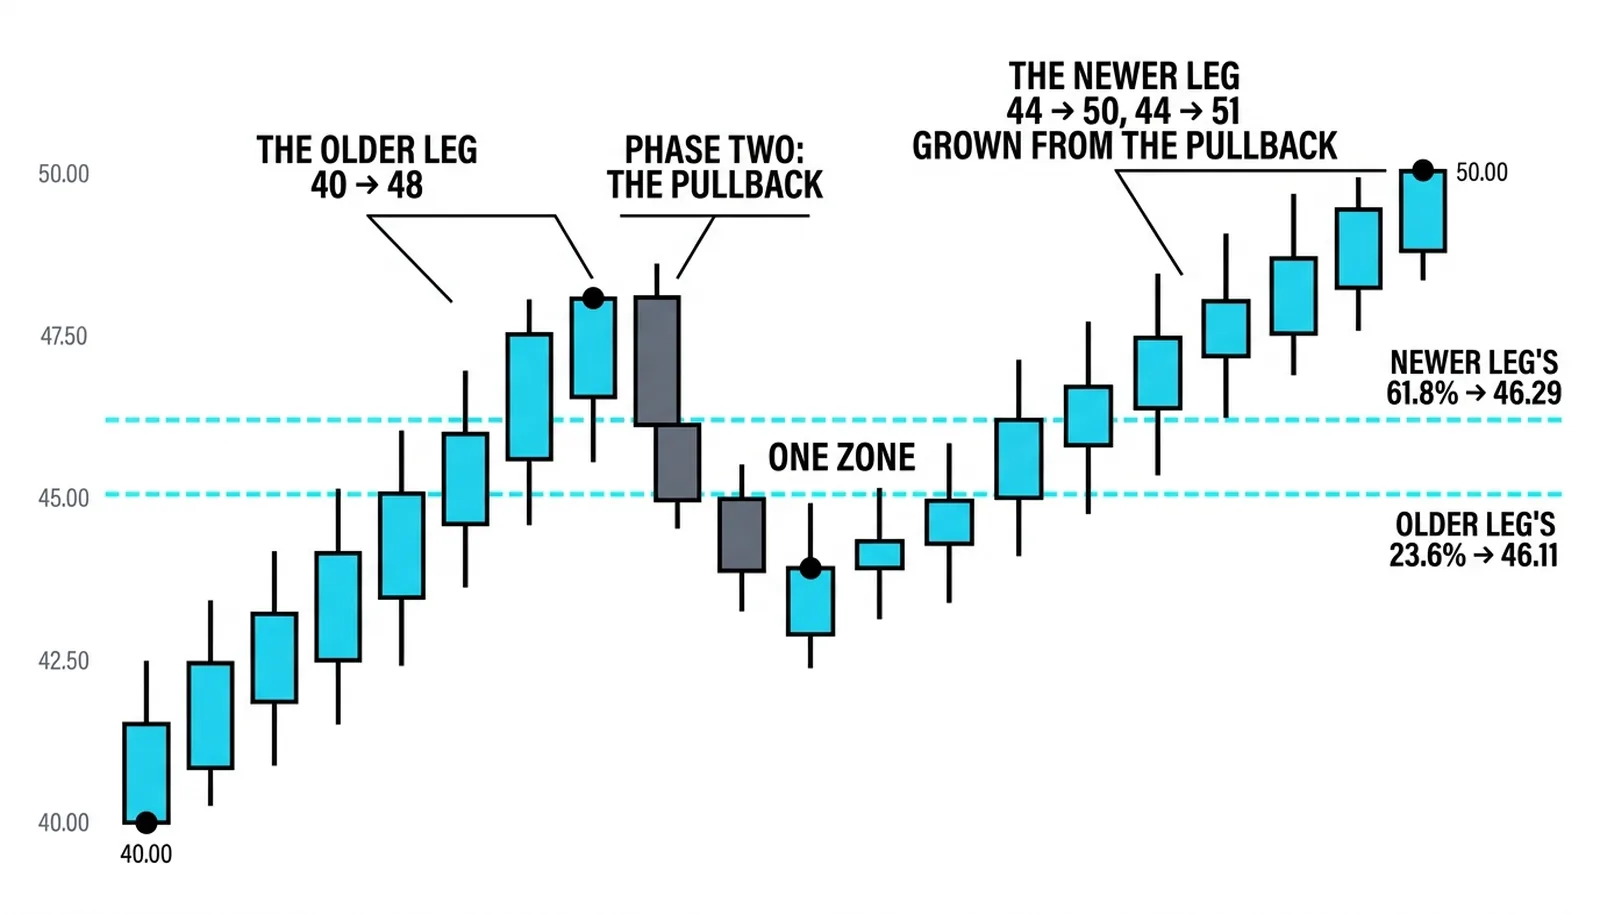
Step one is identification. Find the older leg: a completed, confirmed move with a clear start and a clear high or low. Then find the newer leg, which grew out of the older leg's pullback. The newer leg begins at the pullback low of the older move and runs to its own confirmed extreme. Both swings must be finished and marked before any measuring begins.
The confirmed-swing rule is strict. A swing is confirmed only when price has pulled back far enough from its extreme to prove the leg ended. Measuring a leg still in progress gives you lines that shift with every new tick, and shifting lines cannot stack because they never hold still long enough to overlap. The price action canon makes the same point about any measured move: the anchor points must be real, completed price events, not hopes about where a move might stop.
- Mark the older leg's start and end with exact prices.
- Mark the pullback low where the newer leg begins.
- Mark the newer leg's confirmed extreme.
- Only then draw anything.
Step two is the drawing, and the rule is one tool per swing. Draw the retracement of the older leg from its own start to its own end. Then draw the retracement of the newer leg separately, anchored to its own two points. Never stretch one tool across both legs and never blend the anchors. Each swing is a different decision made by a different crowd at a different time, and the whole value of the stack comes from keeping those measurements independent. Blend them and you have one opinion speaking twice.
Finding the Overlaps
Step three is the search. Look for a retracement of the newer leg landing near an extension or a shallow retracement of the older leg. The classic pairing is a deep retracement of the newer, shorter move sitting on top of a shallow retracement of the older, longer move. Both measurements agree on a price that neither would have chosen alone.
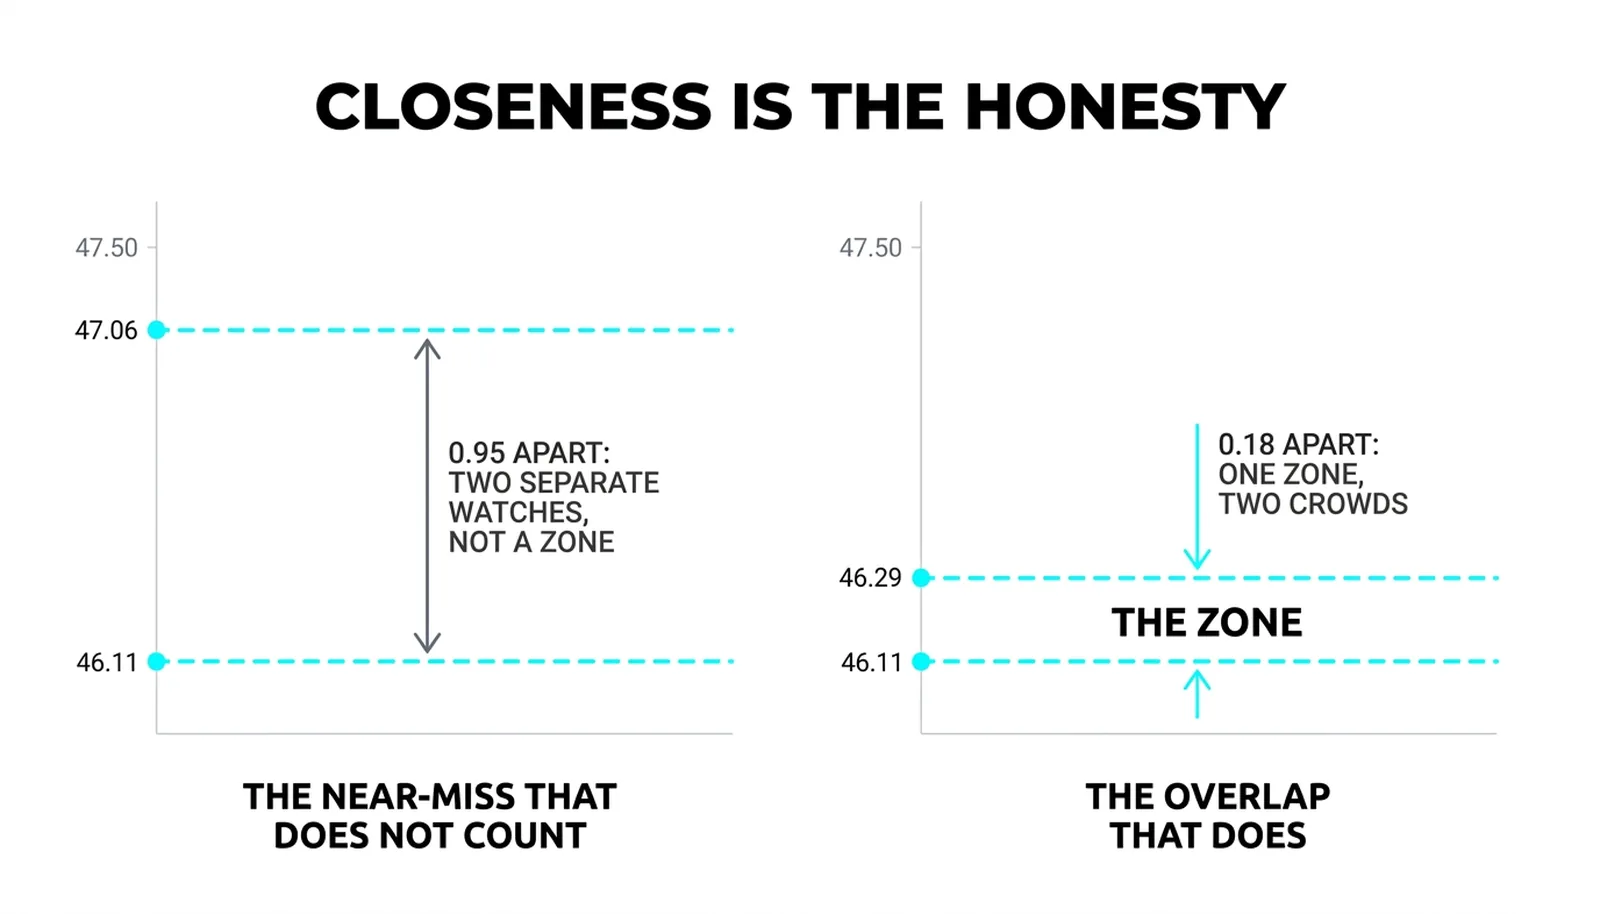
Most pairs of lines do not overlap. That is the honest baseline, and it is what makes a real overlap meaningful. A near-miss of a full point on a ten-point swing is not a stack. It is two unrelated lines that happen to share a chart. Working tolerance runs tight: on a swing of eight to ten points, two lines within roughly a quarter of a point of each other qualify as one zone. Wider than that, and the two crowds are watching two different prices.
The forced stack is the method's dishonest twin. A trader wants a confluence, nudges an anchor a few ticks, redraws a swing from a slightly different low, and manufactures an overlap that price never produced. This destroys the method at its root. The stack works because it measures where two independent crowds actually agreed. A redrawn swing measures where one trader wished they had agreed. The stack is found, never fitted.
When no overlap exists, the correct output is no trade from this tool. Discipline here is cheap. Forcing is expensive.
Trading the Stacked Zone
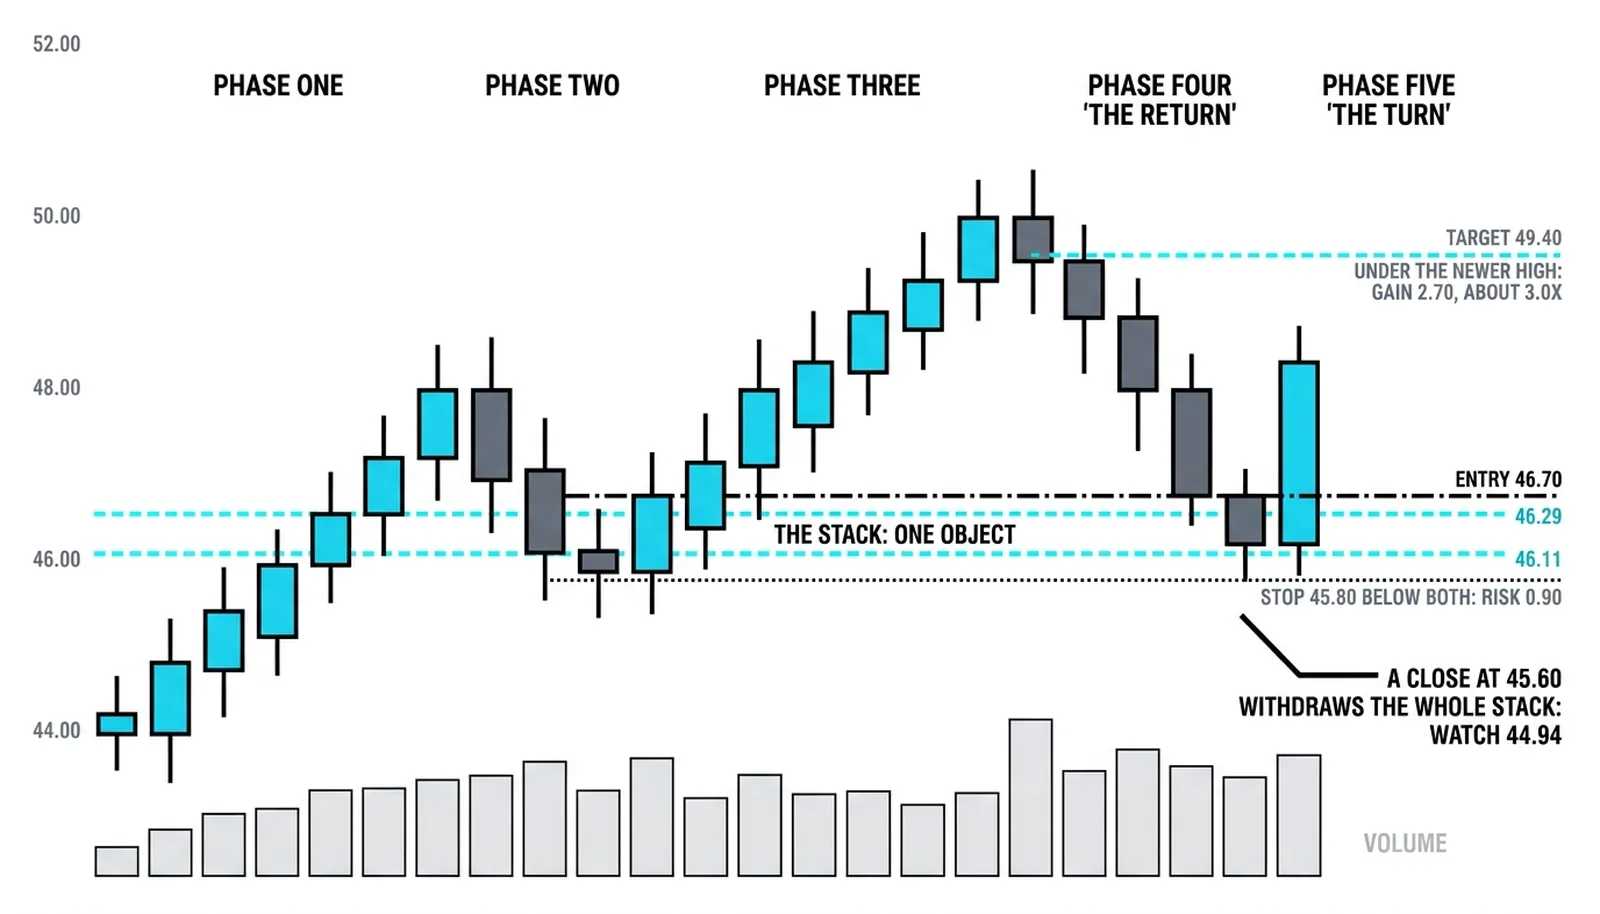
The trade begins when price pulls back into the stacked zone and turns. The zone does the locating; the turn does the timing. Entering inside the zone before the turn means buying a falling price on faith. Waiting for the turn means the zone has already shown buyers defending it, and the entry rides that evidence.
The stop goes below both lines, beneath the entire zone, because the zone stands or fails as one object. This is the shared-failure rule. If price closes below the lower of the two stacked lines, the whole stack is withdrawn. There is no partial credit for the upper line still holding on some intraday basis. Two crowds agreed on that price, and price trading through both lines means both crowds were wrong together.
After a failure, attention hands down to the next meaningful level, typically a deeper retracement of the older leg. The trader who keeps one line alive mentally after the zone has closed is trading a memory, not a measurement. Mark the next level, step back, and let price come to it or not.
The Stack at 46.11 and 46.29
All numbers here are hypothetical, invented round figures for illustration. The older leg runs 8.00 points, from 40.00 up to 48.00. Its 23.6 percent retracement sits at 46.11. Price pulls back to 44.00, and the newer leg grows from there up to 50.00, a 6.00 point move. The newer leg's 61.8 percent retracement sits at 46.29.
The two lines overlap in a zone from 46.11 to 46.29. Either line alone is ordinary. Stacked, they form the most watched eighteen cents on the chart: the shallow-watchers from the older leg and the deep-pullback buyers from the newer leg are looking at the same price.
| The Swing | The Line | The Price | What It Stacks With |
|---|---|---|---|
| Older leg, 40.00 to 48.00 | 23.6% retracement | 46.11 | Newer leg's 61.8% line |
| Newer leg, 44.00 to 50.00 | 61.8% retracement | 46.29 | Older leg's 23.6% line |
| Older leg, 40.00 to 48.00 | 38.2% retracement | 44.94 | Nothing yet; the next level down on failure |
| Newer leg high | Swing extreme | 50.00 | Target reference, just under it at 49.40 |
Price pulls back into the zone, touches 46.20, and turns. The long is taken at 46.70 on the turn. The stop sits at 45.80, below both lines, risking 0.90. The first target is 49.40, just under the newer leg's high of 50.00, a gain of 2.70. That is about 3.0 times the risk, and the stacked zone is what justified the location.
Now the failed version. Price enters the zone and keeps falling, closing at 45.60, below both lines. The whole stack is withdrawn as one object. The watch hands down to the older leg's 38.2 percent retracement at 44.94. No averaging, no redrawing, no quiet hope that 46.11 still means something. The measurement said the zone failed, and the next measurement is already on the chart waiting.
Stacking Questions, Answered
What does stacking fibonacci levels mean?
Stacking fibonacci levels means drawing retracements from two separate completed swings on the same chart and marking the prices where a line from each swing overlaps. The overlap is the zone where two independent groups of traders are watching the same price, which concentrates attention and reaction there.
Which swings should you stack?
Stack the older leg of a trend with the newer leg that grew out of the older leg's pullback. Both swings must be confirmed and complete, with exact anchor prices, before anything is drawn. Each swing gets its own separate measurement, never a blended one.
How close do two levels need to be for confluence?
Close enough to act as one zone, which on an eight-to-ten-point swing means roughly a quarter of a point or less between the lines. A gap of a full point is a near-miss, not a stack, and treating it as one manufactures a signal the chart never gave.
Can you stack more than two levels?
Yes, a third swing's line landing inside the same zone strengthens it further, because a third independent crowd joins the same price. The same rules hold: every swing confirmed, every measurement separate, and the entire cluster failing as one object if price closes beyond its far edge.
From here, the natural extension is stacking these levels against the other structures already in the toolkit: the stacked zone that also sits on a horizontal support shelf, a supply zone, or a trendline is where the next lessons take the method.