How to Combine Indicators Into One System
Three oscillators stacked on a chart feel like thoroughness. RSI, stochastic, and MACD all agreeing is comforting, and comfort is exactly the problem: those three tools are three readings of one underlying quantity, so their agreement is nearly guaranteed and nearly worthless. Learning to combine indicators means the opposite of stacking. It means assigning different jobs to different tools until the chart, as a whole, can answer the three questions every trade depends on: which way is the market leaning, when is the moment, and is anyone actually participating.

This is the capstone of the indicator course. The categories were mapped in the four categories lesson, and the selection process got its own treatment in the trading style lesson. What remains is assembly: turning a drawer full of accurate tools into one system that produces decisions. The failure mode, three opinions and no plan, is what the indicators are not a strategy lesson warned about; the fix is a division of labor.
Why Same-Category Stacking Fails
Momentum oscillators rise when closes push into the upper range of recent bars and fall when closes sink toward the bottom. RSI expresses that as a ratio of average gains to average losses. The stochastic expresses it as the close's position inside the high-low range. MACD expresses it as the gap between two moving averages. Different math, same question, and on any real chart their curves turn together. The redundancy chart below makes the point with two of them side by side.
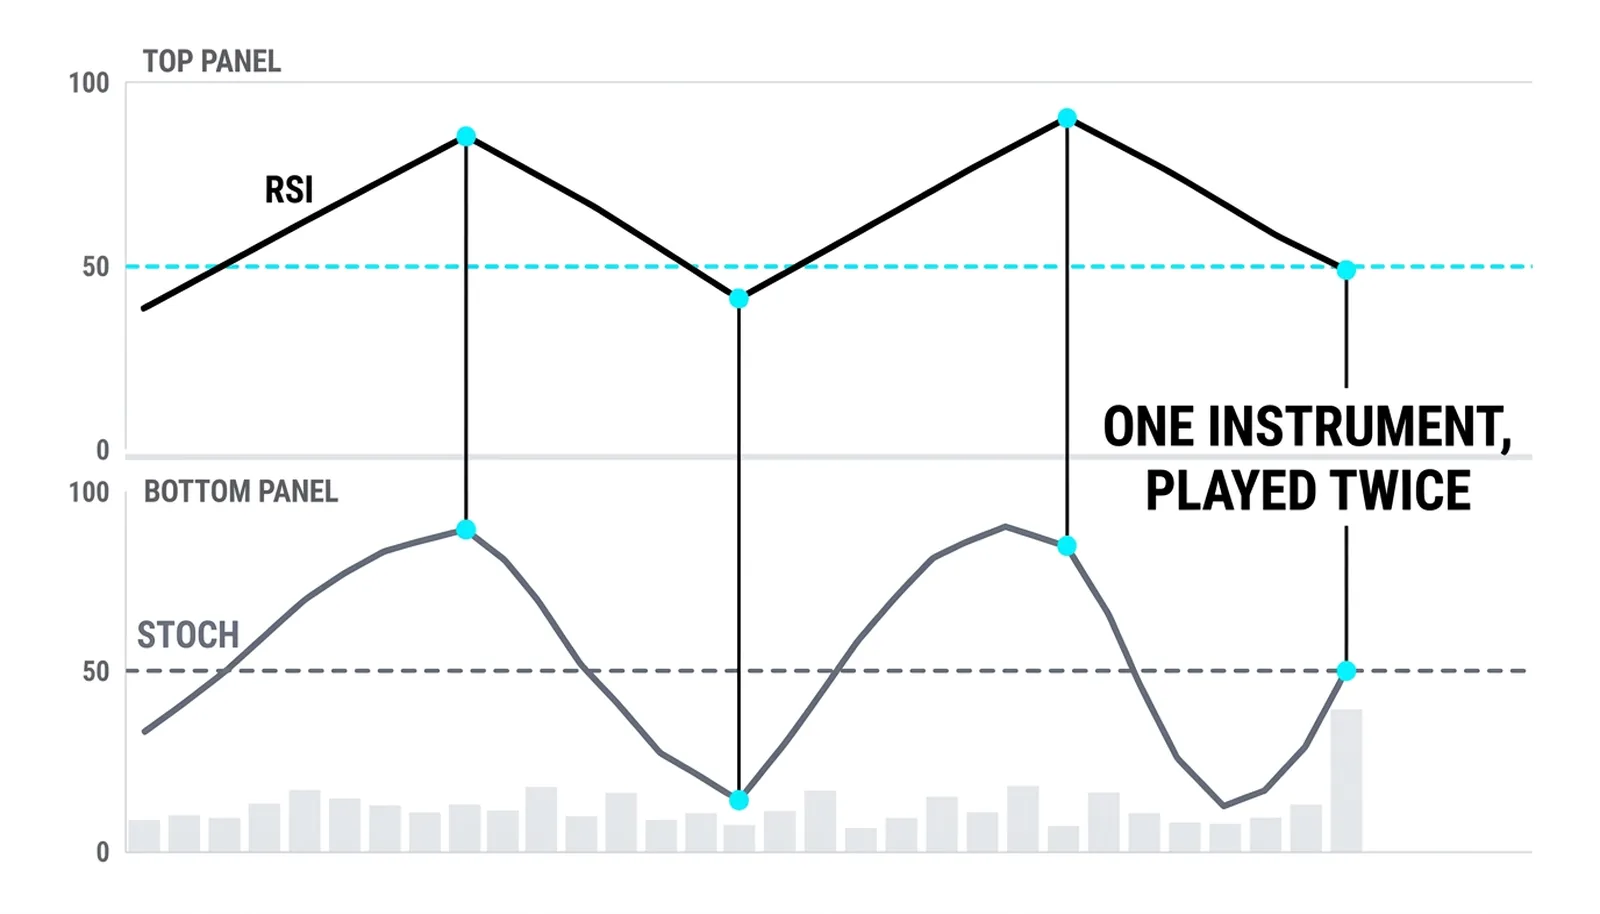
The two oscillators above spend most bars on the same side of their midline, and they turn on the same bars for the same reason. Confirming one with the other adds a second opinion, but the second opinion is a copy. A trader who waits for both to agree has simply added lag to a single signal. The test that actually matters for any combination is blunt: does the second tool measure something the first one does not?
The Division of Labor
A complete chart assigns one tool to each job, and the jobs come from the questions a trade must answer. Held together, the lineup works like a pit crew, not a crowd of volunteers: one mechanic per wheel, one on the jack, one on the fuel, because two grabbing the same wheel means another corner stays loose.
| Job | Question it answers | Typical tool | What it cannot do |
|---|---|---|---|
| Trend filter | Which side of the market is in charge? | Moving average, ADX | Time entries |
| Momentum timing | Is the moment favorable within the trend? | RSI, stochastic, MACD | Set the direction |
| Volume evidence | Is real participation behind the move? | Volume bars, OBV | Speak alone about direction |
| Price structure | Where is the level and the invalidation? | Support, resistance, swing points | Do any of the above |
The table has one rule hiding in it: at most one tool per job. Two trend filters double the lag without adding information. Two oscillators double the noise without adding conviction. The volume lesson makes the third row concrete: participation is a property volume measures directly, and no price-derived oscillator substitutes for it.
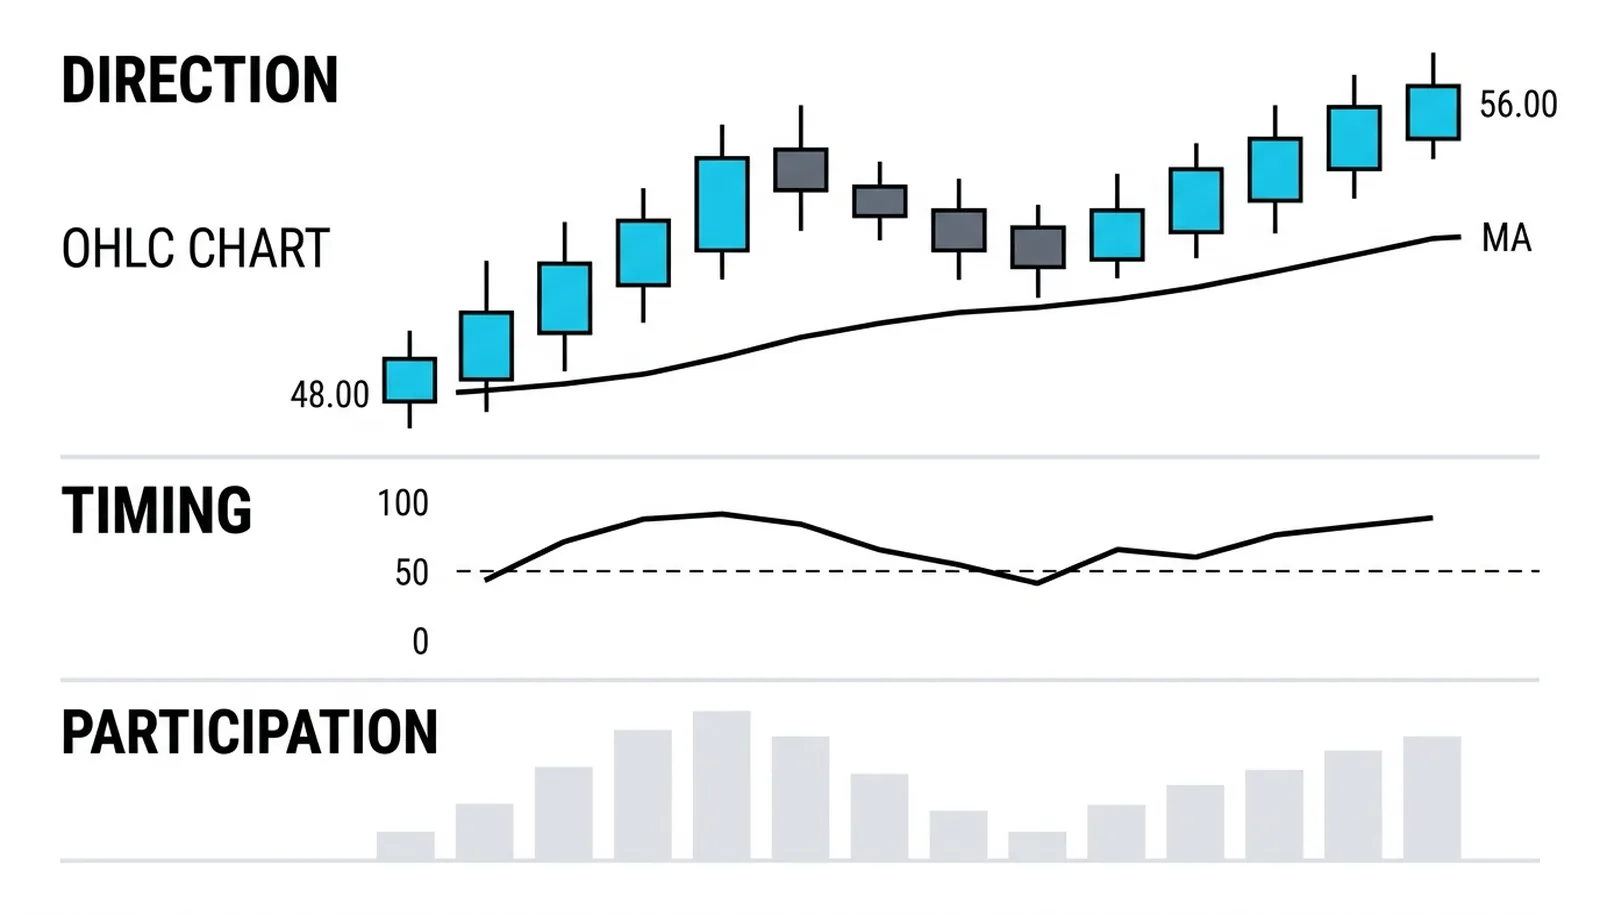
The layered chart above is the assembled version. The moving average on the price panel holds the direction question: price stays above it through the rally, and the average turns with the trend. The RSI panel holds the timing question: it flags when the push is stretching and when the pullback has washed out. The volume panel holds the participation question. None of the three panels duplicates another, which is the entire design goal.
Layering Across Timeframes
The Triple Screen, the best-known version of this idea, applies the same division of labor across time: judge the trend on a higher chart, hunt the setup on the trading chart, and let each screen do a different job at a different scale. The specific periods matter less than the principle. A weekly uptrend and a daily pullback are two facts about one market, and a system that reads both in order, direction first, setup second, takes fewer and better trades than one that reads either alone. The same logic runs inside a single chart whenever a long moving average plays the role of the higher timeframe.
The Full Assembly, with Numbers
The pieces are easier to trust in one concrete sequence. The chart below walks through a complete top formation using all four legs, and the numbers come from the kind of setup price action traders catalog in the wild.
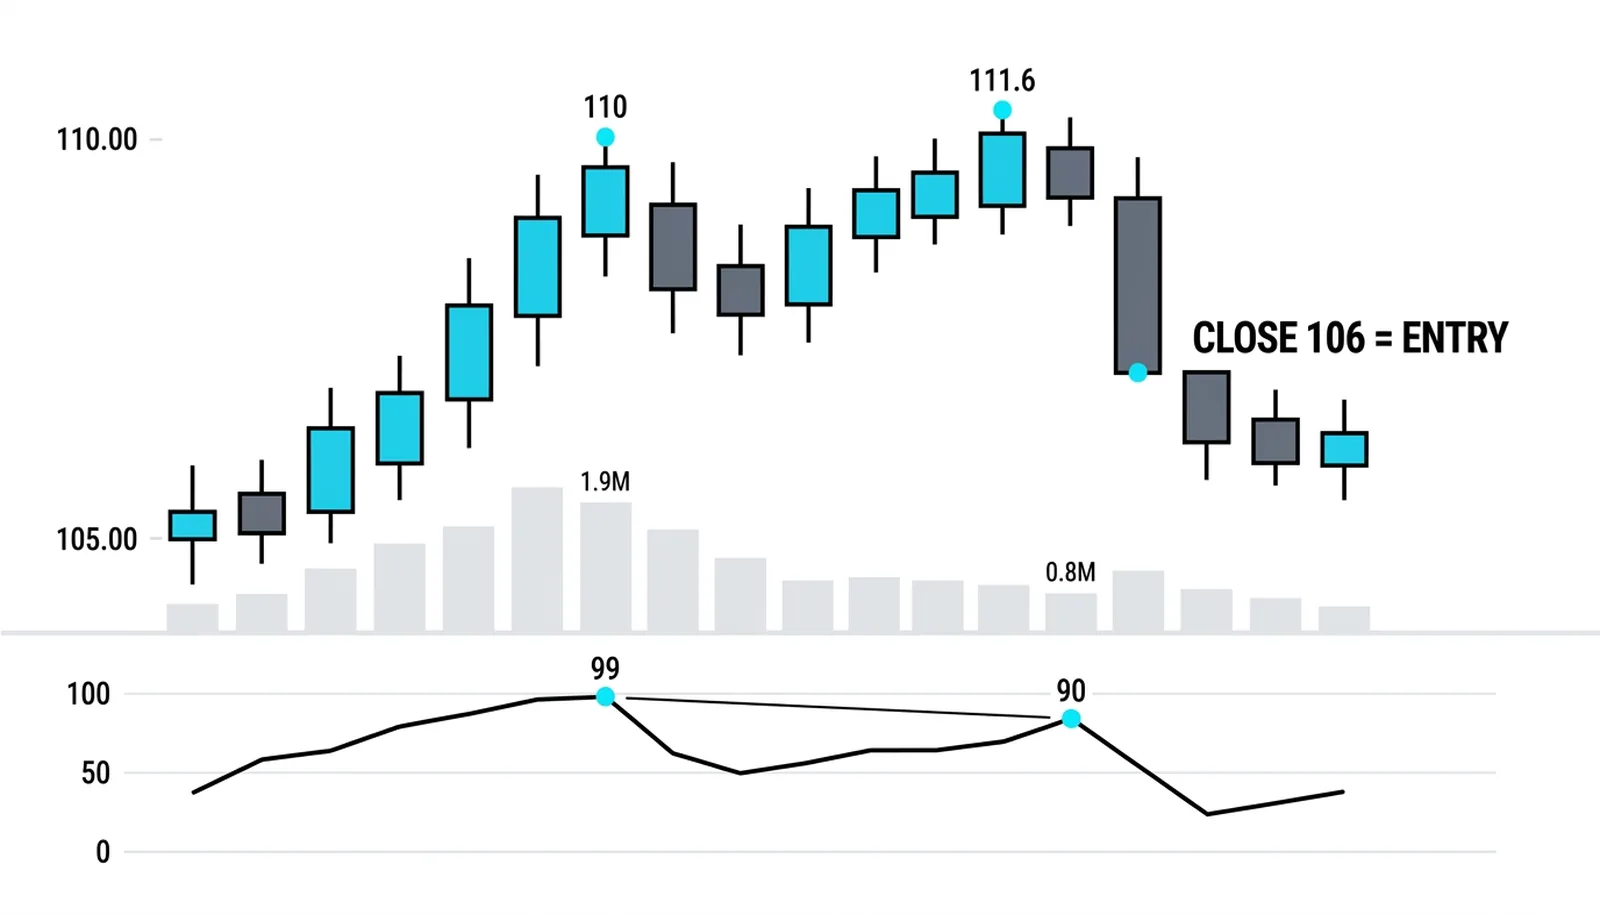
Leg one, context: an established advance lifts price from 105 to 110 on the first thrust, and the trend filter says longs only. Leg two, momentum: the second push reaches a marginal new high at 111.6 while RSI peaks at 90 against the 99 it printed on the first thrust, a divergence that says this push is costing more and delivering less. Leg three, evidence: volume on the second thrust averages 0.8 million shares against 1.9 million on the first, less than half the participation, so the new high arrived on thinning support. Leg four, permission: price closes at 106, back below the 111.6 swing, and only that close converts the warning into a short setup with the invalidation defined at the old high.
Read the sequence backward and the division of labor is visible: the trend filter banned shorts for the first half of the chart, the divergence raised the alarm, the volume gap corroborated it, and the structure break supplied the entry, the stop, and the timing in one bar. Every leg answered a question the others could not.
What Combination Cannot Fix
Layers do not add accuracy; they add coverage. A system with a trend filter, an oscillator, and volume still loses money in ranges, still whipsaws at trend transitions, and still needs position sizing and risk rules to survive its losing streaks. What the division of labor removes is a specific failure: mistaking the same signal three times for three independent confirmations. One tool, one job, one opinion, and a structure that tells the trader which question each number on the screen is answering.
Combining Indicators, Answered
How many indicators should a chart have?
As many as there are distinct jobs, which is usually three: a trend measure, a momentum measure, and volume. A fourth tool earns its place only when it answers a question the first three leave open. Anything past that is decoration, and decoration on a trading chart gets read as information.
Which indicators work best together?
Pairs that draw from different categories: a moving average with RSI, ADX with the stochastic, MACD with volume. The common thread is non-overlap. Two oscillators, however well regarded individually, are one instrument played twice.
Should indicators confirm each other before every entry?
They should each speak once, in their own language, on the same trade. A trend filter, a momentum trigger, and quiet volume agreeing is a complete case. Requiring a second oscillator to agree with the first does not strengthen the case; it just delays the entry until the move is older.
What is the simplest complete system to start with?
A long-term moving average for direction, one oscillator for pullback timing, and volume bars for participation, executed on a single timeframe with fixed risk per trade. It is not sophisticated, and that is the point: every added layer must justify itself against this baseline, and most never do.