Regular Divergence: The Reversal Signal
Price stamps a fresh high. The momentum oscillator, a few panels down, tops out lower than it did at the last high. One line up, one line down, and a whole school of trading grows out of that disagreement. Regular divergence is the reversal branch of the divergence family: it prints at swing extremes, it says the current move is running on fumes, and it has caught more tops and bottoms on real charts than any other momentum pattern. It has also burned plenty of traders who treated it as a guarantee. This lesson covers both halves: what the pattern says, and the drawing discipline that separates the real ones from the look-alikes.

The mechanism took shape in the universal divergence lesson: an oscillator normalizes momentum over a lookback, so when each new push in a trend extracts less momentum than the last, the oscillator's peaks step down while price's peaks step up. Regular bearish divergence is that declining series of peaks at the top of an uptrend. Regular bullish divergence is the same picture flipped at the bottom of a downtrend. The indicator does not matter much: the same event shows on RSI, on the stochastic, on MACD, because they all sample the same underlying quantity. What matters is where the pattern prints and how honestly you draw it.
The Two Reversal Patterns
Regular bearish divergence: price makes a higher high, the oscillator makes a lower high. The trend's latest push covered more price ground on less momentum than the previous push. Something that used to be easy, rising, has become effortful, and effortful trends end more often than effortless ones. The reading is sharpest after an extended, mature advance, which is why divergence hunting against a two-week-old trend produces nothing but false alarms.
Regular bullish divergence: price makes a lower low, the oscillator makes a higher low. Sellers pushed price to a fresh bottom but got less momentum for it this time. The panic is thinning out even as the price grinds lower, and bottoms built on thinning momentum fail more often than bottoms built on expanding momentum.
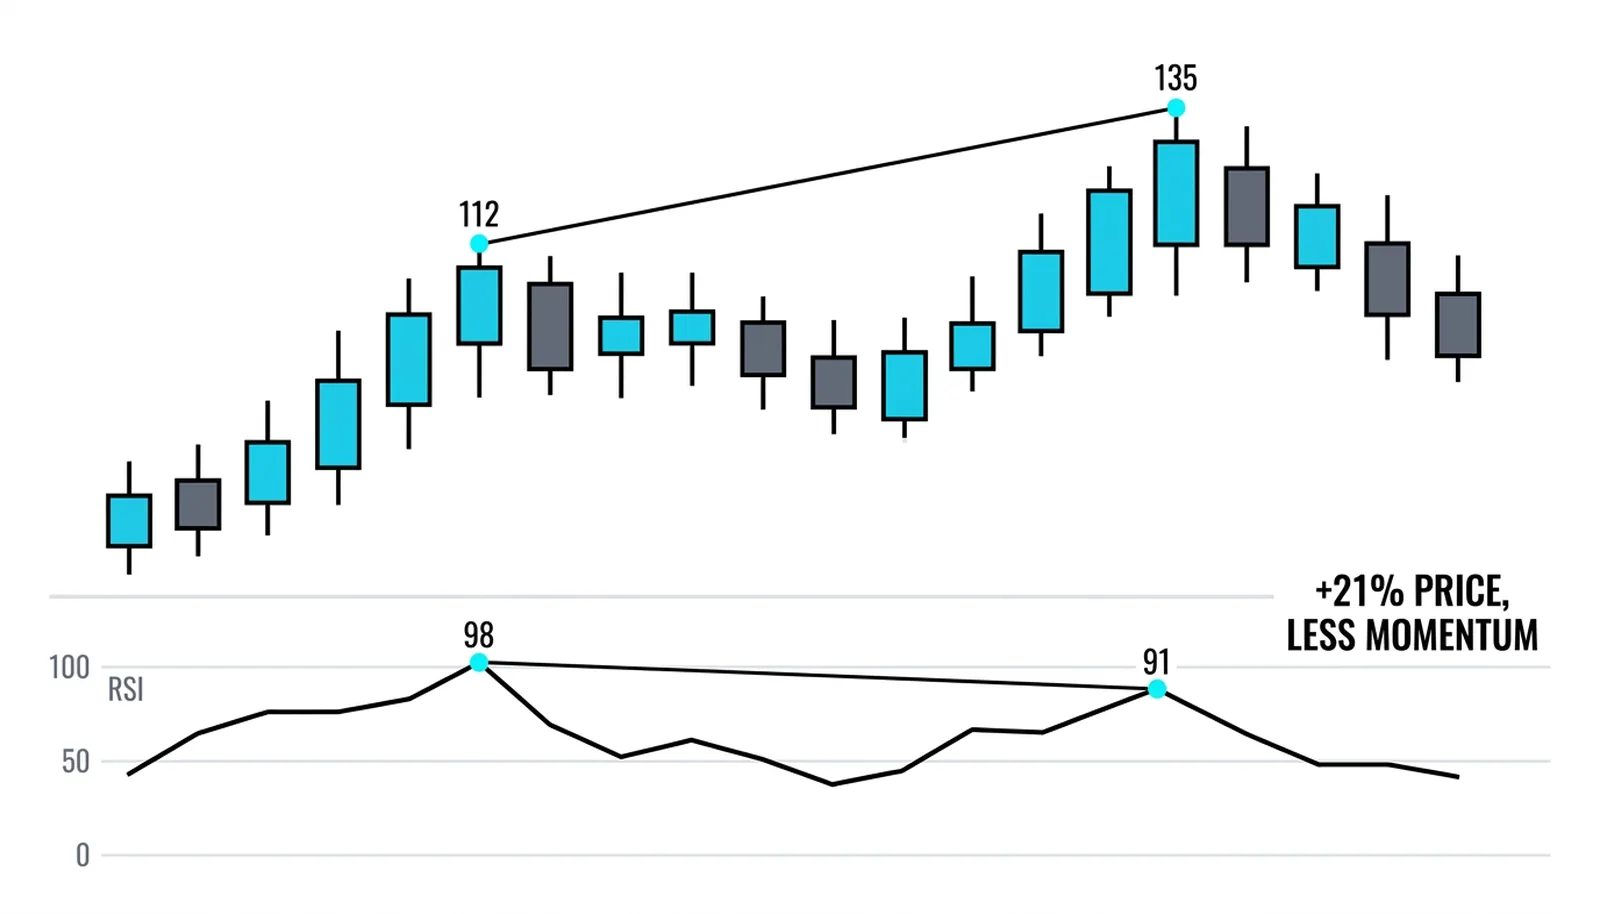
The anatomy chart shows a regular bearish case measured on the RSI. Price tops at 112 early in the advance, grinds sideways, then stretches to 135 on the final push: twenty-one percent of additional price. The RSI across those same two peaks falls from 98 to 91. The oscillator did not care that the second peak was higher; it cared that the climb there was older, more labored, and increasingly carried by fewer strong bars. That is the divergence, and no second indicator is needed to see it.
The Drawing Rules That Keep It Real
Divergence is a hand-drawn pattern, which means it is also a self-deceiving one: a hopeful eye can find it anywhere. The classic discipline, popularized across trading courses and worth following almost verbatim, comes down to a short list of checks.
First, only four scenarios qualify: a higher high, a lower low, a higher low, or a lower low than the previous major swing. Anything else is imagination. Second, connect major tops to major tops and major bottoms to major bottoms, never a top to a bottom, and ignore the minor bumps between the two swings. Third, the two oscillator points must sit under or over the two price points, vertically aligned in time; pairing a price high from Tuesday with an oscillator peak from last Thursday manufactures false signals. Fourth, the slopes must disagree. If the line on price and the line on the oscillator slope the same direction, there is no divergence, only two series trending together.
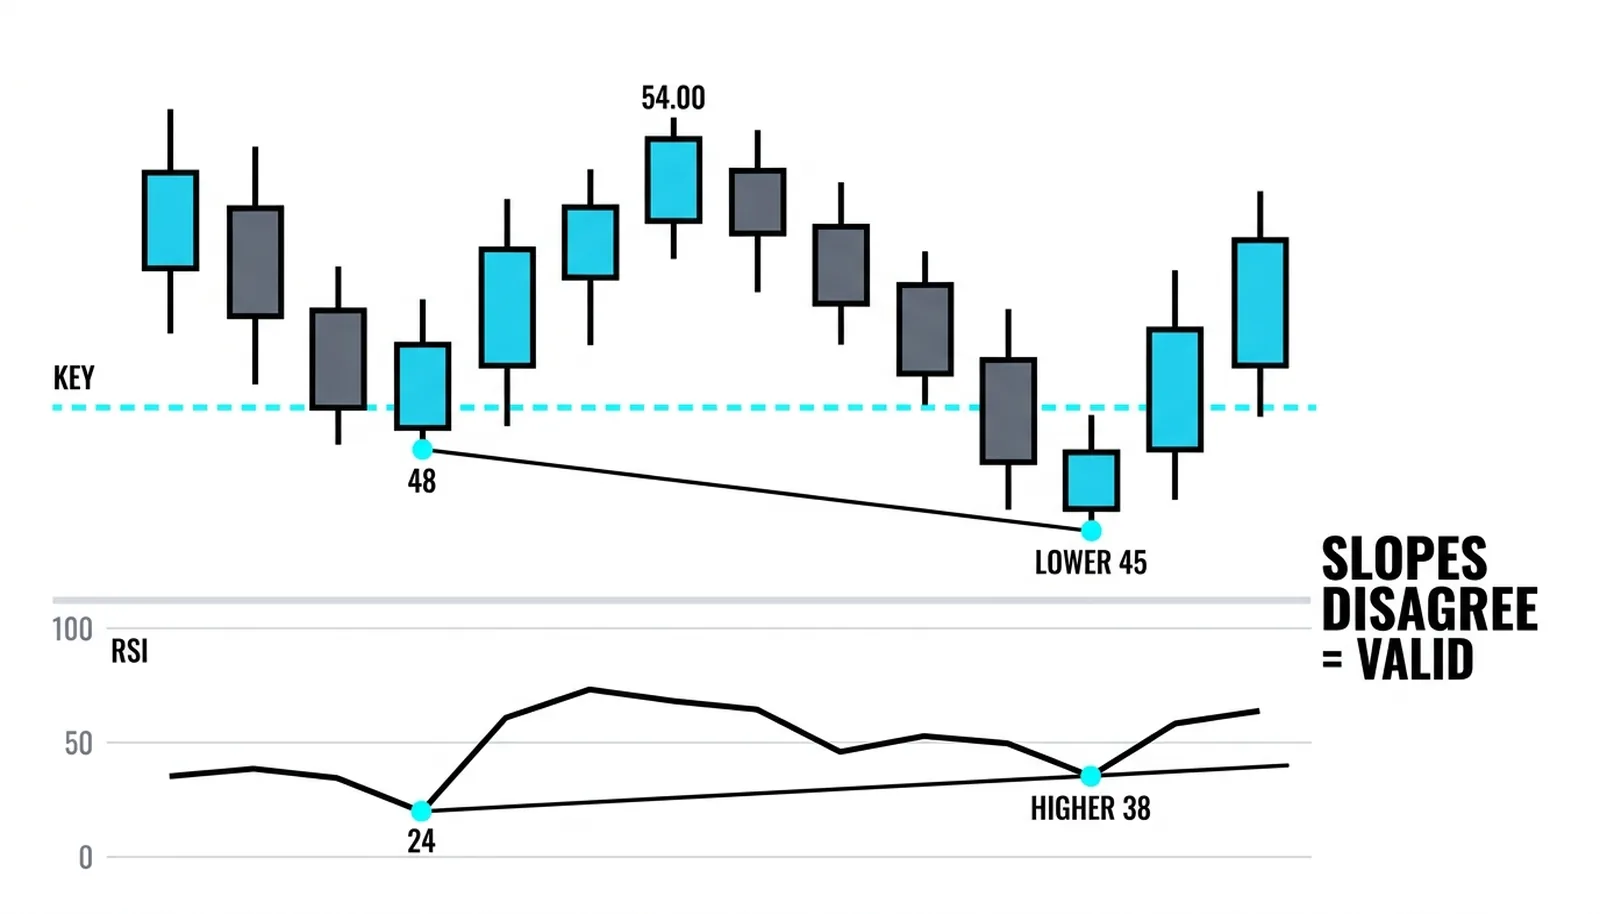
The slope chart shows a valid regular bullish case: price falls from one major low to the next while the RSI rises across the same two dates. Slopes in opposition, signal valid. Flip either slope and the signal dies: price and oscillator falling together is a healthy downtrend, price and oscillator rising together is a healthy uptrend. The slope check alone kills most of the false divergences people post online.
| Check | What it demands | What it blocks |
|---|---|---|
| Major swings only | Obvious pivots a stranger would mark | Divergences built on noise |
| Vertical alignment | Oscillator points under the same price points in time | Cross-date pairing that invents signals |
| Slopes disagree | Price line and oscillator line point opposite ways | Trending series misread as divergence |
| Not played out | Price has not already reversed and run | Acting on a signal the market consumed days ago |
The last check in the table earns its place. If price has already turned and traveled, the divergence is spent; the market consumed the signal while you were not looking, and chasing it means entering after the easy part of the move. Wait for the next swing to form and start over.
A Real Trade, End to End
A documented day trading case walks through a bearish divergence on TASR, a stock that had run to new 52-week highs. The setup stacked three conditions. Momentum: the stock printed a new all-time high at 33.45 while a short seven-period RSI reached only 72.35, far below the reading at the previous 52-week high, a clean regular bearish divergence by the drawing rules. Participation: the new high came on roughly a quarter of the volume of the prior push, so the move lacked the fuel that carried the last one. Trigger: the entry came only when price closed back below the prior 52-week high at 30.98, at which point the trade went short 2,000 shares at 30.27 the next morning.
Notice the order of operations. The divergence came first as a warning, the volume came second as evidence, and the price close came last as permission. None of the three would have carried the trade alone, and the trigger in particular meant giving up some profit in exchange for confirmation that the reversal was real. That trade-off, entries later but far more reliable, is the honest price of trading this pattern well.
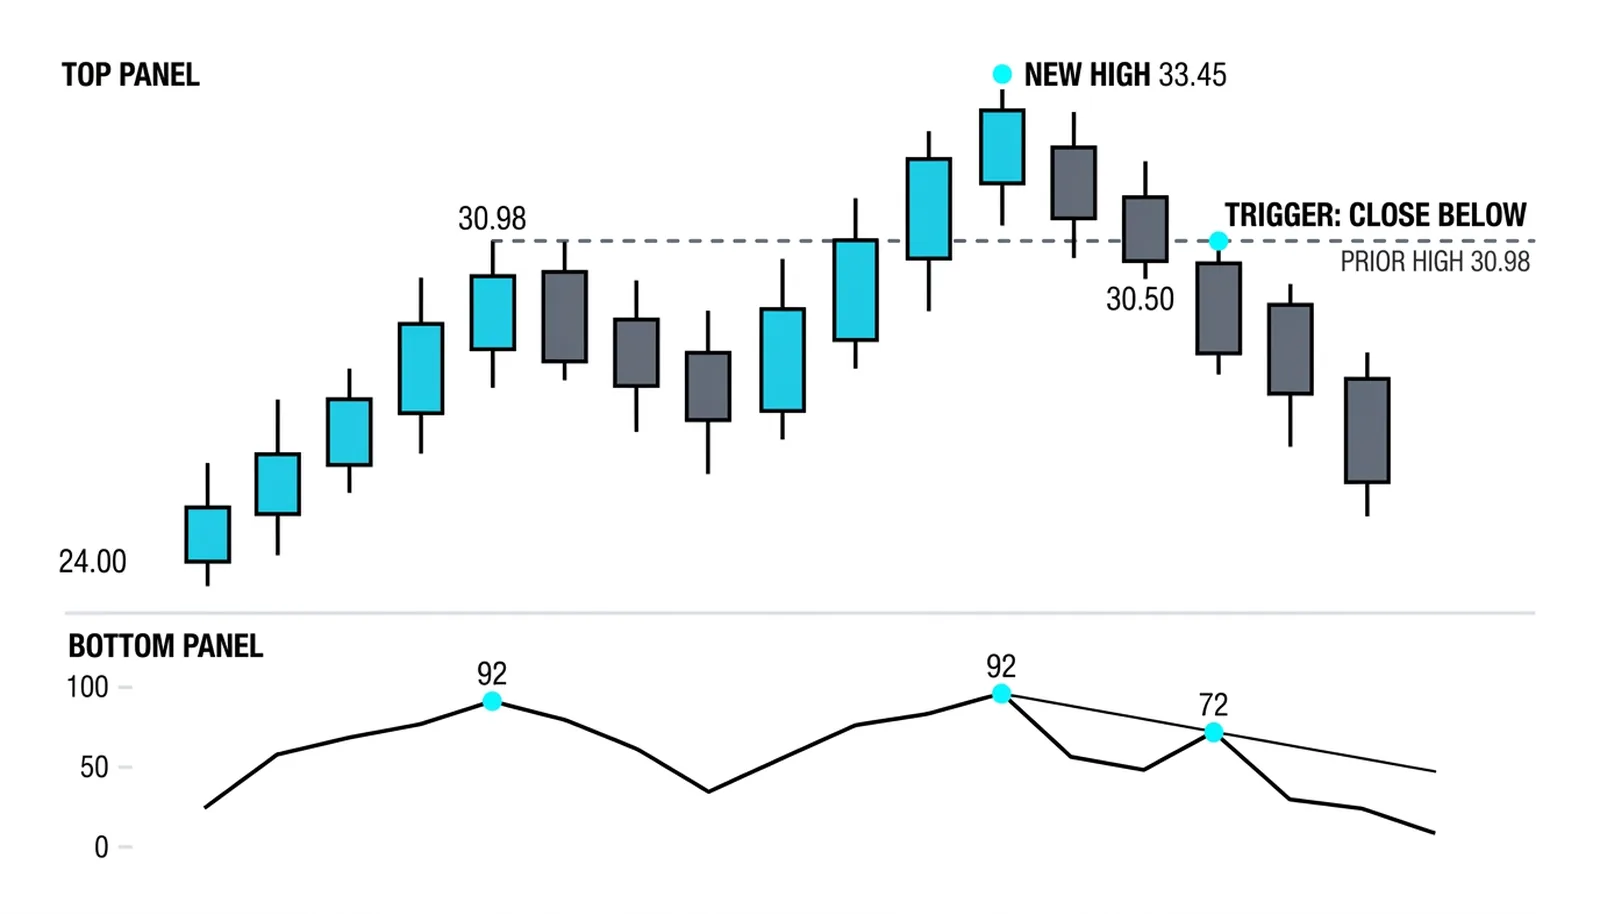
The schematic above compresses the same sequence onto one chart: a mature advance, a divergence at the final high, and then the close back below the prior swing high that turns the warning into a trade. The broken line at that high is the entire decision point. Above it, the trend is innocent; below it, with a divergence on record, the evidence is in.
Honest Limits
Regular divergence is an exhaustion reading, not a countdown. Trends can carry divergences for weeks: a momentum peak that steps down once often steps down again on the next push while price keeps rising, which is why the pattern requires the trigger, more than the mismatch alone. Timeframe changes the odds too. On daily charts and higher, divergences print rarely and mean more; on minute charts they print constantly and mostly describe noise. And the pattern says nothing about size. A lower oscillator high after a two percent grind reads the same as one after a blow-off top, and only the surrounding structure tells those apart. Where the trend actually turns, and what replaces it, is the subject of the trend lifecycle lesson; divergence is the early tell, not the full story.
The engine analogy lands here: an engine can rev harder while the car slows, and for a while the noise is impressive. Momentum indicators exist to catch exactly that divorce between effort and result. Regular divergence is the moment the revs and the road speed disagree; the trigger close is the moment the car actually stops. Trade the second, armed with the first.
Regular Divergence, Answered
Does regular divergence predict every reversal?
No, and the base rates matter. A divergence marks fading momentum, and many fading-momentum moments resolve as sideways consolidation rather than reversal. The pattern's job is to move the reversal from surprise to watchlist; the trigger, price breaking structure, is what converts the watchlist entry into a trade.
Which oscillator shows divergence best?
They all show it, because they all measure momentum over a lookback. RSI and the stochastic are the traditional choices; MACD works on smoother trends. The differences are threshold and smoothing, not truth. Switching indicators to find a divergence that one indicator does not show is curve-fitting, not analysis.
Why did my divergence fail?
The usual suspects: the pattern was drawn on minor swings or misaligned dates, the slopes actually agreed, the signal had already played out before entry, or the trend was too young for exhaustion to be a coherent idea. Every one of those is caught by the drawing checks above.
Can divergence be traded without a trigger?
As a position-building cue, sometimes: a trader scaling out of a winning trend trade can use a divergence as a reason to tighten stops early. As a standalone entry, no. The mismatch alone has no invalidation point, and a trade with no invalidation is an opinion, not a position.