Volume as Confirmation of Price Moves
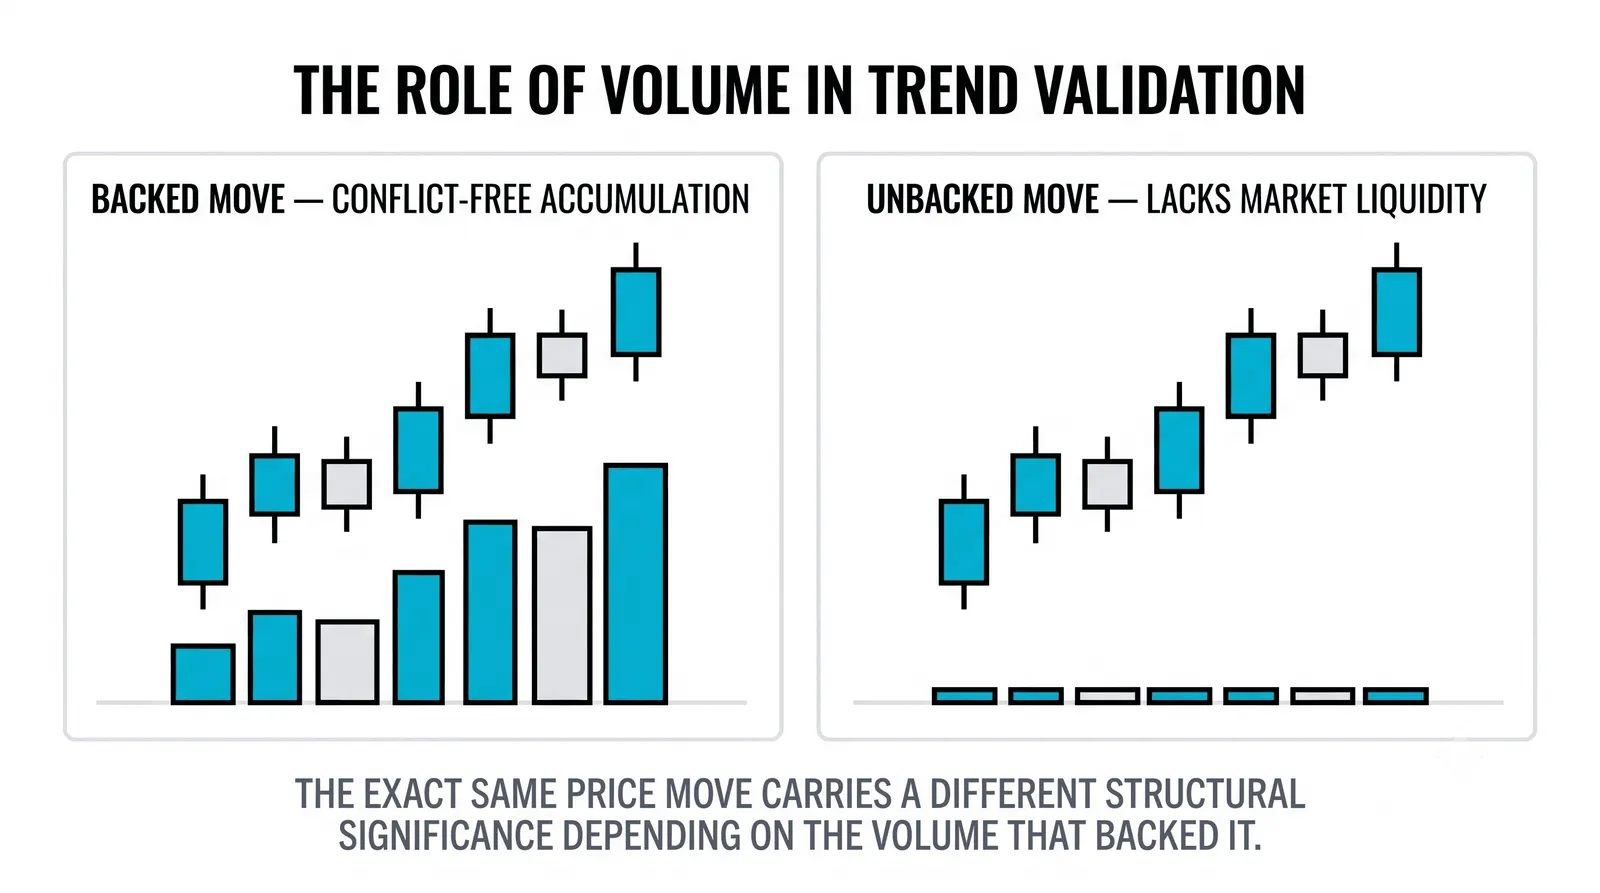
Volume is the number of shares or contracts that changed hands during a given period, and it acts as the confirmation test for price moves. A move backed by heavy volume shows real conviction behind it. The same move on thin volume is a question mark. Price tells you what happened. Volume tells you how many people agreed. If the candles themselves are still new, start with reading a basic price chart.

What Volume Actually Is
Every time a buyer and seller agree on a price, one unit of volume is recorded. Add up all those trades over a candle's time period and you get that candle's volume.
Most charting platforms draw volume as vertical bars along the bottom of the chart, one bar per candle. Tall bar, lots of trading. Short bar, quiet market. The color usually matches the candle, green for up, red for down, but the height is what carries the information.
Think of price as the direction a crowd is moving and volume as the size of the crowd. A street protest of ten thousand people means something different from ten people walking the same route.
One thing to get straight early: volume has no absolute meaning. Two million shares traded is enormous for a small-cap stock and a slow morning for a giant household name. Volume only makes sense compared to that asset's own recent average. Most traders keep a 20-period average of volume on the chart as a reference line. The wider picture of what the volume count is sits in what volume is and why it matters.
Confirmation: When Volume Agrees With Price
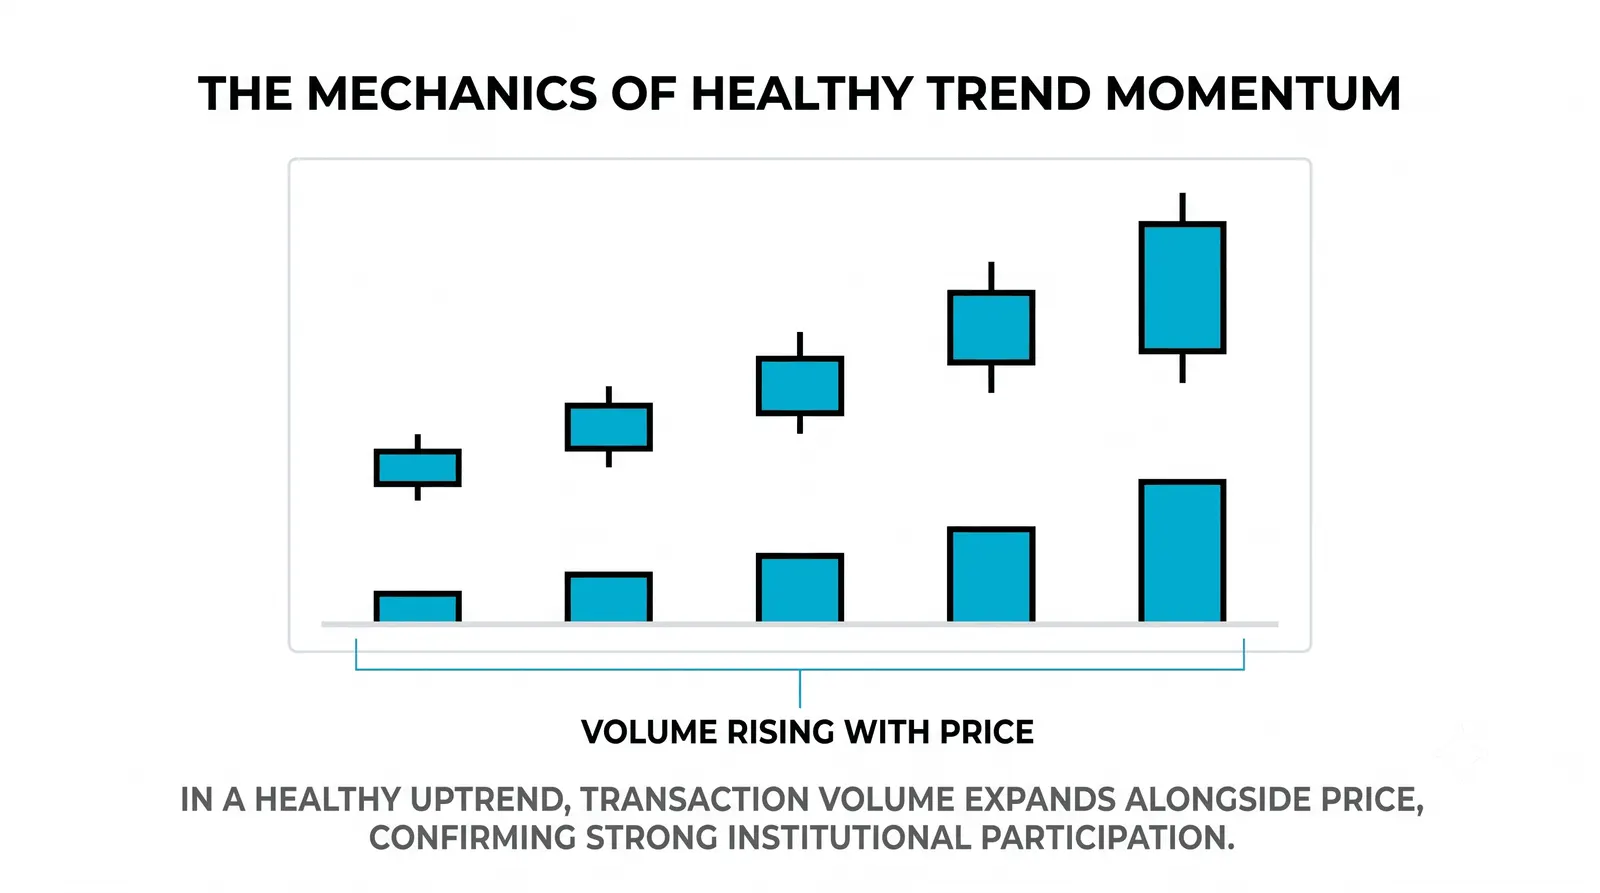
Confirmation means volume supports what price is doing. When both point the same way, the move has participation behind it, and participation is what keeps moves alive.
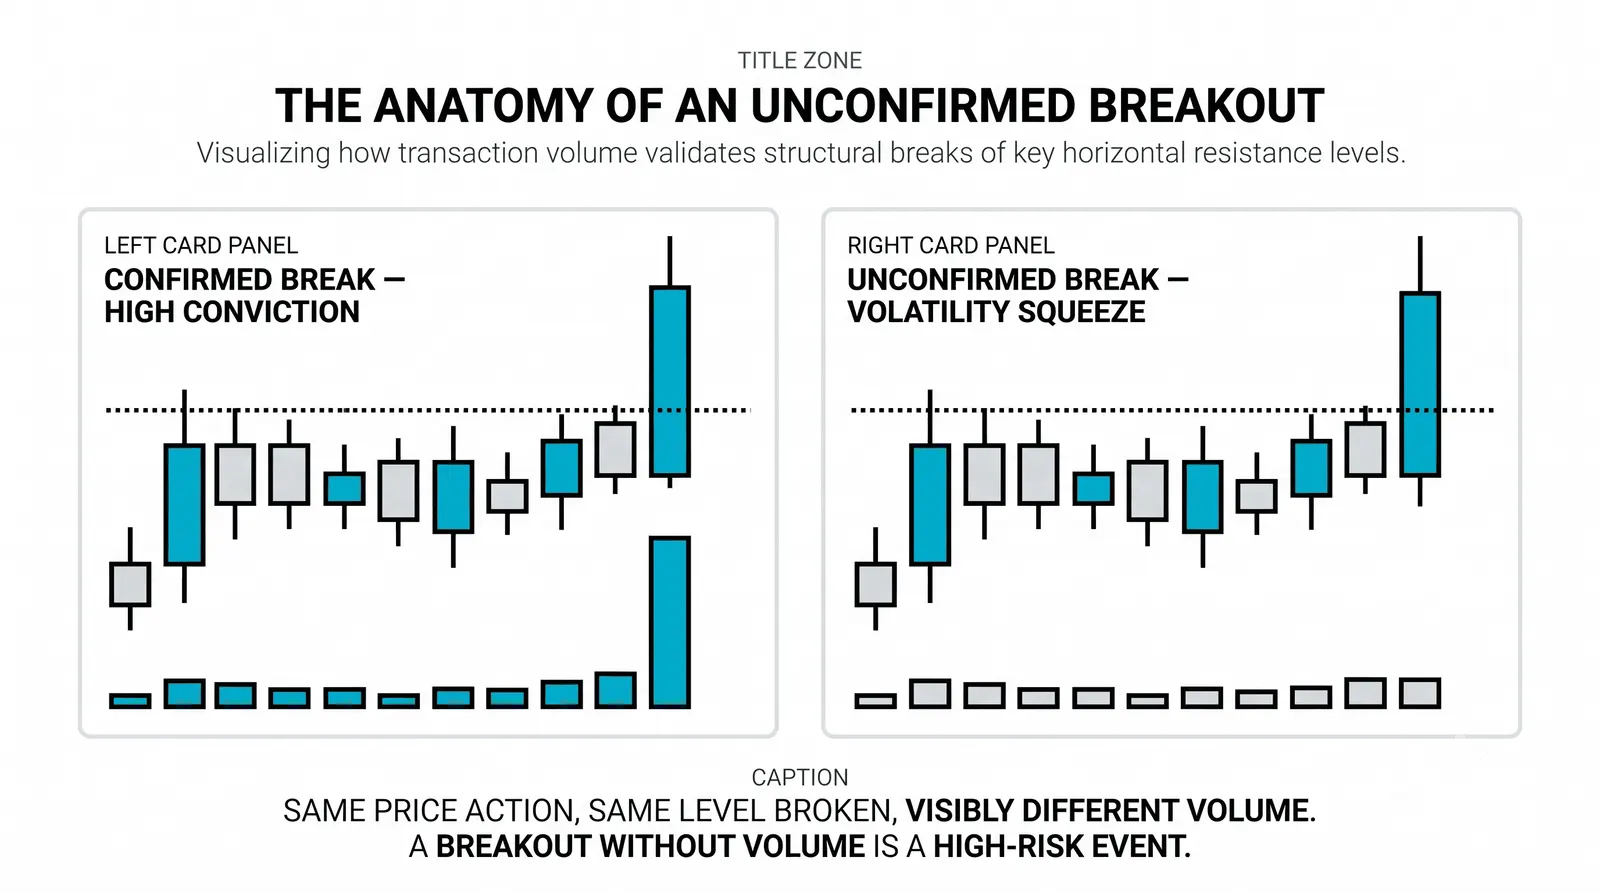
Say a stock has been stuck below 100 for weeks. Today it breaks above 100 and closes at 102, on three times its normal volume. That tells you real money showed up at the breakout. Buyers were willing to chase the price higher, and enough of them did it to matter.
Now picture the identical chart. Price breaks 100 and closes at 102, but volume is half of normal. Same price action, completely different message. Nobody showed up. The breakout happened because sellers stepped aside, not because buyers stepped in. Those moves fail often, because there is no crowd behind them to absorb the first wave of selling.
Price can lie. Volume makes lying expensive.
This is why experienced traders treat volume as a filter rather than a signal. They do not buy because volume is high. They check volume to decide whether a price signal deserves their money.
Divergence: When Volume Disagrees
Divergence is the opposite situation. Price keeps pushing in one direction while volume quietly drains away.
The classic pattern: a stock makes a new high, then another new high, then another. But each new high prints on a smaller volume bar than the last. The move is running on fewer and fewer hands. The buyers still in the game are carrying the price alone, and they are getting tired.
This does not mean the move reverses tomorrow. Trends can crawl higher on falling volume for longer than seems reasonable. What divergence tells you is that the move is fragile. When it breaks, it tends to break fast, because there is no depth of buyers underneath to catch it.
The same logic works in reverse. A downtrend making new lows on shrinking volume is running out of sellers. That is not a buy signal by itself, but it is a reason to stop pressing shorts and start watching for a turn.
A Worked Example
Here is a hypothetical with round numbers. A stock has traded between 95 and 100 for two months. Its average daily volume is 1,000,000 shares.
Scenario A: On Monday, price breaks above 100 and closes at 105. Volume for the day: 2,000,000 shares, double the average. The breakout attracted real participation. If you took the trade, your stop sits below 100, and the volume tells you the crowd is on your side.
Scenario B: Same setup, same close at 105. But volume is 400,000 shares, less than half the average. Price moved because the order book was thin, not because buyers piled in. Which breakout would you trust with real money?
Most traders who learn this lesson the hard way took Scenario B. The entry looked identical on the price chart. Three days later, price drifted back under 100 and the breakout failed. Scenario A might fail too, nothing is guaranteed, but the odds and the logic are clearly different.
Reading Common Price Events
The same high-versus-low volume logic applies to every common price event. Here is the quick reference.
| Price Event | High Volume | Low Volume |
|---|---|---|
| Breakout above resistance | Real participation, more likely to hold | Suspect, prone to failure |
| Pullback in an uptrend | Heavy selling, trend may be in trouble | Normal profit-taking, trend likely intact |
| New high in a trend | Fresh buyers, trend has fuel | Divergence, move is fragile |
| Sharp drop to new lows | Possible capitulation, watch for a turn | Sellers exhausted, but no buyers either |
Notice the pattern in the pullback row, because it trips up beginners. In a healthy uptrend, you want to see strong volume on the pushes up and light volume on the pullbacks. Heavy volume on a pullback means sellers are hitting the trend with force. That is a warning, not a buying opportunity.
Keeping Volume in Its Place
Volume is a supporting actor, not the lead. It confirms or questions what price does, but it never replaces the price signal itself.
A few ground rules keep you honest:
- Always judge volume relative to the asset's own average, never as an absolute number.
- Volume confirms direction; it does not create it. Wait for the price signal first.
- One unusual bar means little. Look for patterns across several bars.
- News events distort volume. Earnings day volume tells you less about conviction and more about the calendar.
Traders who treat volume as a standalone buy signal usually end up buying spikes that were just one large order filling. Context first, volume second, decision third.
Questions About Volume
What counts as high volume?
High volume is always relative to the asset's own average, not any fixed number. Compare today's bar to the 20-period average volume for that same stock, pair, or contract. A bar at 150 to 200 percent of average is meaningfully active. A bar at three times average is an event worth paying attention to.
Does volume data exist in every market?
No. Spot forex has no central exchange, so there is no true count of all contracts traded. What your platform shows is tick volume, the number of price changes from that broker's feed, used as a proxy. It is imperfect but surprisingly useful, because active periods produce more ticks. Stocks and futures on centralized exchanges report real volume.
Do reversals need volume too?
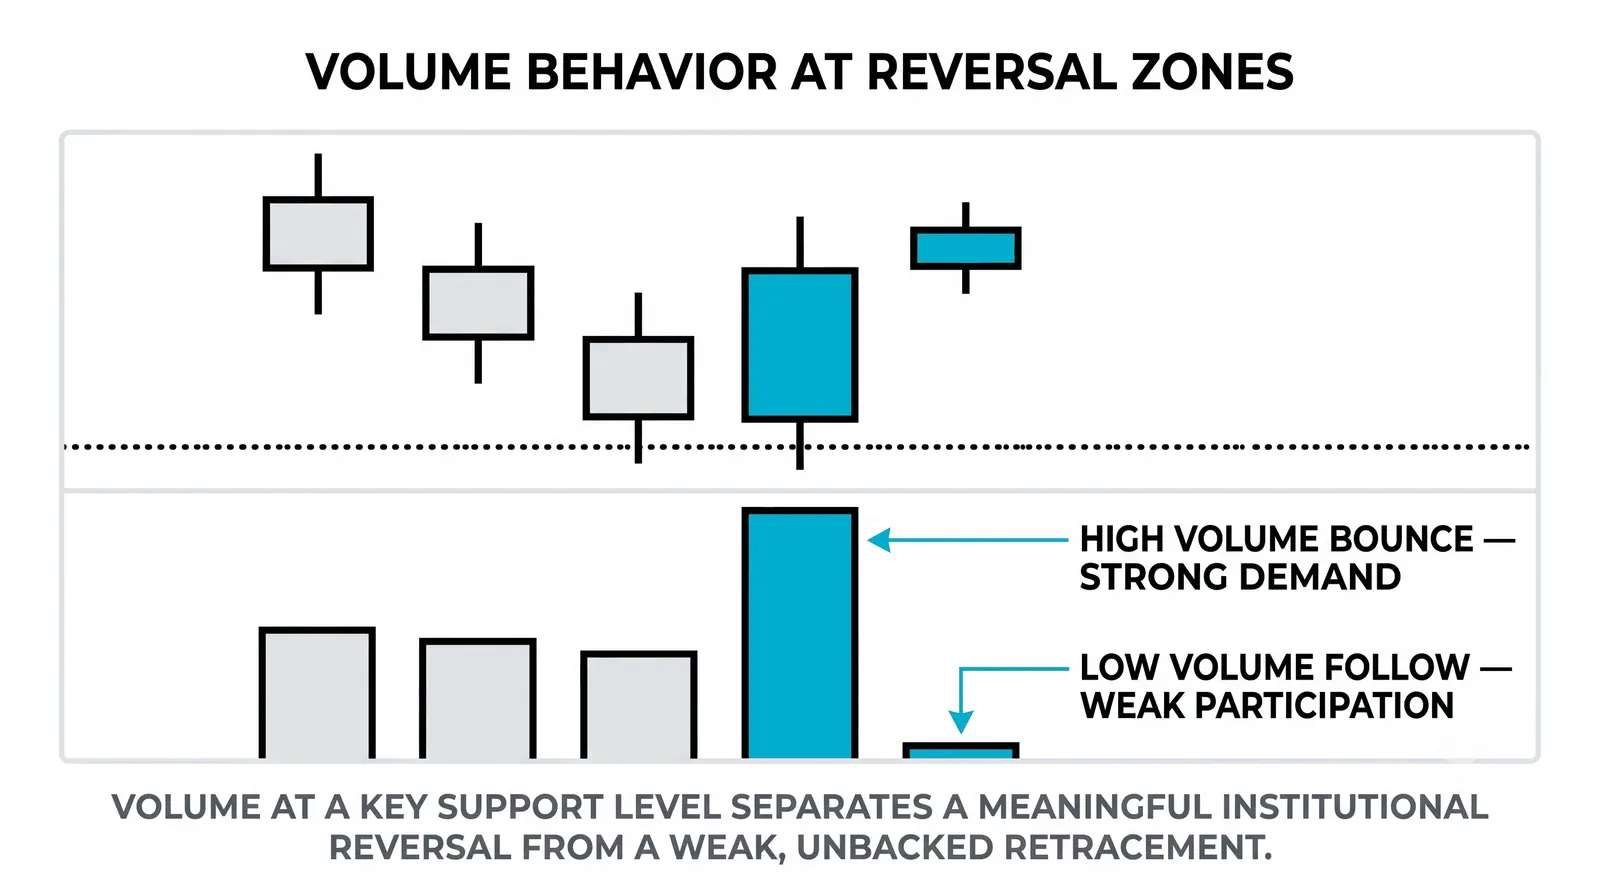
Yes, and often the biggest volume of all. Capitulation lows, where a falling market finally flushes out the last sellers, typically print enormous volume spikes. Blow-off tops do the same at the end of rallies. A reversal on quiet volume deserves the same skepticism as a quiet breakout.
Should I trade volume alone?
No. Volume confirms price; it does not replace it. A huge volume bar with price going nowhere tells you a battle happened, not who won. Always start with what price is doing at a meaningful level, then use volume to grade the quality of the move.
Next, put this into practice: pull up charts of recent breakouts, mark the volume on each, and track which ones held. Once that feels natural, study volume profile and how volume behaves at support and resistance, which is where this skill starts paying for itself.