Choosing Indicators for Your Trading Style
Choosing indicators starts with a question most traders skip: what decisions does your style actually require? A day trader and a position trader make different decisions on different clocks, so they need different tools. Copying someone else's chart copies their questions, never yours.
Decisions come first, tools second. A commuter picks a bicycle and a hauler picks a truck; same road, different job, and neither vehicle is the better one. Your style is the job description, and the indicator is the hire.
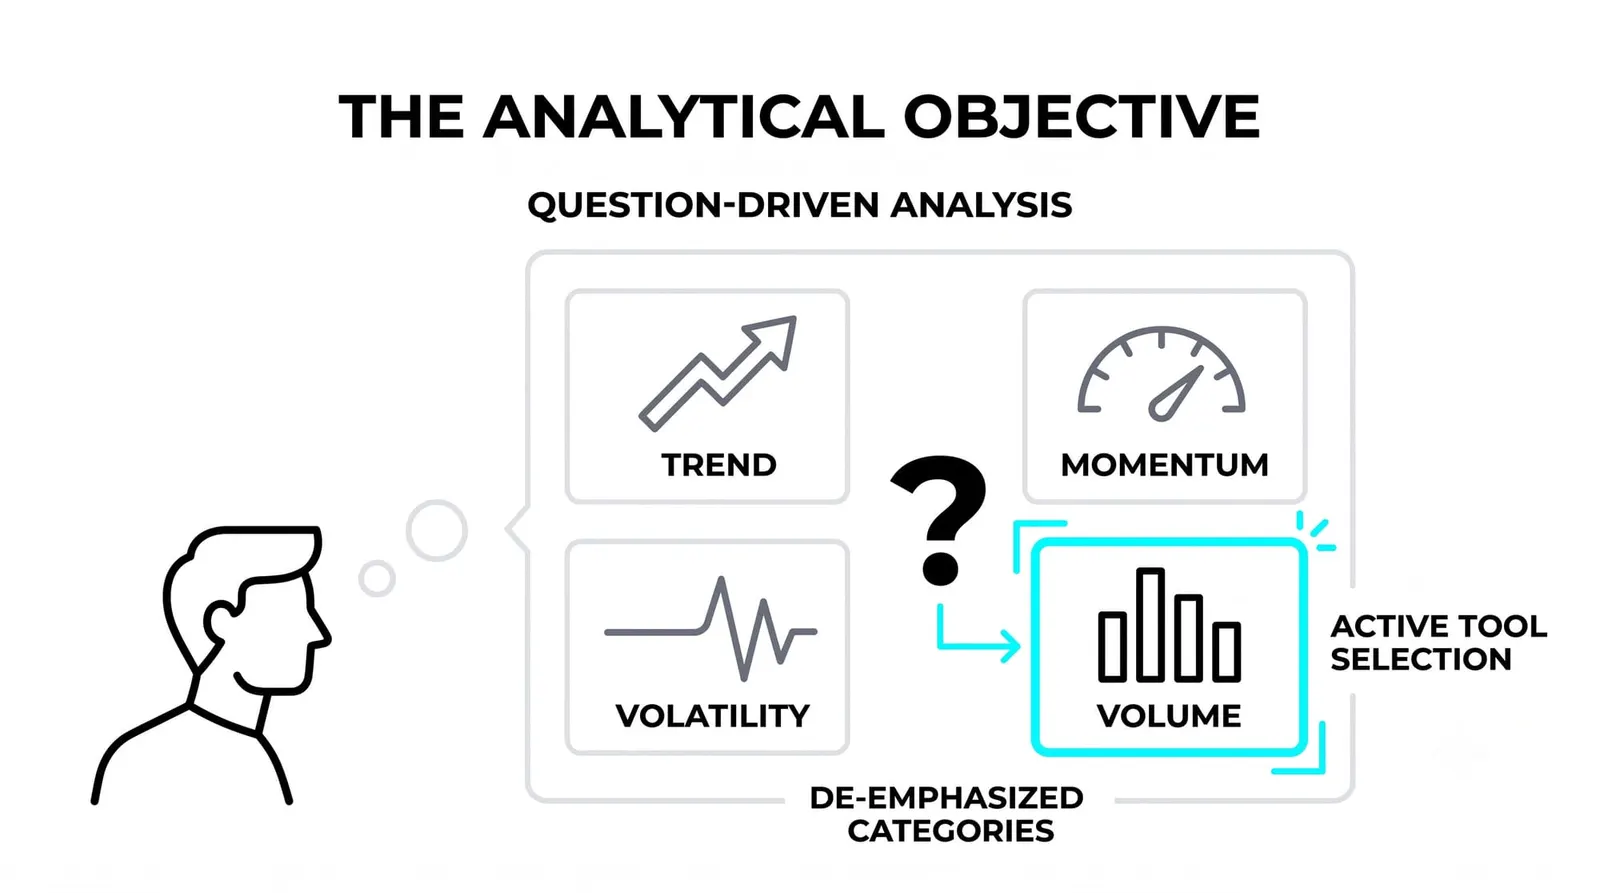
The four categories lesson sorted every tool into trend, momentum, volatility, and volume. That map is the menu this lesson orders from. And remember the split from the approach lesson: style sits on the approach side, upstream of any strategy you build.
Start From the Decisions, Not the Tools
Before you open an indicator menu, write down three answers. How long do you hold a position? How often do you make a decision? What would make you exit?
Those three answers define your style more honestly than any label. A trader who holds for weeks and decides twice a week has nothing in common with one who holds for hours and decides ten times a day. They should not share a chart layout.
Notice what is missing from that list: which indicator is popular, which one a mentor uses, which one looks impressive on a screenshot. None of those are your questions.
The style questions that actually pick tools look like this:
- Do I need to know the trend's direction, or its speed right now?
- Do I exit on a signal, on a level, or on time?
- Do I need early warnings, or confirmation after the fact?
- How much noise can I tolerate before I act on it?
Answer those, and the shortlist builds fast. Skip them, and you will collect indicators the way some people collect kitchen gadgets.
Match the Family to the Job
Fast decision clocks lean on momentum and volatility reads. If you decide within the day, you care about speed, stretch, and exhaustion. Tools like the MACD histogram and volatility bands speak that language.
Medium clocks, the swing trader holding days to weeks, lean on trend plus momentum. A moving average defines the path, and a momentum read times entries and exits along it. Two tools, two jobs, no overlap.
Slow clocks lean on long filters and regime reads. A position trader holding months wants to know whether the broad trend is intact and whether conditions favor being exposed at all. A long-period moving average often does that job alone.
One example per family from this level: trend is covered by the moving average family, momentum by the MACD histogram, volatility by band-type tools, and participation by volume. Each family answers a different question, which is exactly why matching family to job works.
The mistake is hiring a tool for a job it does not do. Asking a slow trend filter for day-trading entries is asking a truck to win a bicycle race.
The Timeframe Changes the Tool
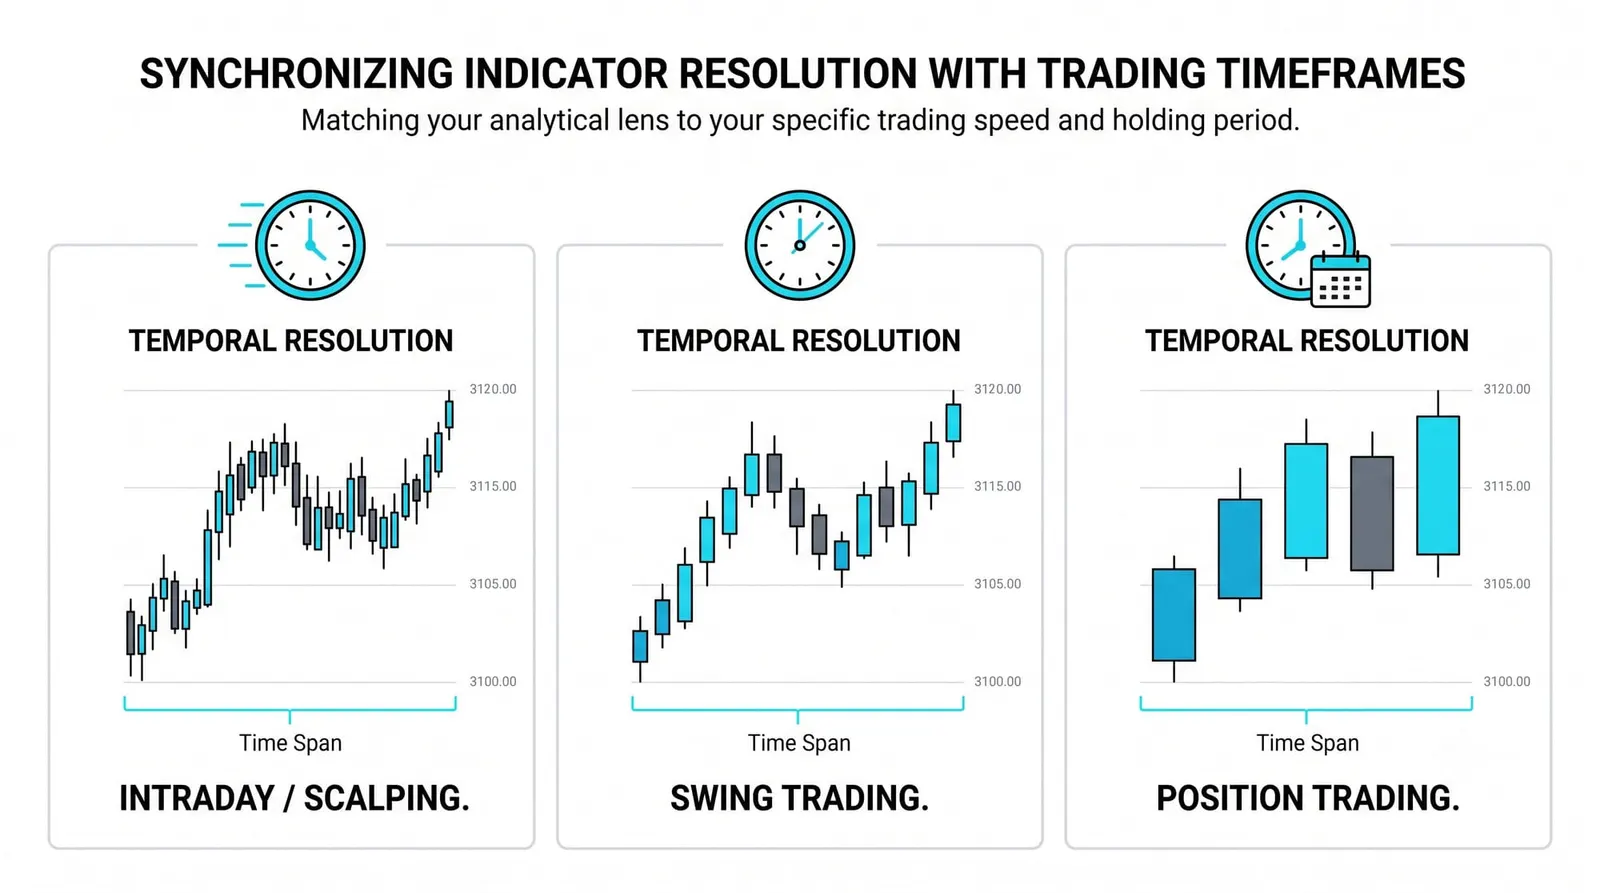
The same setting on a 5-minute chart and a weekly chart is a different instrument. A 20-period average on the first covers about two hours of trading. On the second, it covers twenty weeks. Same number, different meaning.
Default settings were tuned on daily charts. The classic 14, 20, 50, and 200 periods became standards because daily data was what most traders watched. They are conventions, not laws.
A 200-period average on a daily chart reflects roughly a year of trading. On an hourly chart it reflects about a month. On a weekly chart it reflects nearly four years. If you change timeframes without rethinking the setting, you have quietly changed the tool.
So when you read that a setting "works," always ask on which timeframe it was tested. The answer matters more than the number.
Test Before You Trust
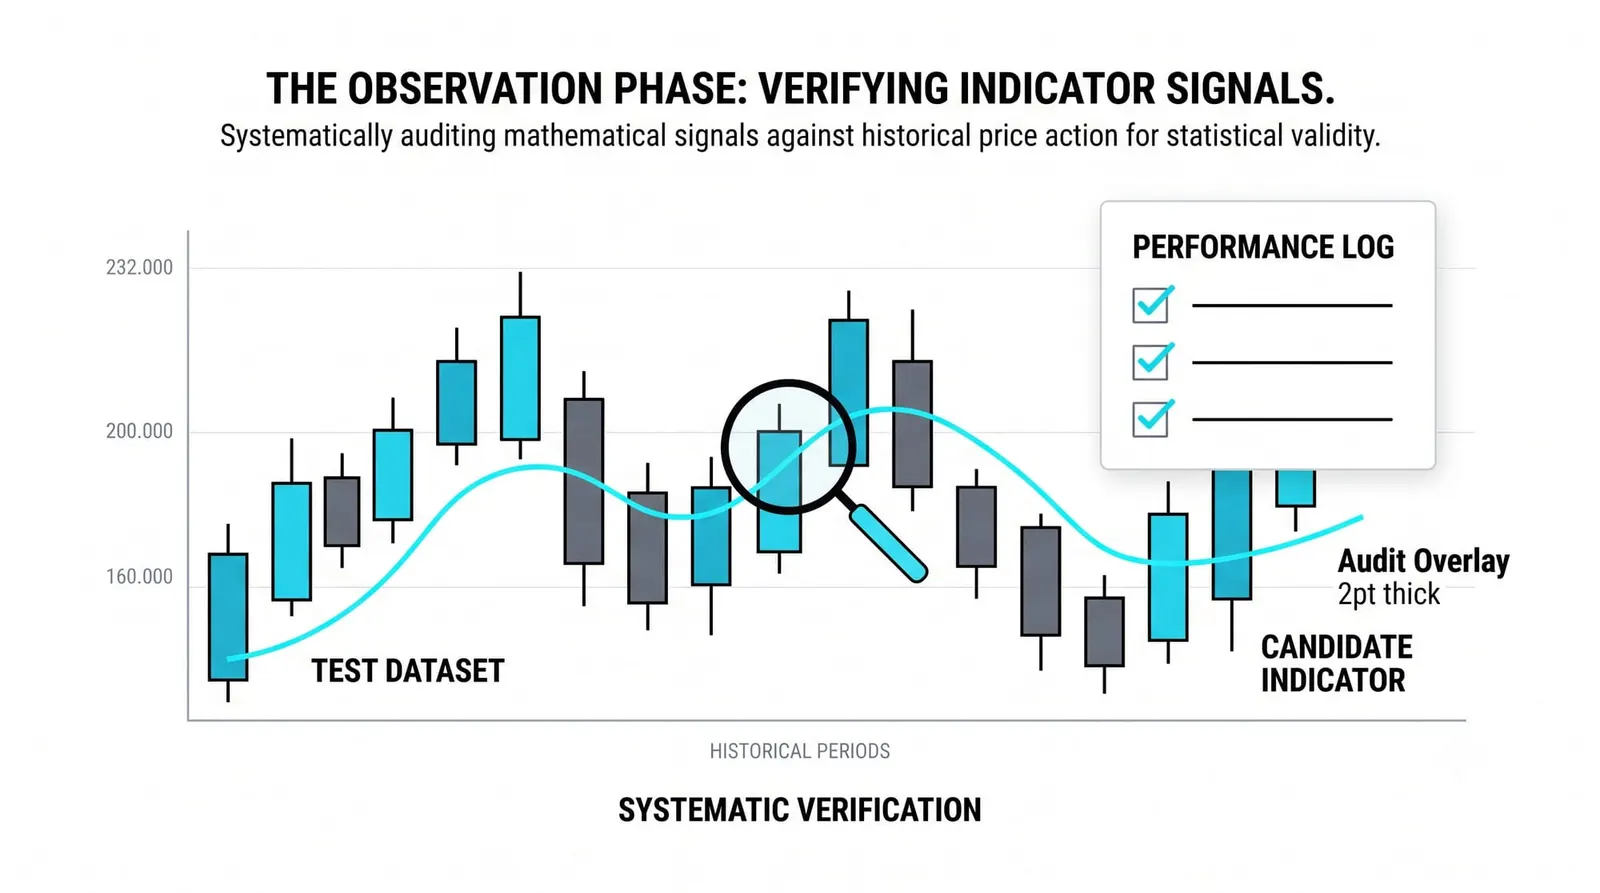
Here is a simple procedure. Take a chart of something you trade. Scroll back, then walk forward bar by bar with the indicator hidden, writing down what you would have done from price alone. Then reveal the indicator and walk the same stretch again.
Now ask the two honest questions. What decision did this tool actually change? And what did that change cost or earn me?
If the indicator changed nothing, it is decoration. If it changed decisions for the worse, it is worse than decoration. Keep it only if it changed a decision for the better, more than once, in a way you can explain in one sentence.
One warning: never judge a tool on a single stretch of chart. Every indicator looks brilliant in the conditions it was built for. Test it through a trend, a range, and a reversal before you trust it with a single unit of risk.
Two Traders, One Chart, Different Kits
Picture a stock that climbs from 40 to 58 over three months. The numbers are invented and round, purely for illustration.
The swing trader carries a 20-period moving average and the MACD histogram. They check the chart twice a week. They enter near 44 when price holds above the average and the histogram turns up, and they exit near 56 when the histogram fades and price loses the average. One trade, roughly twelve points, a handful of decisions.
The fast trader works the same chart on a smaller clock. They carry a 9-period EMA and a volatility band, and they decide daily. Inside that same climb, they take four separate moves: buying dips toward the fast average, exiting when price stretches outside the band, re-entering on the next pullback. Each move is smaller, but there are four of them.
Both kits are small. Both fit their clocks. The swing trader would drown in the fast trader's signals, and the fast trader would go mad waiting for the swing trader's exits. Neither needed the other's tools for a single decision.
Same stock, same three months, same direction. The difference was never the market. It was the questions each trader asked of it.
Styles, Clocks, and the Families That Fit
| Style and clock | Decisions it makes | Families that answer | Typical toolkit |
|---|---|---|---|
| Fast intraday clocks | Many decisions per day, exits within hours | Momentum and volatility | Fast EMA, volatility band |
| Swing, days to weeks | A few decisions per week | Trend plus momentum | 20-period average, MACD histogram |
| Position, months | Rare decisions, wide exits | Trend and regime filters | 50- and 200-period averages |
| Long horizon, years | Very rare, mostly allocation decisions | Regime and participation | Long averages, broad volume reads |
Choosing Indicators, Answered
Which indicator is best for day trading?
There is no single best one, because day trading still varies by clock and exit style. Fast momentum reads and volatility bands suit most intraday decisions, but the right pick is whichever one changes a decision you actually make each day.
Do long-term traders need indicators at all?
Strictly speaking, no; a long-horizon trader can run on structure and levels alone. A long-period average is still useful as a regime filter, a simple line that says conditions favor holding or standing aside.
Can two traders use the same indicator differently?
Yes, and they often do. One may use a moving average as an entry trigger, another as an exit line, a third as a filter that vetoes trades. Same tool, three different jobs, three different styles.
How do I know an indicator fits my style?
Run the hidden-then-revealed walk-through and ask what it changed. If it changed a real decision for the better, repeatedly, and you can say why in one sentence, it fits. If it only made the chart busier, it does not.
You now have a complete indicator layer: what the tools compute, the families, the settings, and how to choose among them. The next level puts the pieces together, turning your price action, structure, and chosen indicators into a written trading plan you can actually follow.