Building Your Own Indicator Toolkit
Your indicator toolkit is the short list of tools you keep after auditing everything this level covered, and the honest way to build it is by subtraction, not accumulation. A tool stays only if you can say in one sentence what it measures. It stays only if it answers a question your other tools leave open. And it stays only if you have watched it fail at least once and know the regime where that happens.

Think of a gardener who keeps three tools within reach because a full year of work proved them, while the shed of impulse gadgets stays shut. That is the posture you want. Most traders do the opposite. They add a tool after every losing week, and the chart slowly turns into a committee where every member hedges. A toolkit is not a collection. It is a list of survivors.
Two boundaries before the audit itself. The previous lesson, on combining indicators into one system, owns the division of labor on the chart, which tool handles direction, which handles timing, which confirms participation, so this lesson will not re-teach that. And an earlier lesson covered how to choose indicators for a trading style. Style-matching comes first. What follows is what happens to that shortlist afterward: the keep-or-discard decision per tool.
One more thing, stated plainly. An indicator you cannot explain is a liability even when its signals look good, because you will not know when it stops working.
The Four-Question Audit
Take every tool off your chart and put each one back only after it passes four questions. Do this on paper, not in your head. In your head, everything passes.
Question one: what does it measure, in one sentence? Not what the marketing page says. What it actually computes. "It compares the average size of up-closes to down-closes over fourteen bars" is an answer. "It shows momentum" is not. If you cannot produce the sentence, the tool fails here and the other three questions do not matter.
Question two: which question does it answer that the others do not? Every kept tool must own a question. If two tools answer the same question, one of them is decoration. RSI and stochastic, for most traders, answer the same question. Keeping both does not double your information. It doubles your confidence in one piece of information, which is worse.
Question three: in which regime does it fail, and have you actually seen it fail? Every indicator has a regime where it lies to you. Trend tools chop you up in ranges. Oscillators pin at an extreme for weeks during a strong trend. If you have never watched your tool fail, you have not owned it long enough to keep it. Paper-trade it through a bad stretch, or scroll back through history until you find the failure with your own eyes.
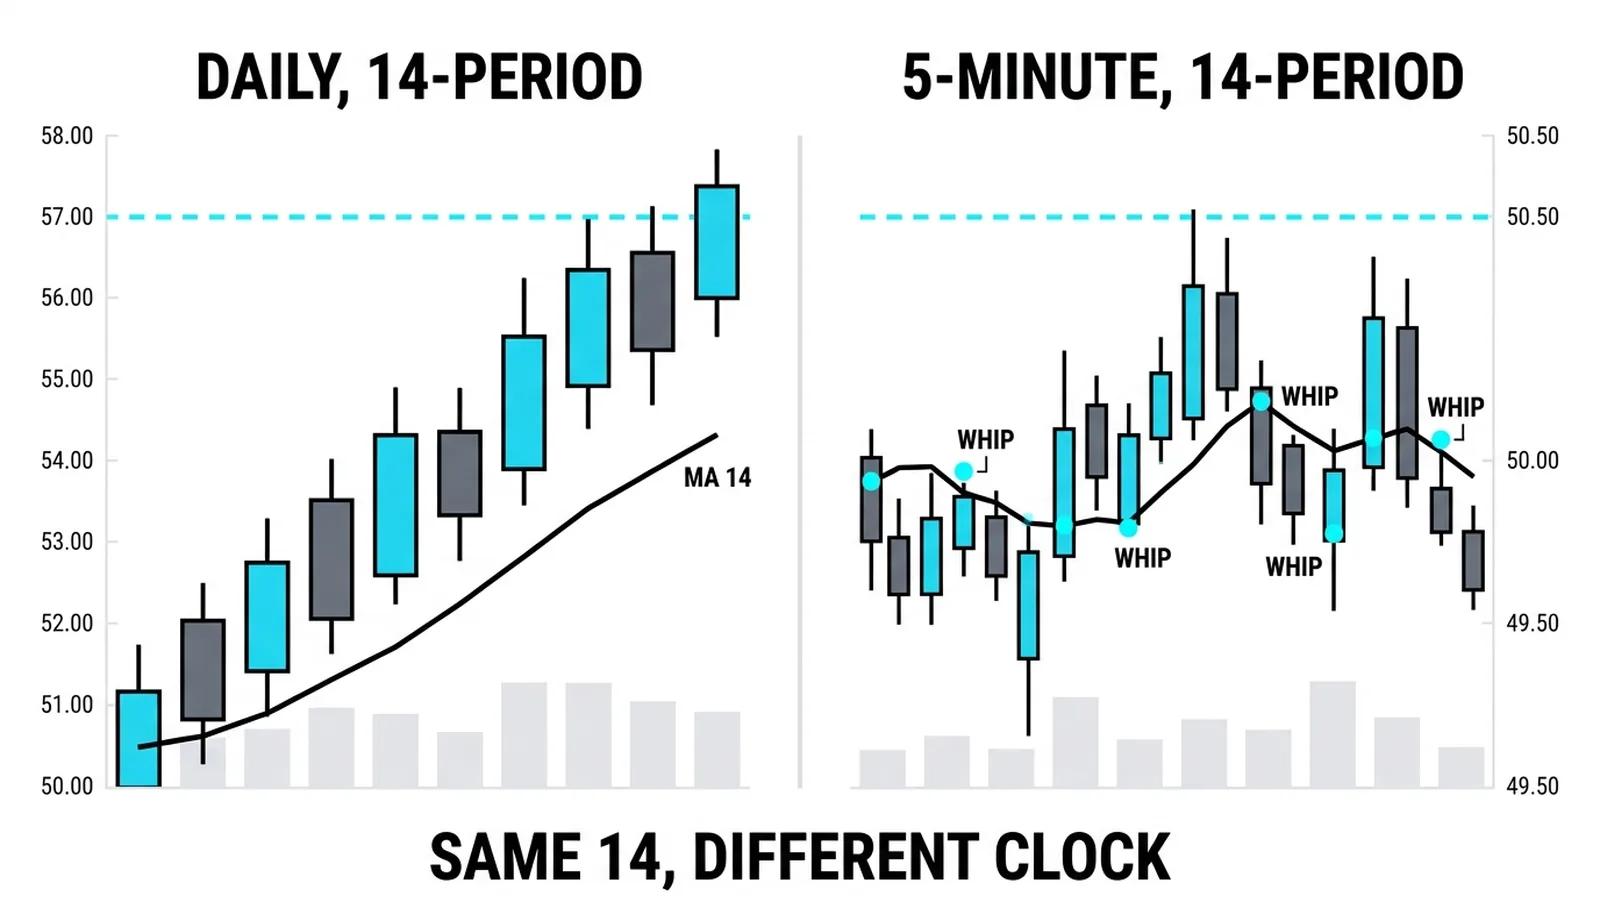
Question four: does its default setting match the clock you actually trade? A 14-period setting on a daily chart and a 14-period setting on a five-minute chart measure entirely different animals. Many traders run defaults designed for a timeframe they never touch. If the setting does not match your trading clock and you have no reasoned adjustment, that is a no.
Any single no means discard. Not "keep it in a corner of the chart." Discard. You can always re-audit it later.
What a Kept Tool Looks Like
A survivor has three properties. It has a stated job you could tell a stranger in one breath. It has a known failure mode you have personally witnessed. And its settings are matched to the timeframe you trade, with a reason you can give.
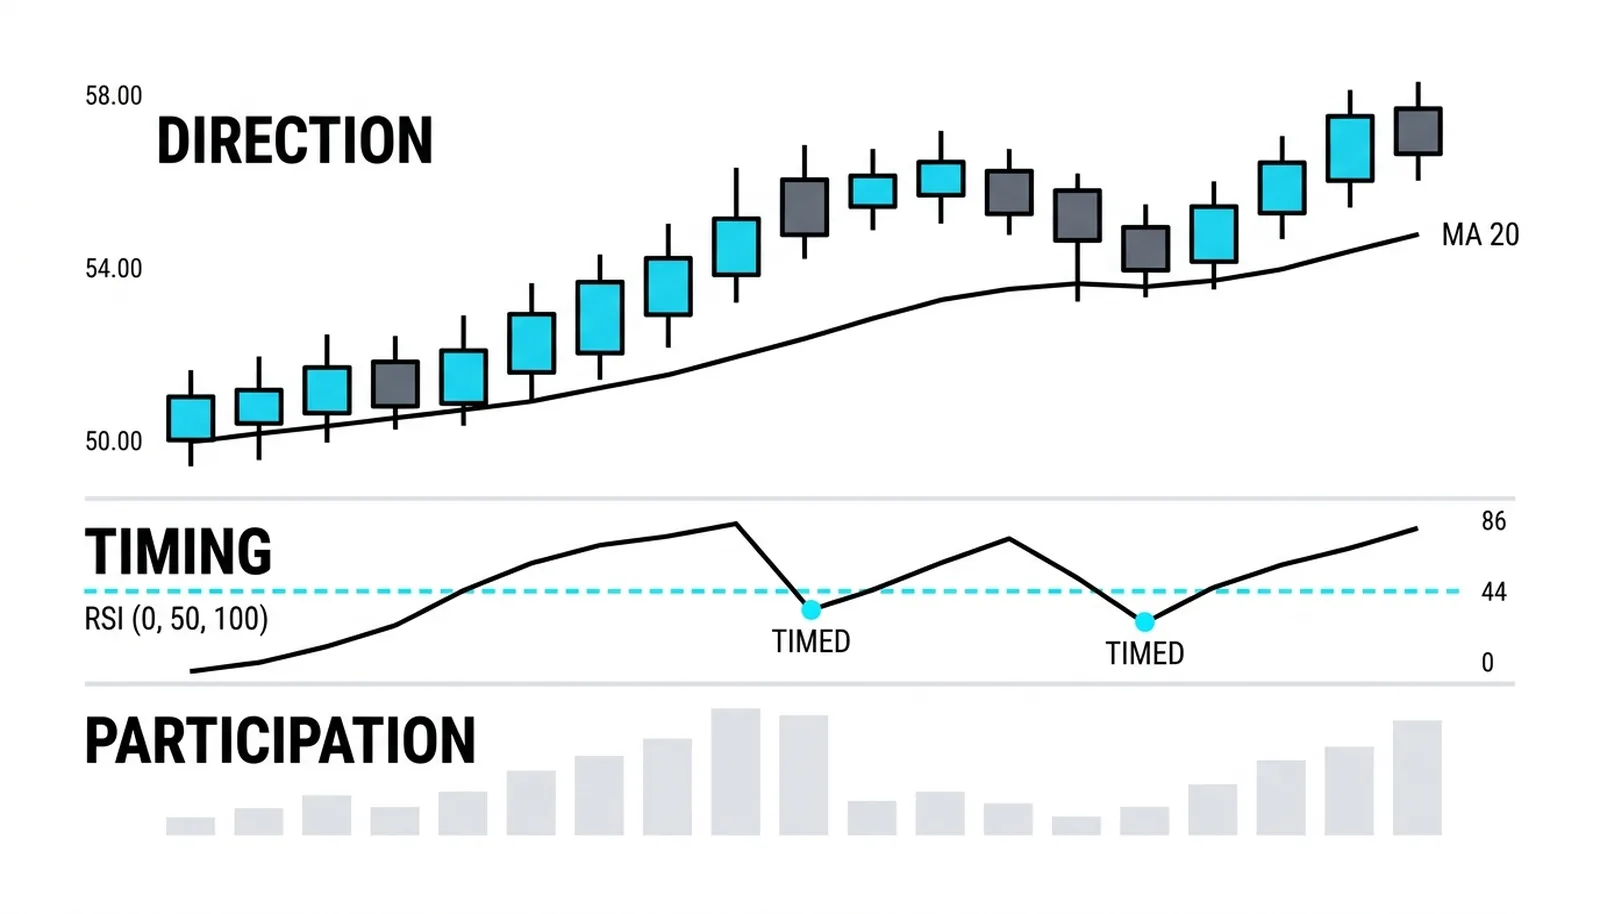
A healthy minimal kit is boring to look at. One trend measure tells you which direction has the wind. One momentum measure tells you when a pullback has likely run its course. Volume tells you whether participation backs the move. Price structure, the support and resistance work from Level 1, does the levels. That is four elements, and two of them are not even indicators.
Notice what is absent: anything whose job description starts with "it kind of confirms the other one." Confirmation from a redundant tool is an echo, and echoes feel like agreement.
What Gets Discarded, and Why That Is Fine
The discard pile has familiar residents. Overlapping oscillators go first, because three momentum readings on one chart are one momentum reading with three fonts. Tools kept for nostalgia go next, the first indicator you ever learned, the one from a video that once made you money. Sentiment is not a measurement. Then the tools whose settings you never touched, because untouched settings mean you never engaged with what the tool computes. Finally, the indicators you check out of anxiety rather than plan, the ones you glance at only when a trade feels wrong, hoping for permission to exit.
Discarding is not losing information. Redundant tools add lag, because you wait for the slowest one to agree, and they add false confidence, because agreement among copies feels like consensus. A smaller toolkit makes you faster and more honest at the same time. That trade is almost always worth making.
The Toolkit Changes With the Trader
A toolkit is versioned, like software. When your timeframe shifts, your settings must shift with it, and sometimes a tool that passed the audit on the daily chart fails it on the hourly. That is normal. Re-run the four questions whenever your trading clock changes.
Revise a few times a year at most, on a schedule, not in reaction. Weekly churn means you are not auditing tools; you are trading your indicators instead of the market. Each revision should have a written reason: the regime changed, my timeframe changed, or I finally saw this tool fail and understood why.
Rebuilding your toolkit after every losing streak is the fastest way to never learn any tool. A tool you abandon at its first failure is a tool whose failure regime you will never map. Stay long enough to know the failure, then decide.
One Toolkit, Audited
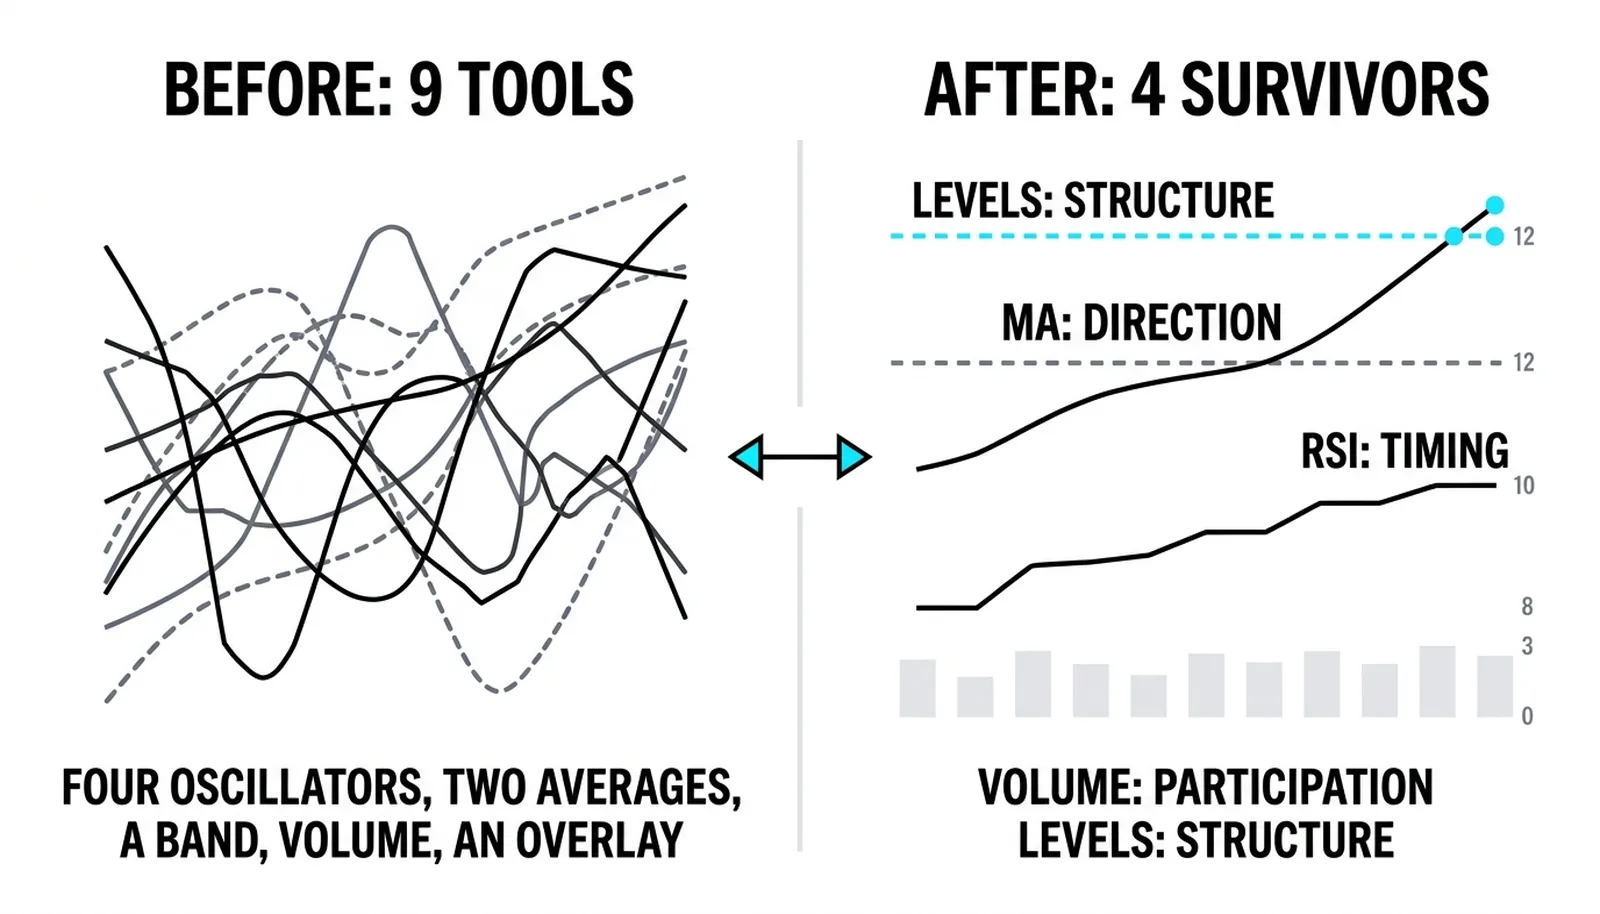
Here is a hypothetical walkthrough with round numbers. A trader starts with nine tools on the chart: four momentum oscillators, two moving averages, a volatility band, volume, and a pattern overlay. They run the four-question audit on each.
The four oscillators all answer the same question, so three are discarded immediately and the fourth, RSI, survives because the trader can state its formula and has watched it pin above 70 for weeks during a strong trend. One moving average is dropped as redundant; the 20-period average stays for direction. The volatility band goes, because the trader never adjusted its settings and could not answer question one. The pattern overlay goes, kept only for nostalgia. Volume stays. Price levels stay, doing the entries and stops.
Five elements remain, each with a one-sentence job and a known failure regime:
| Tool | One-sentence job | Regime where it fails | What the trader does then |
|---|---|---|---|
| 20-period moving average | Shows the prevailing direction of the swing | Sideways ranges, where price whipsaws across it | Stands aside or switches to range levels only |
| RSI | Times entries when a pullback loses momentum | Strong trends, where it pins at an extreme | Ignores the extreme reading and waits for structure |
| Volume bars | Confirms whether participation backs a move | Thin sessions, where readings are noise | Halves position size or skips the signal |
| Price levels | Sets entries, stops, and targets | Fast news-driven breaks through levels | Waits for a retest instead of chasing |
Nine tools became four indicators plus structure, and nothing of value was lost. The trader now knows what each survivor says, when to distrust it, and what to do in that moment. That is what finished looks like.
The Indicator Toolkit, Answered
How many indicators should a toolkit have?
Most traders land between three and five, and anything beyond that usually means two tools are answering the same question. The right number is the smallest set where each tool owns a question the others cannot answer. If you can remove one and lose nothing, remove it.
How often should I revise my toolkit?
A few times a year at most, on a schedule or when your timeframe changes. Revision should follow evidence, not emotion. If you are revising after every losing week, you are reacting to noise, and no tool will ever stay long enough for you to learn its failure regime.
Should I discard an indicator after it gives a losing signal?
No. A losing signal is not a failing tool; it is a tool operating in a regime, possibly the one where it is known to be weak. Discard only when the tool fails an audit question, or when losses arrive in the regime where it was supposed to work. Single trades prove nothing about a tool.
What is the first indicator a beginner should keep?
A single moving average, because its job is easy to state and its failure mode is easy to see. Watch it through one trending stretch and one ranging stretch, and you will have done more real audit work than most traders do in a year. Everything else gets added only after that first tool is genuinely understood.
With Level 8 closed, your chart should be quieter than when you started, and that quiet is earned. Keep the strategy ceiling in view, though: tools pass audits, but the strategy layer is still yours to build. Level 9 turns to volume analysis, beginning with how to read what participation is actually telling you before price makes it obvious.