The ZigZag Indicator: Mapping Swings
Strip the noise out of a chart and something honest appears: the swings. The ZigZag indicator does exactly that. It ignores every move smaller than a threshold you set, five percent by default on many platforms, and connects only the significant tops and bottoms into a single line. What remains is the skeleton of the trend, the highs and lows that traders actually mean when they talk about swing structure.

The picture that explains it is a connect-the-dots puzzle. The dots are real, they come from the price data, but which dots get connected and in what order is decided by a rule, and here is the catch that separates people who use this tool from people who trust it too much: the last dot can move. The line is drawn after the fact, and its final leg redraws until the market confirms the swing is over. That single property shapes everything this lesson covers.
Swing structure is the same raw material behind support and resistance and its finer points in the deep dive; the ZigZag just draws it for you, with one unambiguous rule instead of eyeball judgment. It also feeds the pattern in the divergence lesson, where swing comparisons are the whole game.
The Rule: One Threshold, Two Jobs
The mechanics are deliberately simple. The line follows price while price runs in one direction. When price reverses by more than the threshold, five percent say, the line snaps a pivot at the extreme it just left and starts following the new direction. A move smaller than the threshold is treated as noise and ignored entirely.
| Setting | Behavior | The trade-off |
|---|---|---|
| Small deviation (2 to 3%) | Many swings, short legs | Detail at the cost of noise; small wiggle-backs count as swings |
| Medium (5%) | The platform default feel | Usable structure on most daily charts |
| Large (10% and up) | Few swings, long legs | Only the major moves survive; smaller trends vanish |
The threshold is the full settings conversation. There is nothing else to tune: no period, no smoothing choice. Raise the number and the chart keeps only the big story; lower it and the chart starts narrating every subplot. The right value depends on the volatility of the market, since a five percent swing means something different on an index and on a single volatile stock.
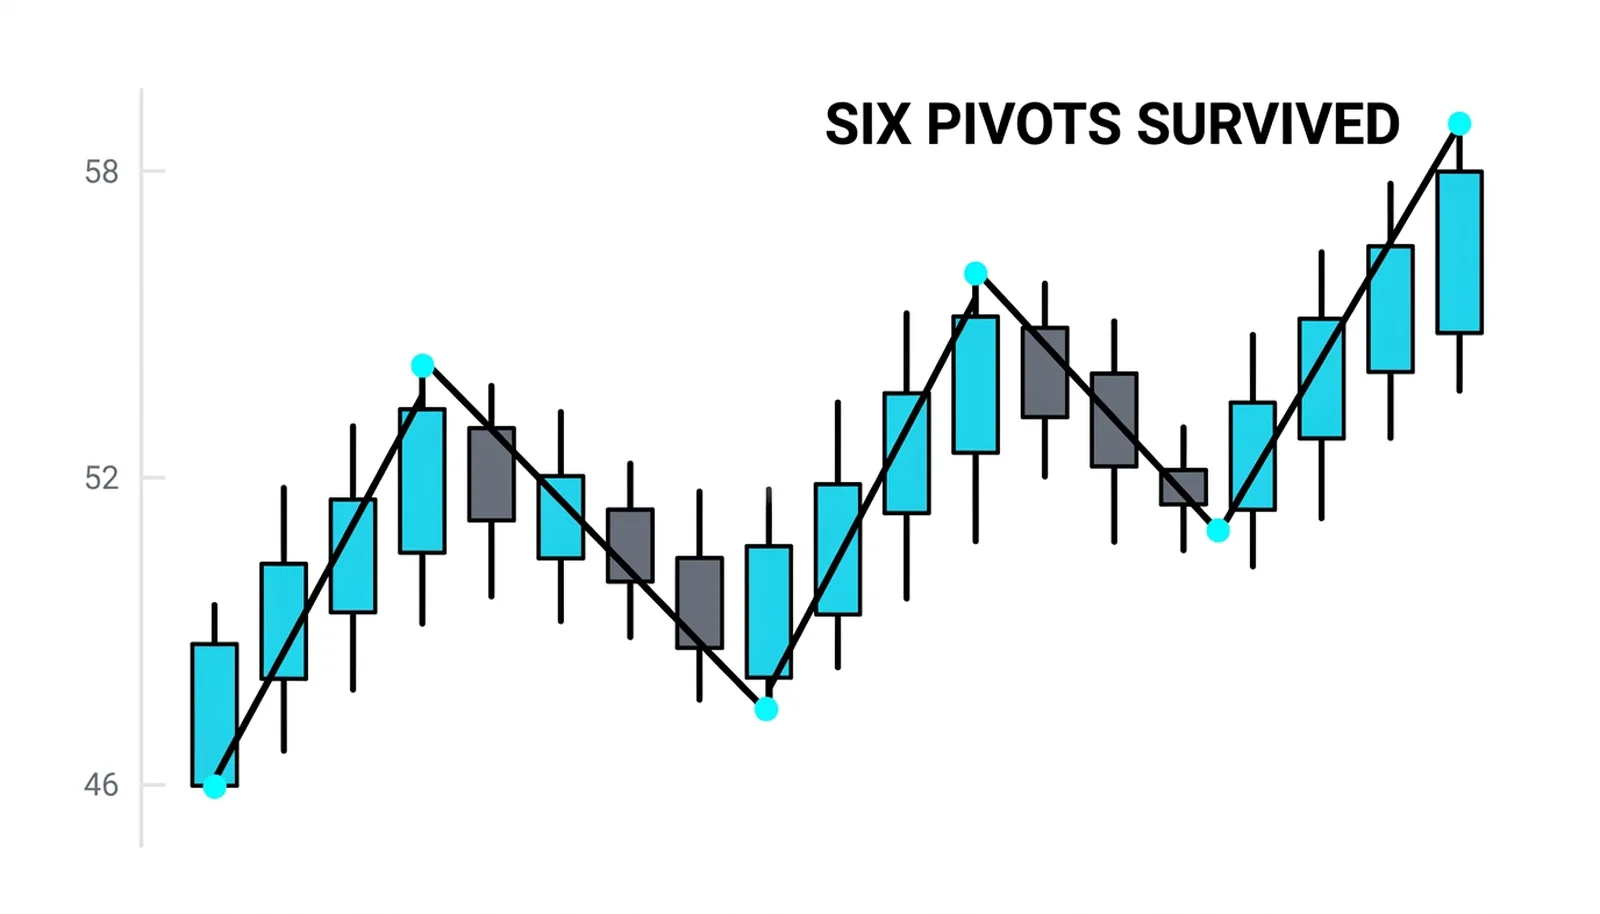
Above, the candles wobble constantly and the ZigZag line ignores all of it. Six pivots survive, and the path between them reads like a sentence: up, down, up, down, up. The wiggles that ate the middle of the chart never made the story.
What the Clean Structure Is For
Once the noise is gone, the chart answers structural questions directly. Are the highs making higher highs and the lows higher lows, the staircase of an uptrend, or is the pattern deteriorating? On raw candles that question takes squinting; on a ZigZag chart it is geometry.
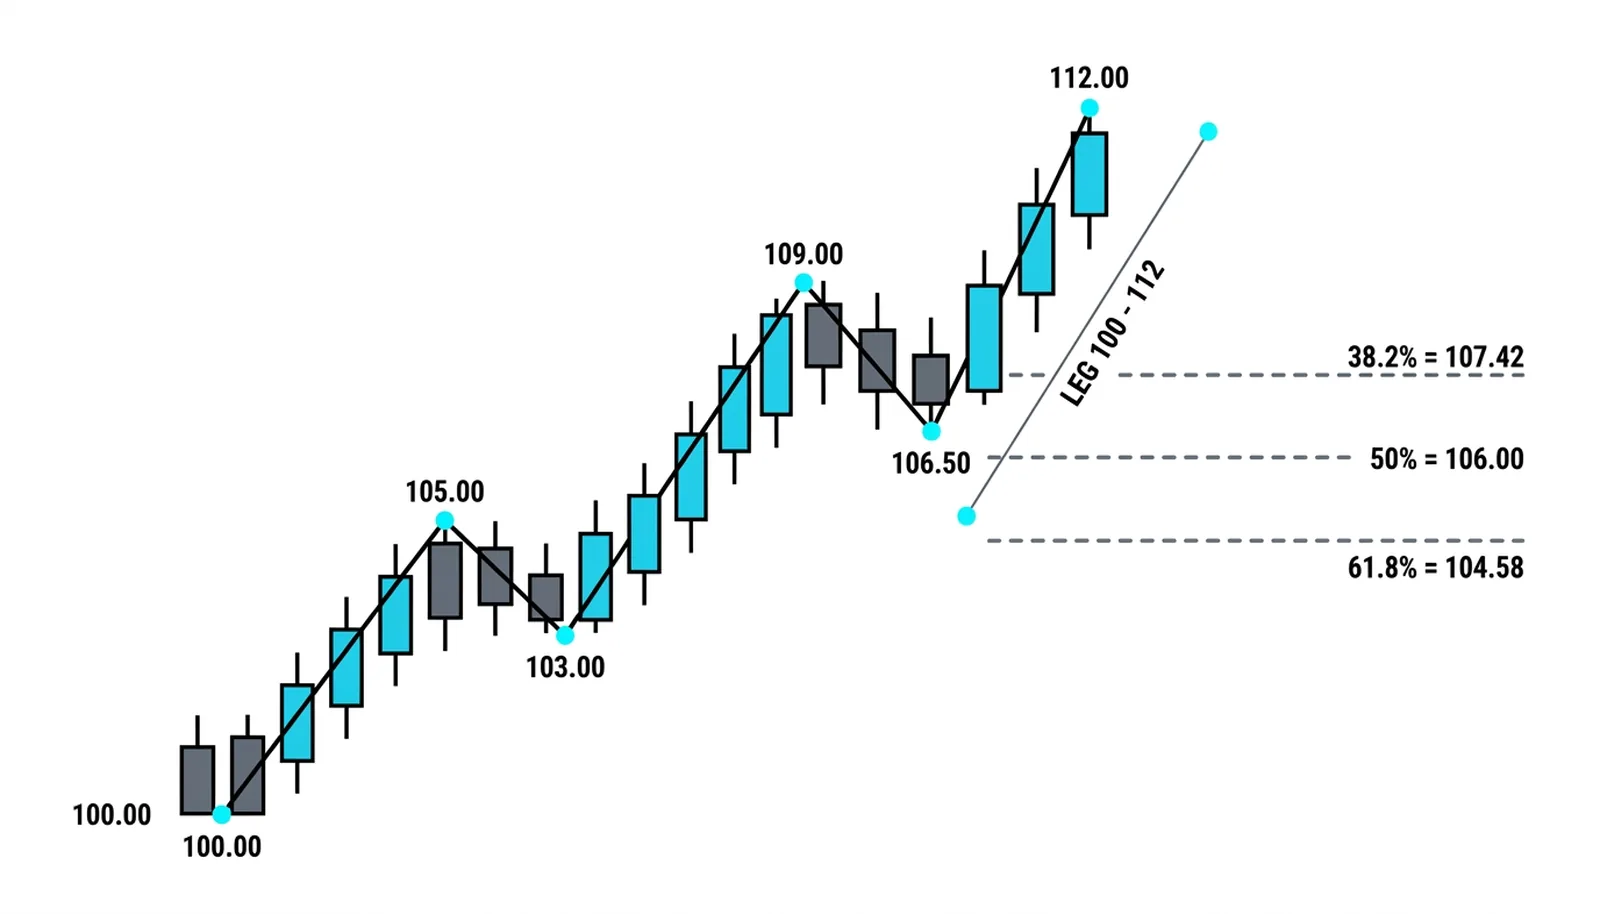
The staircase above is the textbook uptrend shape: every high exceeds the last, every low holds above the last low. The moment a low breaks below the previous one, the staircase argument is gone, and the ZigZag shows you the break without letting a noisy wiggle fake it. This is also why the tool is a favorite annotation layer for pattern work that depends on swings, Fibonacci retracements drawn from pivot to pivot being the classic example; the cluster method is built on exactly these swing legs.
Pairing the Line With Fibonacci Work
The classic partnership is with retracement analysis, and the mechanics are worth walking through once. Take the last completed upswing the line has drawn, from a swing low at 100.00 to a swing high at 112.00. The Fibonacci ratios are applied to that single leg: the 38.2 percent retracement sits at 107.42, the 50 percent at 106.00, the 61.8 percent at 104.58. Each ratio is a price where the pullback might find structure, and the ZigZag line is what told you where the leg started and ended without a hand-drawn judgment call about which wick counts.
That sounds like a small convenience and it is not. Every retracement question depends on the endpoints, and endpoints are exactly where hand-drawing gets argued about. The rule-based line makes the endpoints mechanical, which makes the derived levels repeatable, which makes them checkable against someone else's chart. The cluster method, covered in the Fibonacci lesson of the course, is built on swing legs identified exactly this way, because the patterns only mean something if two analysts reading the same chart draw the same legs.
Some platforms also offer the ZigZag with an ATR-based threshold instead of a percentage, which adapts the filter to the market's own recent travel. The trade-off is a moving goalpost: the same relative move can qualify as a swing in a quiet week and vanish in a loud one. Percentage thresholds keep the definition fixed, which is why the fixed version remains the default for annotation work.
The Catch: the Last Leg Repaints
Here is the property that has burned more traders than any setting choice. The final leg of the line is provisional. While the market is making what might be a new swing, the line keeps adjusting its endpoint, and a fresh extreme rewrites the leg entirely.
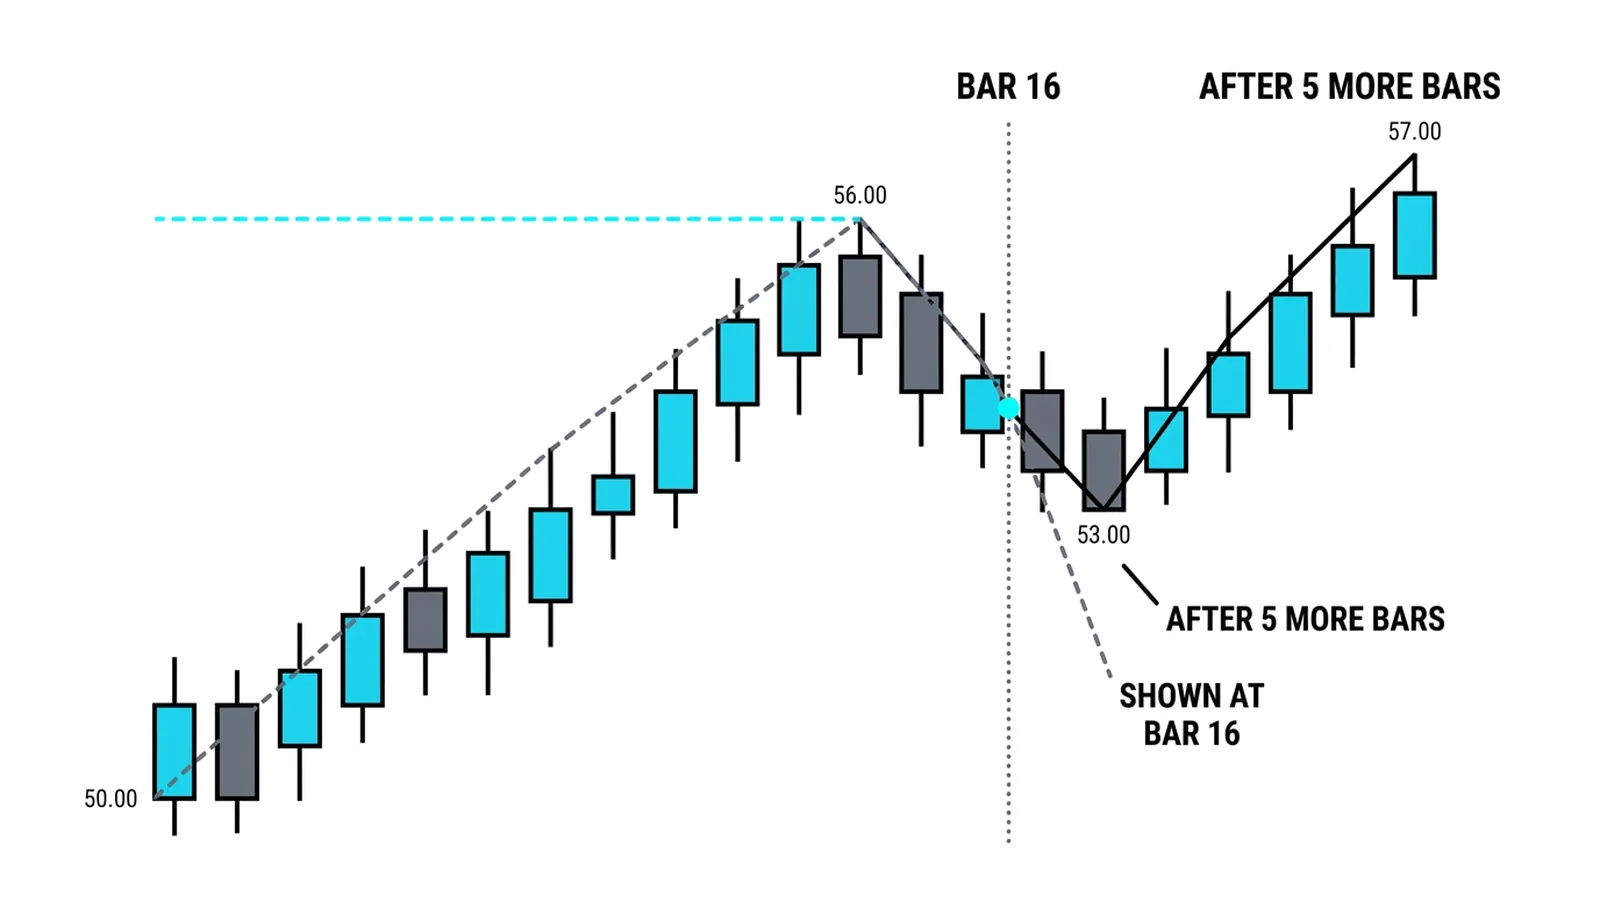
The dashed line is what the indicator showed at bar sixteen. The purple line is the same indicator after five more bars printed. The history agrees; the last leg moved. Any backtest or signal that reads the ZigZag's final leg in real time is reading information the market had not confirmed yet, which is why this tool is an annotation layer and a structure map, never a signal generator by itself.
Used honestly, the workflow is simple: let the ZigZag mark the swings, trade the structure those swings reveal, and take every reading of the last leg with the repaint warning attached. Structure is the product here, not timing, and the swing comparisons it makes visible are exactly what divergence analysis consumes, which is the next lesson in the sequence.
The ZigZag Indicator, Answered
Is the ZigZag indicator predictive?
No. It filters and connects, nothing more. Its pivots are confirmed by moves that already happened, and its last leg changes with new data. Its value is clarity about structure, not foresight about direction.
What deviation setting should I use?
Start at the platform default, usually five percent, and adjust for volatility. The honest test: does the line mark the swings you would have circled by hand? If it draws too many, raise the threshold; if it skips moves you consider important, lower it.
Can I trade signals from the ZigZag line?
Not from the line alone. The final leg repaints, so a touch or a break of it is not a confirmed event until the deviation threshold locks the pivot in. The line tells you where structure formed, and the trade still needs its own trigger.