Support and Resistance Explained
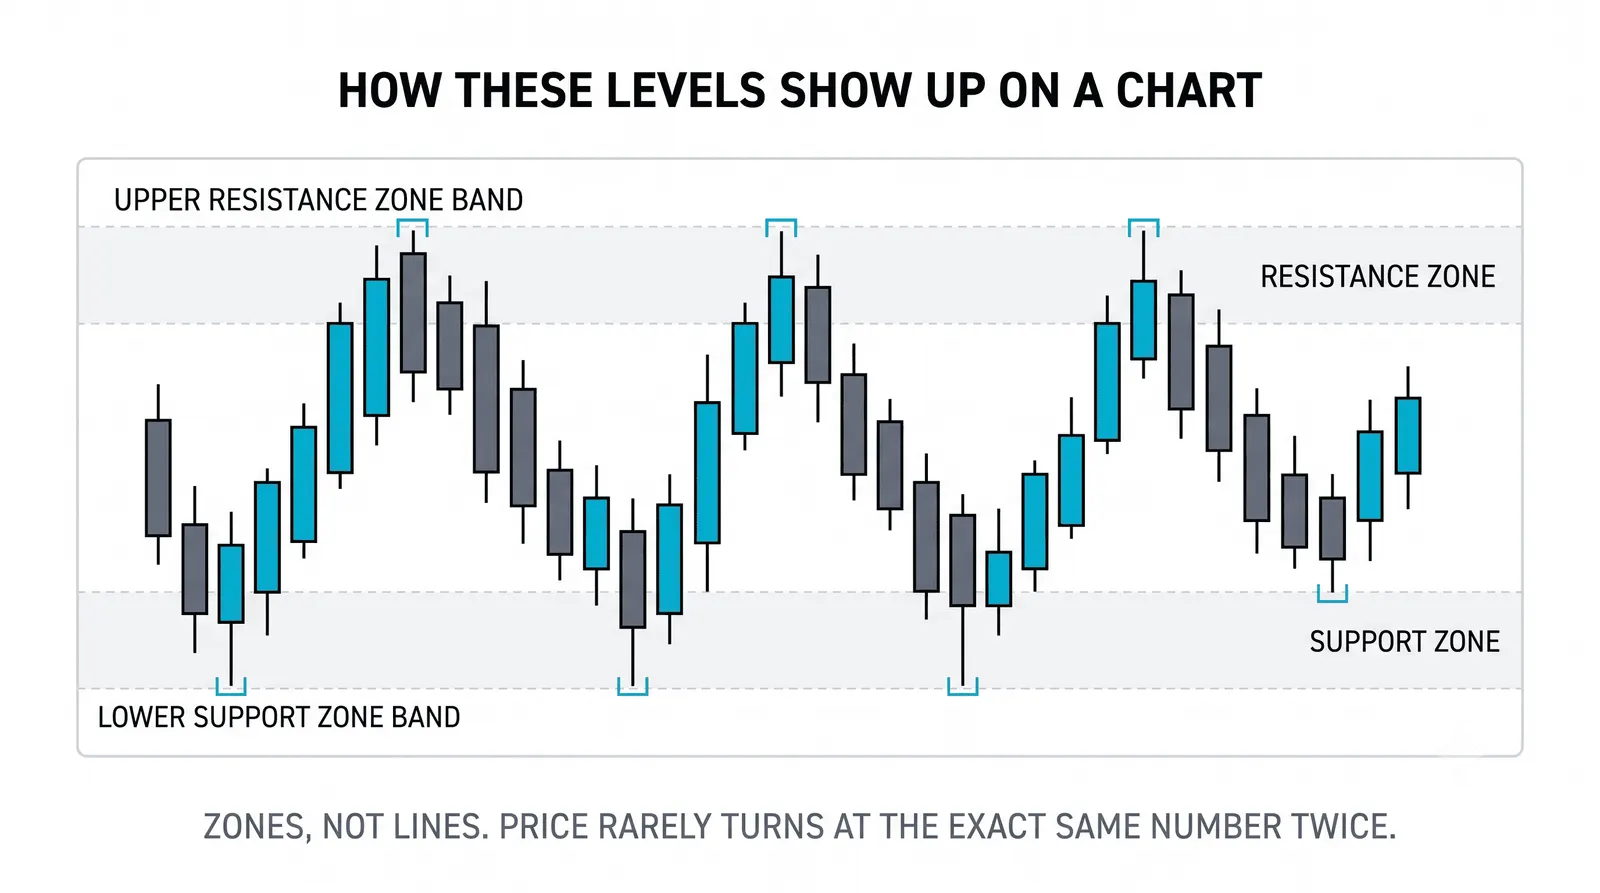
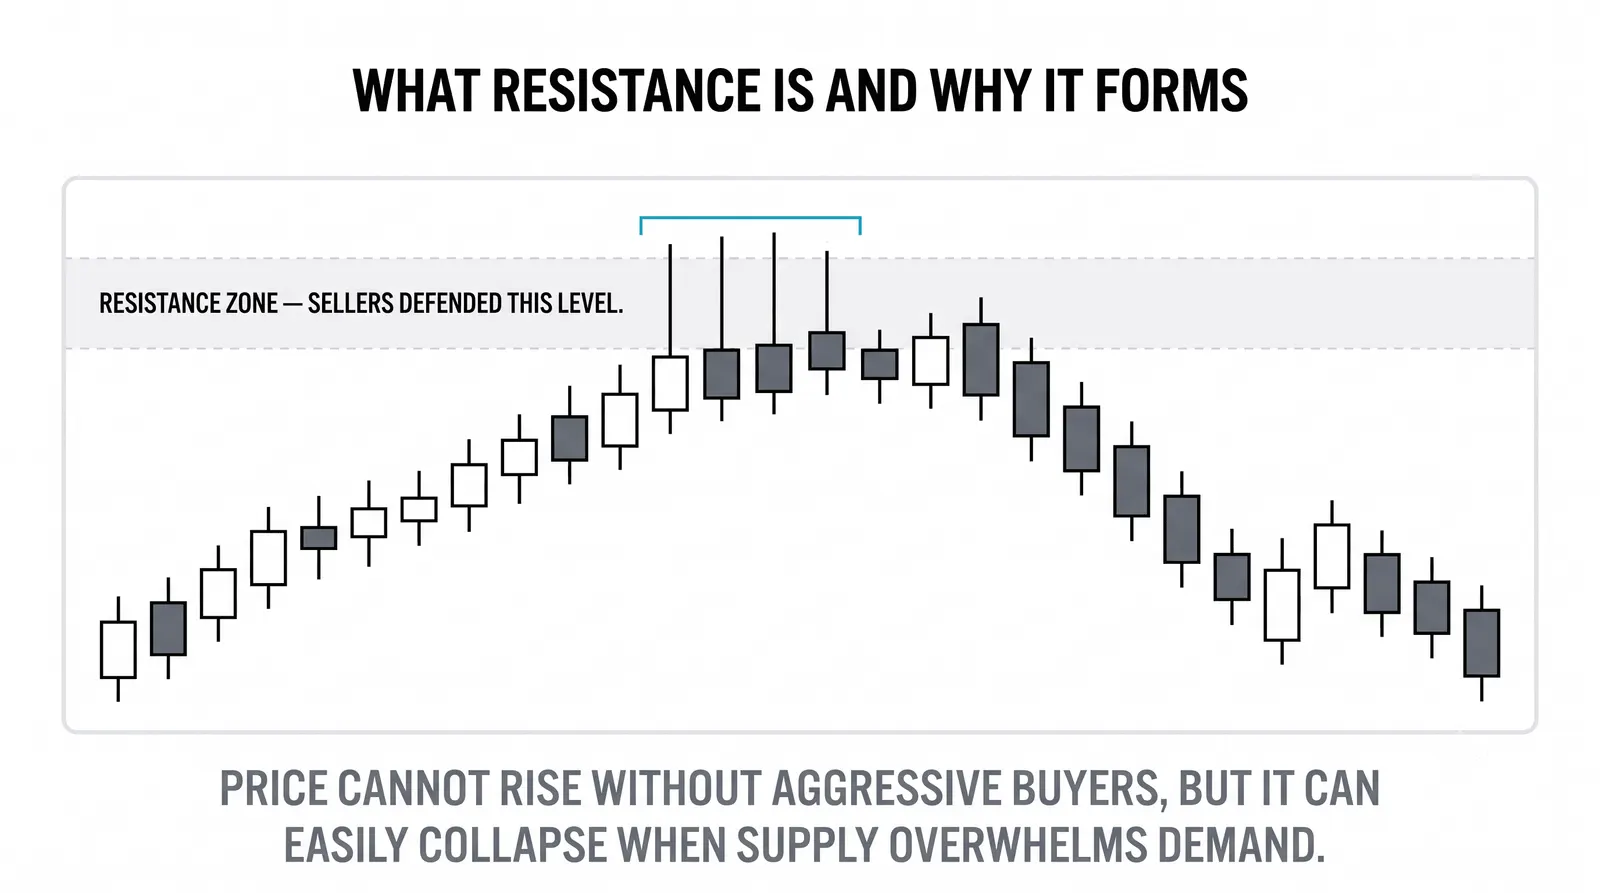
Support and resistance are price zones where the market keeps making the same decision: support is a zone where falling price keeps finding buyers, and resistance is a zone where rising price keeps finding sellers. Both are zones, not exact lines. If you treat them as single magic numbers, you will be stopped out constantly and confused about why.

Think of them as a glass floor and a glass ceiling: they hold until something heavy lands on them, and cracked glass holds less well than fresh glass. That one image covers most of what you need to know about how these zones behave. Where the footprints come from is covered in how to read market structure.
Why These Zones Form At All
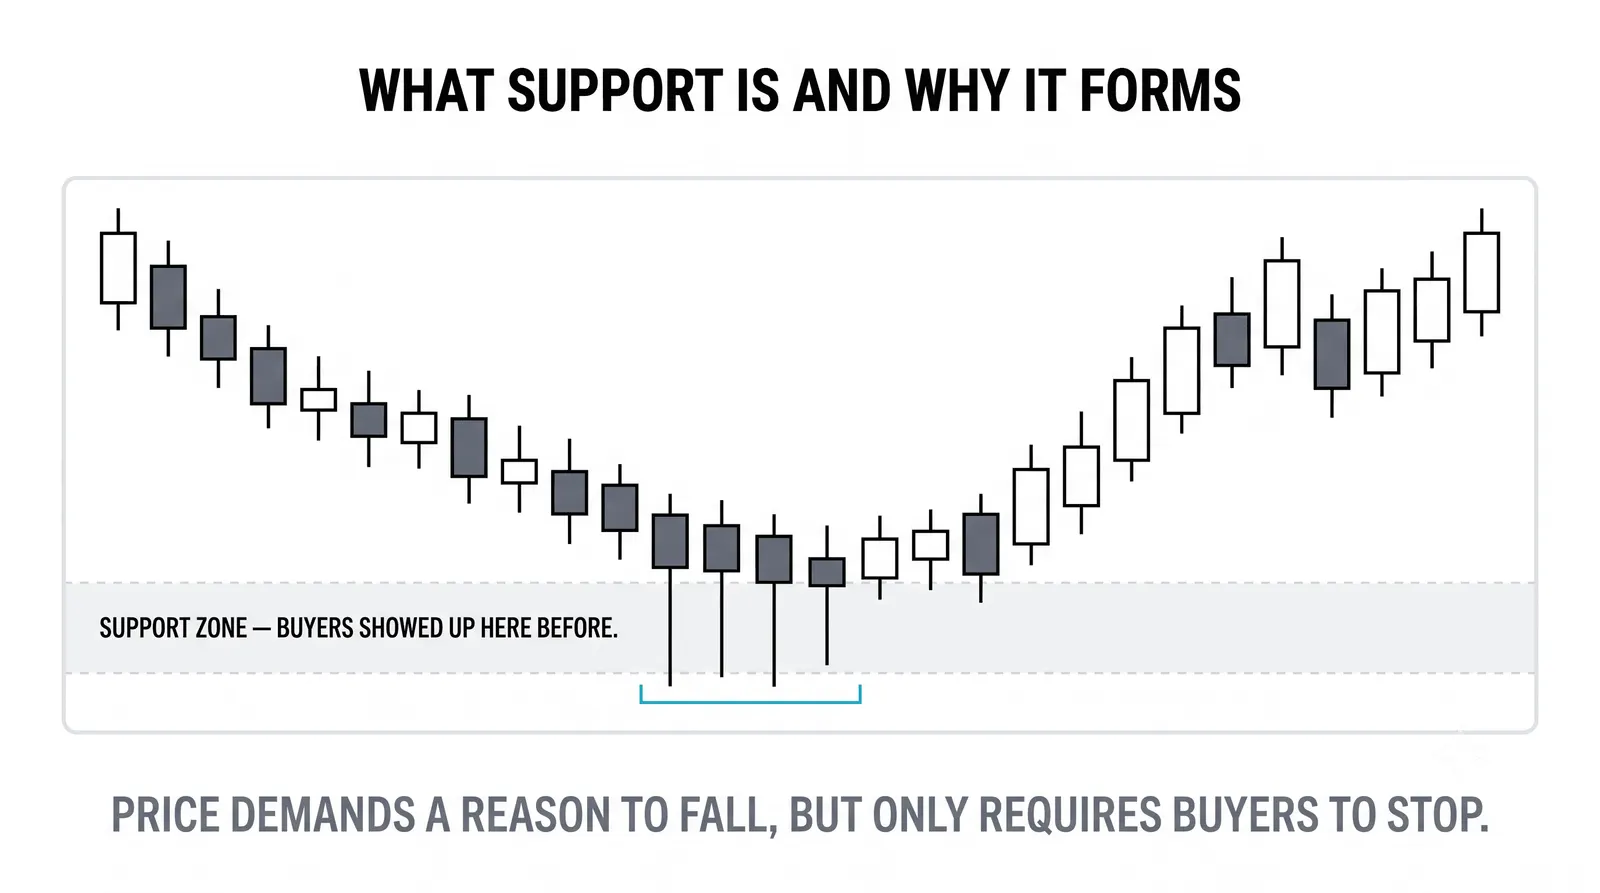
Support and resistance exist because traders have memory. People remember where they bought, where they sold, and where they missed out, and those memories turn into orders sitting at the same prices.
Three forces build a zone. First, past decisions: traders who sold at a price and watched it rise want to buy back there, and traders who bought and watched it fall want out at breakeven. Second, resting orders: limit orders cluster where price turned before, because that is where people expect it to turn again. Third, round numbers: humans place orders at 100, 50, 1.2500, not at 97.43.
None of this is mystical. A zone is simply a price area where a lot of people have a reason to act. When price arrives, they act, and the zone shows up on your chart.
Support And Resistance Swap Roles
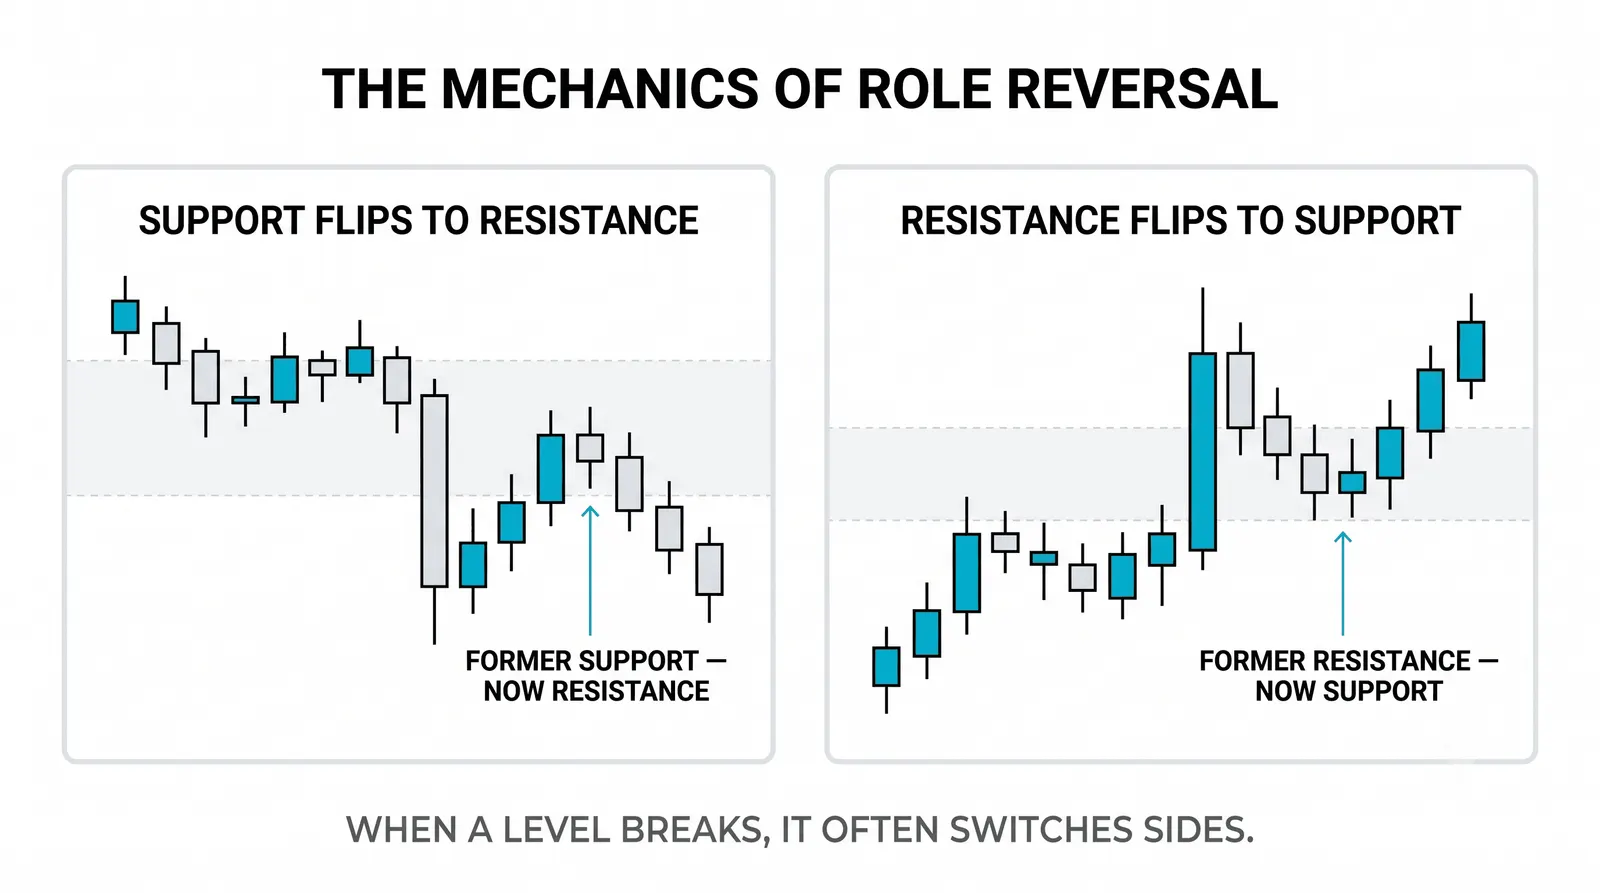
A broken resistance often becomes support, and a broken support often becomes resistance. This role reversal is one of the most reliable behaviors in price action, and it makes sense once you see the logic.
When price breaks above a ceiling, everyone who sold there is now wrong and underwater. If price comes back to that level, many of them buy to exit at breakeven or to fix their mistake. Their buying turns the old ceiling into a floor.
Here is a hypothetical example with round numbers. Say a stock has resistance at 100. It has been rejected there three times. Then buyers finally push through, and price runs to 115. Weeks later it falls back to 100. Traders who sold at 100 buy back in, new buyers see the old breakout point as a fair entry, and price holds at 100 and turns up again. The old ceiling became the new floor.
The same logic runs in reverse. A support at 50 that breaks becomes a ceiling on the way back up, because trapped buyers sell at breakeven when price returns to their entry.
Drawing Zones Honestly
Most beginners draw one thin line and then feel betrayed when price pokes through it by a few ticks before reversing. The line was never the point. The area is the point.
Let the wicks overlap and let the bodies lead. Look at where price actually turned, several times, and mark the band that contains those turning points. If the highs of three rejections sit at 100.10, 100.45, and 99.85, your zone runs roughly from 99.85 to 100.45, not at 100.00 exactly.
A few practical rules:
- Use two or more touches. One touch is a guess. Two or three touches make a zone worth watching.
- Respect the bodies. Candle bodies show where price actually settled. Wicks show where it probed and got rejected. Both matter, but bodies carry more weight; the candle anatomy is in reading a basic price chart.
- Keep zones wider on higher timeframes. A daily zone is naturally broader than a 15-minute zone.
- Redraw when the market proves you wrong. A zone is a hypothesis, not a fact.
Sloppy zones drawn honestly beat precise lines drawn with false confidence.
Fresh Zones Versus Worn-Out Zones
Not all zones deserve equal respect. A zone that has never been retested behaves differently from one that has been hit five times. Each test consumes some of the orders sitting there, like repeated blows cracking the glass.
| Zone Type | Typical Behavior | How Much Respect It Gets | The Catch |
|---|---|---|---|
| Fresh (untested since it formed) | Orders still waiting; often a sharp reaction | High | You have less proof it exists at all |
| Tested once | Held once; some orders filled, some remain | Moderate to high | Reaction is often weaker than the first |
| Tested repeatedly | Obvious to everyone; bounces get smaller | Low and falling | Heavily tested zones eventually break, often violently |
The catch in that last row trips up many new traders. A level that has held five times feels safe. It is not. Every test filled more of the defending orders, and the stops building on the other side make the eventual break faster. The most obvious level on the chart is often the one closest to failing.
Using Zones Without Worshipping Them
Zones tell you where to pay attention, not what to do. A support zone is a place to look for evidence that buyers are actually stepping in, such as rejection wicks, strong closes back inside the zone, or a shift in momentum. The zone itself is not the signal.
Also accept that price will overshoot and undershoot. Markets hunt liquidity, and a quick poke through a zone before reversing is normal behavior, not proof the zone failed. This is why traders who buy the exact touch of a line get shaken out so often.
Build your plan around the area: where you would enter if buyers show up, where your idea is clearly wrong, and what a real break looks like versus a fake poke. That framing keeps you flexible when price refuses to respect your tidy drawing.
Questions About Support and Resistance
How wide should a zone be?
Wide enough to contain the actual turning points you are marking, and no wider. On an intraday chart that might be a few ticks; on a daily chart it might be a percent or two of price. If your zone is so wide that any price could be "at support," it has stopped meaning anything.
Do round numbers matter more?
Yes, slightly, because human orders genuinely cluster at them. Prices like 100, 50, or 1.2000 attract more resting orders than odd numbers, so zones overlapping round numbers tend to react more often. Treat it as a small bonus, not a requirement.
Why do stops cluster just beyond levels?
Because everyone is taught to place stops just past the obvious level. Traders who bought at support put stops a little below it; traders who shorted at resistance put stops a little above it. Those clusters are pools of orders, and price is often drawn through them before the real move begins, which is why breaks so often start with a fast spike. Choosing a stop that respects this is part of choosing the right order types.
Can I trade the level itself?
You can, but it is the hardest way to use zones. Buying the exact touch of support means entering before you have any evidence buyers showed up. Most traders do better waiting for a reaction inside the zone, then entering with a stop on the far side. You give up a little price in exchange for proof.
Once you can mark zones honestly and read how price behaves inside them, the next step is learning how breakouts and failed breakouts work, because that is where support and resistance stop being lines on a chart and start becoming actual trade setups.