Daily, Weekly and Monthly Pivot Points
The pivot formula never changes. Compute the high, low and close of a completed period, average them, and fan out the levels. What changes is the period you feed it, and that choice turns one formula into three maps: daily levels that redraw every session, weekly pivots that hold their ground for five sessions, and monthly pivots that anchor whole swings. Traders who stack them get something no single horizon offers, a sense of which levels the big money treats as important and which ones the day will chew through.

The mental model is map zoom. Street zoom shows the corner you are on, city zoom shows the route across town, region zoom shows the whole drive. Same streets at every scale. Daily, weekly and monthly pivots are the same levels at three zooms, and a level that matters at two zooms at once is worth more than either alone. The formula families themselves are covered in the pivot points breakdown; this lesson is about running the horizons together, in the spirit of the multi-timeframe support and resistance approach.
Three Horizons, Three Clocks
Each horizon redraws on its own schedule, and the schedule shapes the character. Daily pivots recompute every session, so they track the market's freshest fair value and expire every night. Weekly pivots recompute once a week, which means five sessions trade against the same reference, and the levels act more like structure than like guides. Monthly pivots move once a month and sit far from daily action most of the time, showing up only when a swing is big enough to reach them.
| Horizon | Inputs | Redraws | Natural use |
|---|---|---|---|
| Daily | Yesterday's H, L, close | Every session | Day-trade entries, session bias |
| Weekly | Last week's H, L, close | Weekly open | Swing levels, intraday magnets |
| Monthly | Last month's H, L, close | Monthly open | Position anchors, major targets |
On one chart the hierarchy is visible at a glance.
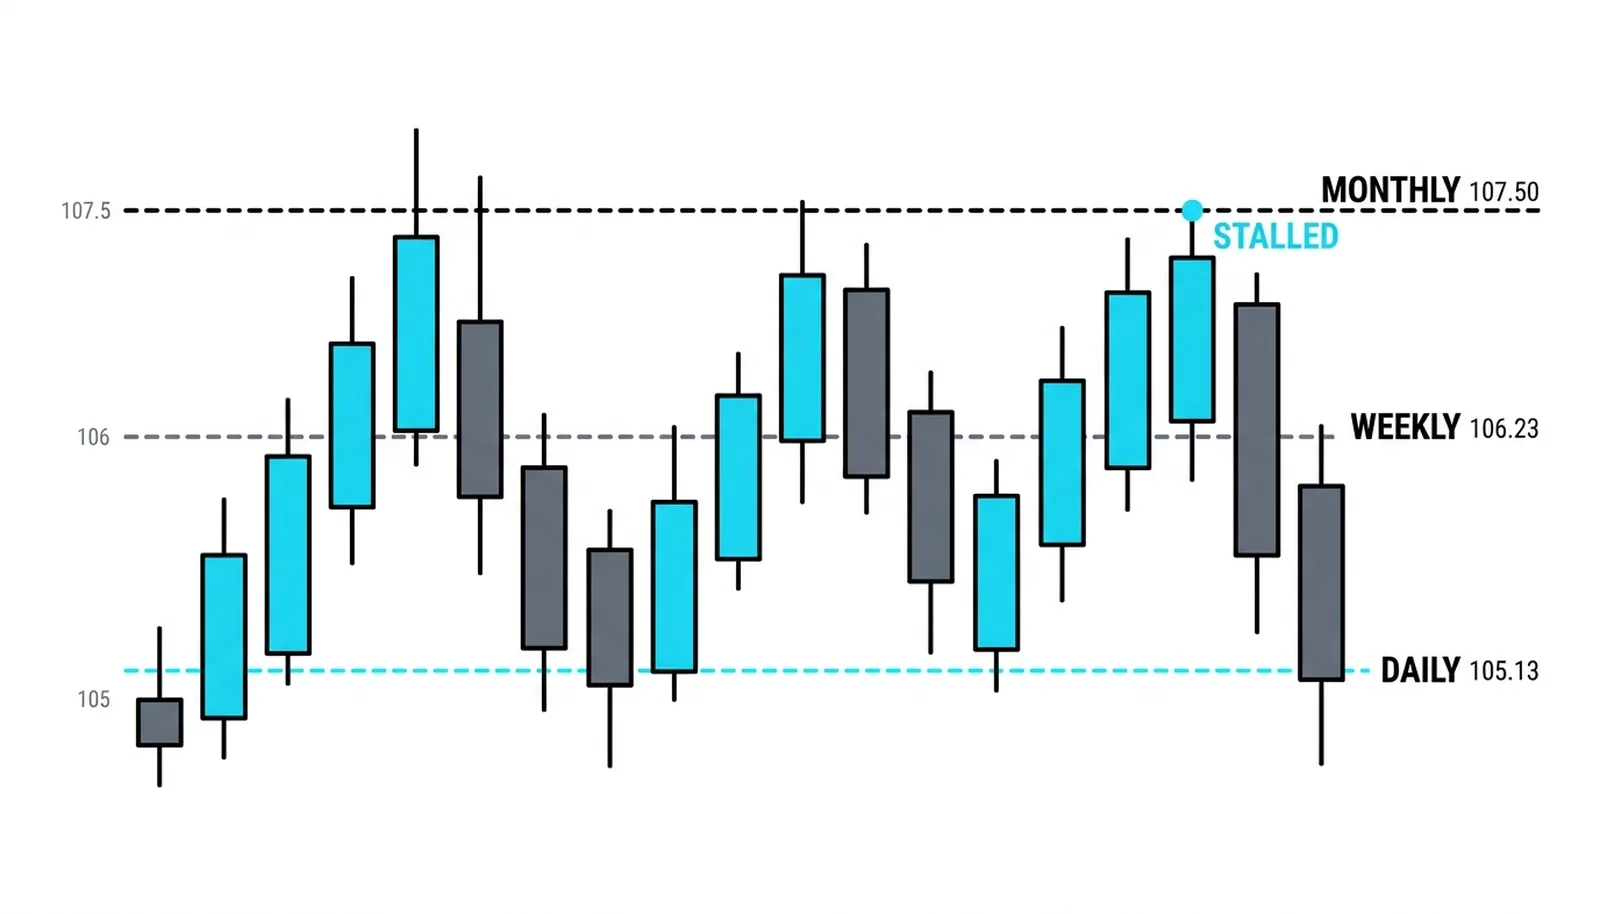
The daily pivot at 105.13 sits below the weekly at 106.23, which sits below the monthly at 107.50. A session opening between the daily and weekly lines has a map already: the daily line is today's fairness, the weekly line is the level the week's average participant cares about, and the monthly line is where position traders reassess. Price crossing each line in turn means crossing a different crowd's break-even.
Confluence: Where Two Horizons Agree
The highest-quality zones appear when a weekly level and a daily level land in the same place. It happens more than chance suggests, because a strong week tends to close near its high, and the next day's pivot math inherits that same close.
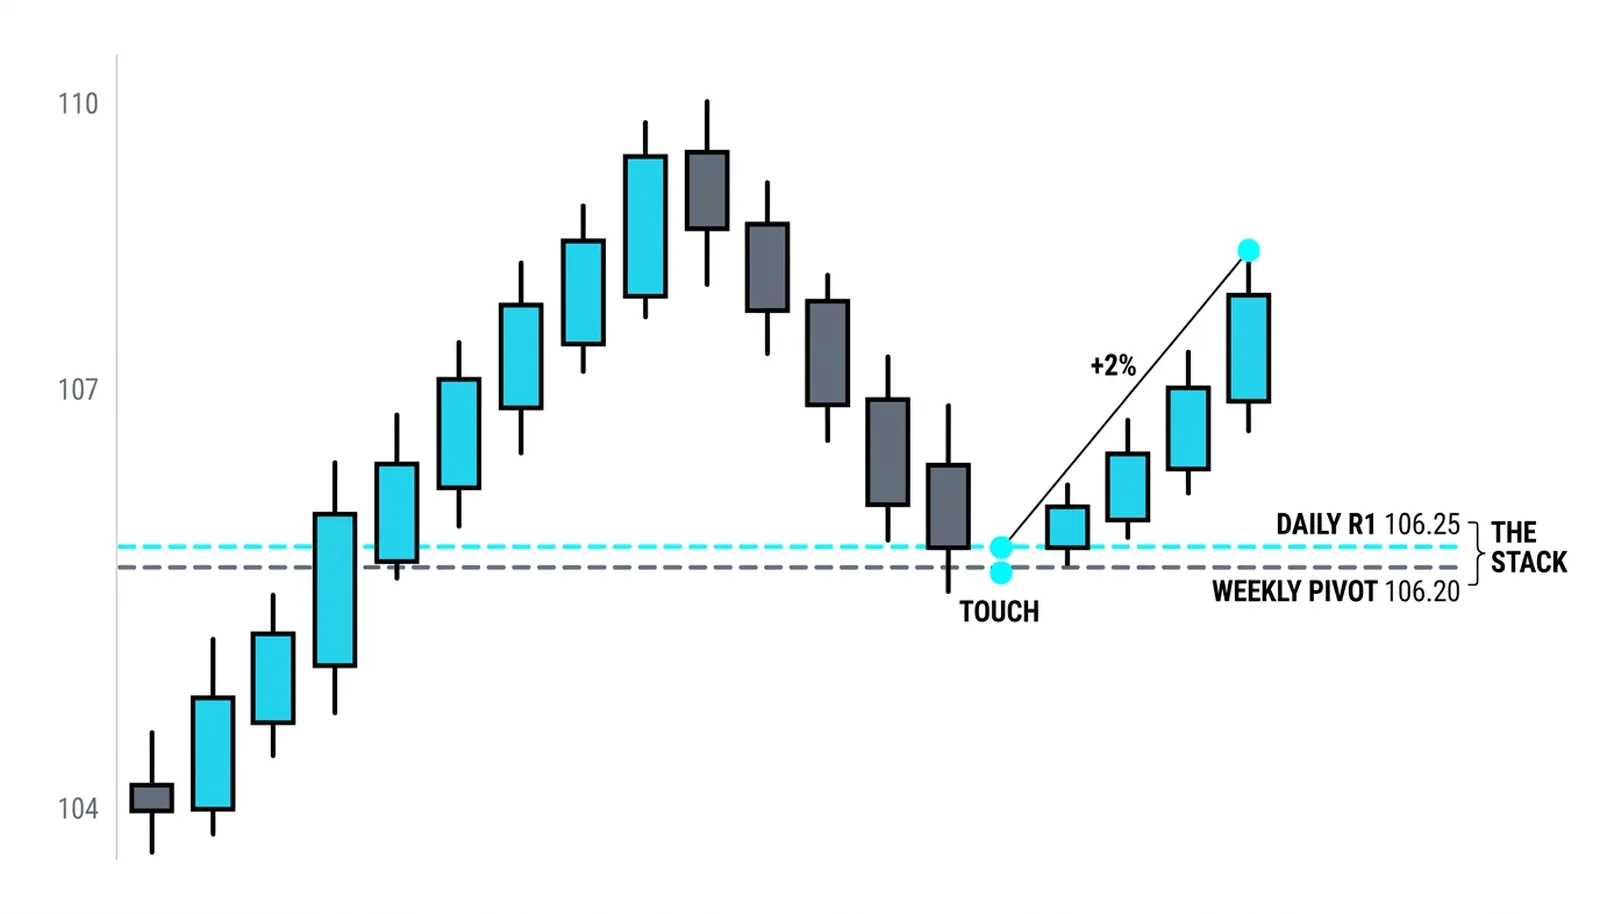
The pullback here found the stack of the weekly pivot and the daily R1 within 0.1 percent of each other, and the bounce carried 2 percent. Two separate crowds got their wish at one price: the weekly traders defending their fairness line and the day traders defending their first resistance-turned-support. Neither crowd knows the other exists, and that is what makes the zone work, the same way round numbers collect orders from strangers.
Multipivot Rules in Day Trading Practice
Before the rules, the payoff of stacking at all. A daily pivot alone answers where today's fairness sits. Stack the weekly and the question becomes which levels survive contact with more than one kind of trader, the day traders who leave at the close, the swing traders who hold all week, and the position traders who check in monthly. A level that three crowds all watch does not need anyone to believe in it particularly hard. It needs only each crowd to place its orders where the formula told them to, which is what the formula's popularity guarantees.
The day trading framework, built on index futures, assembles the full stack: the daily, weekly and monthly pivots plus the midpoints between the daily levels. His rules are worth restating because they are specific. The central daily pivot carries the most weight of the seven daily levels. It is rare for an index to reach its daily R3 or S3 in normal conditions; a tag of R2 or S2 usually marks the dead high or dead low of the day. On calm weeks the R2 S2 band is the full expected range, which is exactly the information a target-setting trader needs before lunch.
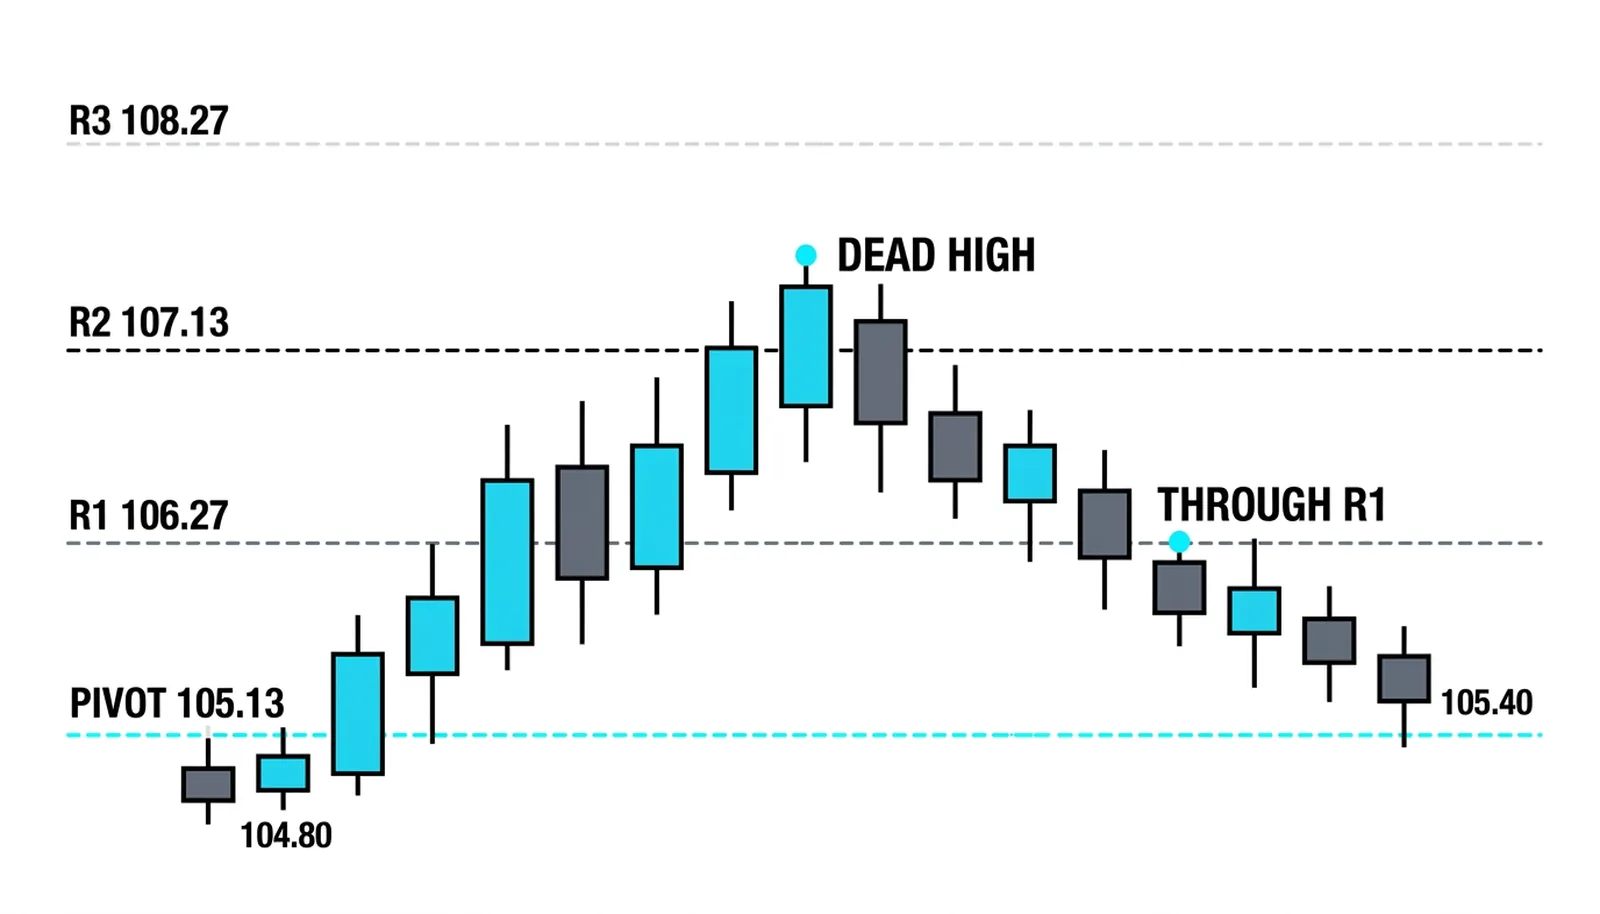
The chart is the rule in action. The rally tagged R2, and that was the high of the day; the fade that followed ran back through R1 and into the close. Knowing in advance that R2 is the statistical ceiling changes behavior twice: it stops you from buying strength into the dead high, and it gives your shorts a defined level to work from rather than an opinion.
Two housekeeping rules from the same system. Weekly pivots hold better than dailies on commodities, currencies and crypto, where the daily levels get chewed through and the weekly ones get respected. And feed the formula clean inputs: on futures that means the settlement price over a full 24-hour session, not a midnight-to-midnight bar, because a wrong close shifts every level the formula makes. Monday is the special case, when the daily and weekly pivots share Friday's inputs.
Daily, Weekly and Monthly Pivots, Answered
Do pivot levels replace drawing levels by hand?
They complement it. Hand-drawn levels come from looking at structure and choosing what mattered; pivots come from one formula applied to one bar. The hand-drawn level encodes judgment, the pivot encodes convention, and a price zone where both land together carries the weight of the two audiences combined.
Which horizon should a new trader start with?
The daily set, because it redraws often enough to get fast feedback and the sessions it describes are the ones new traders usually trade. Add the weekly set once the daily levels feel familiar, and treat the monthly set as background, not as a trigger.
Do the levels conflict when horizons disagree?
They rank. The weekly line beats the daily line for importance, and the monthly beats the weekly, because more participation and more time stand behind each calculation. A daily R1 sitting below a weekly pivot describes a market fighting its own week, and the weekly side usually wins the first test.
How do pivots relate to session timing?
Daily pivots assume a completed session, so the open is when the new map activates. The first hour is where price declares its relation to the pivot, and that relation, above or below, is the session bias. Session structure itself is covered in the opening ranges lesson, and the two frameworks slot together naturally.
Up next in the course: the ZigZag indicator maps swing highs and lows, and Aroon clocks how fresh a trend is, closing out the price-level cluster before the mastery section.