Divergence: The Universal Oscillator Signal
Price makes a higher high. The momentum indicator makes a lower one. That disagreement, when it is real and not a reading artifact, is divergence, and it is the single pattern that shows up on every bounded oscillator in this course the same way: RSI, the stochastic, MACD, the Money Flow Index. The indicator is the second witness, and divergence is what it looks like when the second witness stops agreeing with the first.

The courtroom picture is the honest one. Price is the loud witness, and it testifies that the market made a new extreme. The oscillator is the quiet witness, testifying about the momentum that carried the move. When both agree, the case is dull. When the two witnesses disagree, someone is misremembering, and traders have learned over decades that momentum misremembers first. A move whose second high carries less force than its first is a move running on less fuel, whatever the chart says.
This lesson is the map of the whole territory. The oscillator-specific versions already have their own lessons, RSI divergence and stochastic divergence, and the MACD construction behind its version is in the MACD breakdown. Here we build the pattern itself once, so the oscillator chapters read as variations on a theme.
The Anatomy: One Higher High, One Lower High
Strip a bearish divergence to its parts. Price rallies, pulls back, and grinds to a high above the first one. Underneath, the oscillator rallied hard on the first leg, and on the second leg only musters a peak below its own first peak. Same price event, two testimonies.
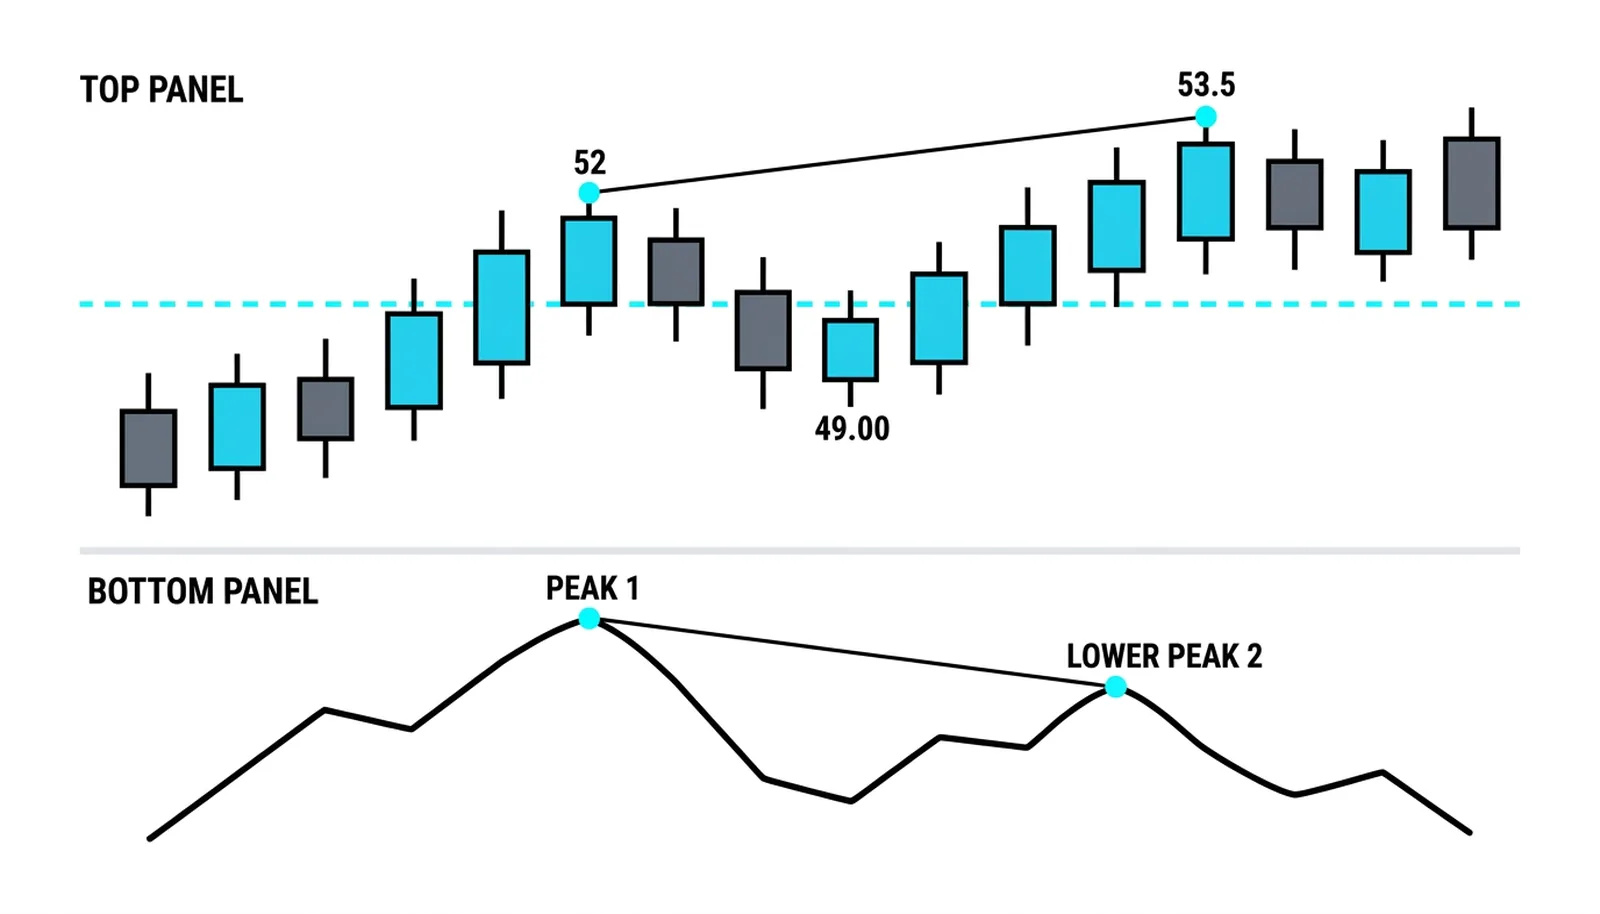
Both orange dots sit at swing peaks, one in each panel, and the geometry is the entire pattern: the top-right dot in the price panel is higher than the top-left, while the top-right dot in the oscillator panel is lower than its top-left. Why it happens is not mysterious. The oscillator measures the speed and placement of the move, and the second push was slower and shallower inside its bars. Price kept its height by coasting; the engine noise dropped.
The Two Flavors: Reversal and Continuation
Every divergence belongs to one of two families, and the family decides what the pattern is claiming. Regular divergence is the reversal flavor: price makes a higher high while the oscillator makes a lower high, as above, or price makes a lower low while the oscillator makes a higher low, the bullish mirror. The claim is that the move is exhausted. Hidden divergence is the continuation flavor: in an uptrend, price pulls back to a higher low while the oscillator pulls back to a lower low, which says the dip was heavy-handed and the trend still owns the momentum. The two claims point in opposite directions, which is why telling them apart matters more than spotting the pattern at all.
The regular family gets the attention because it promises reversals, and the promises are the ones people remember when they come true. The honest statistics are harder: regular divergences fire early more often than they fire accurately, especially in strong trends, where a sequence of divergences can precede the actual turn by many bars. The pattern is a condition, pressure leaving the move, and not a switch.
One Event, Two Witnesses
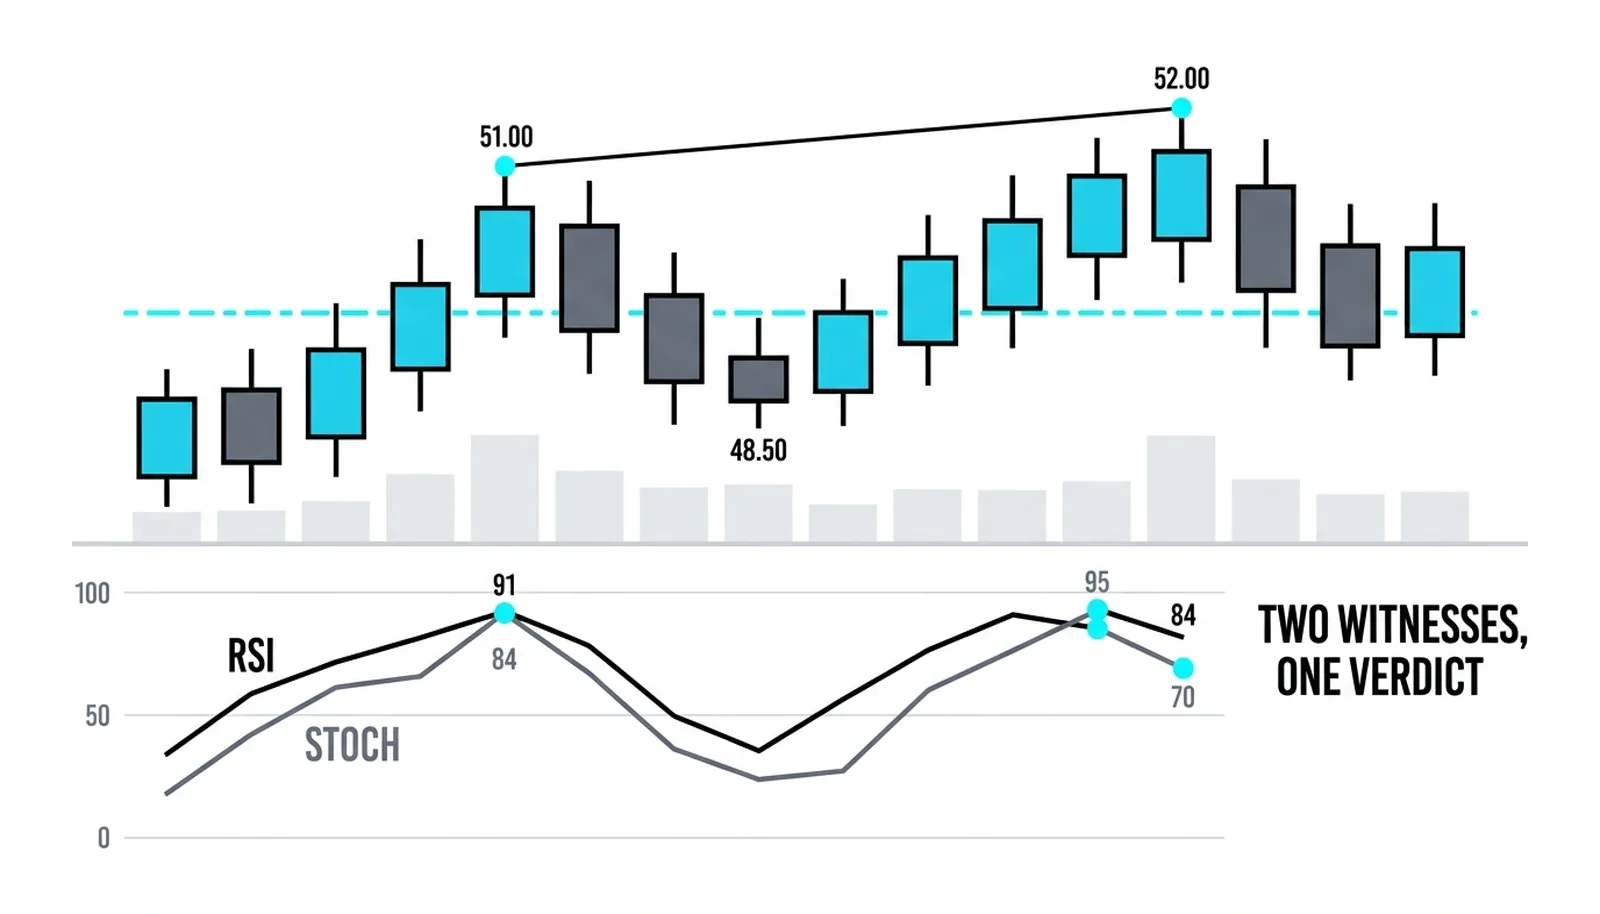
The universal part of the claim deserves a demonstration. The same price event, read by two different oscillators built on different math, should show the same disagreement if the pattern is really about momentum and not about one indicator's quirks.
The RSI, a smoothed ratio of average gains to losses, and the stochastic, a raw position-of-close-in-range measure, agree on the event. Both peaked high at the first top; both printed lower peaks at the second. Two formulas with nothing in common except bounded readings of momentum reached the same verdict, and that cross-examination is what separates a divergence worth trading from a squiggle worth ignoring.
The False Divergences Worth Naming
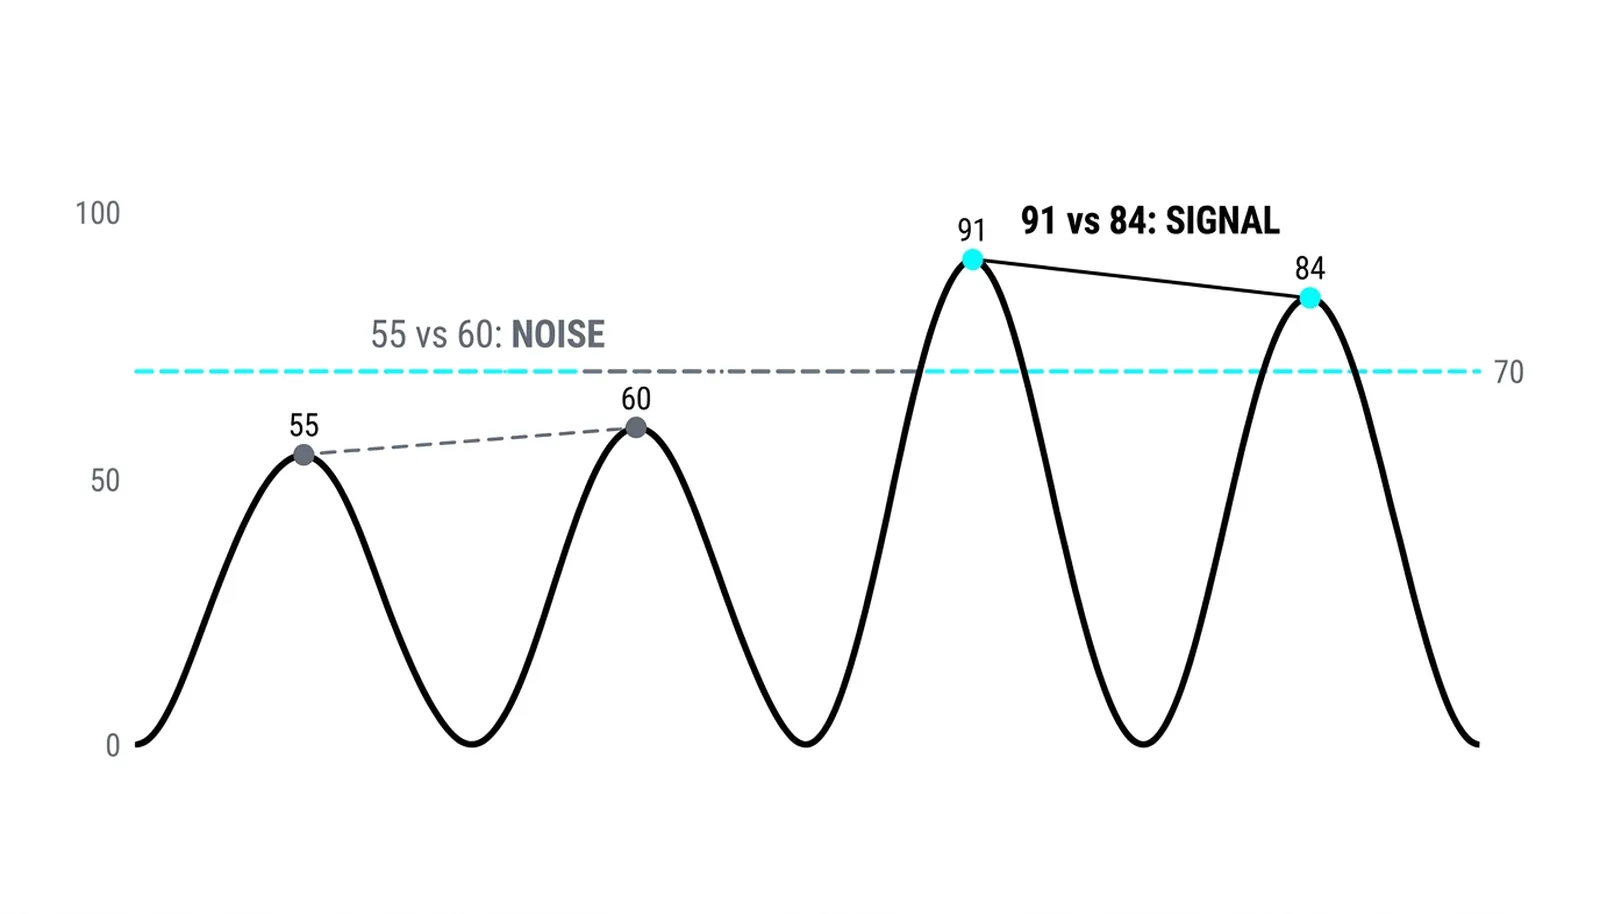
Three misreads account for most bad divergence trades. The first is the mid-range squiggle: a lower oscillator peak printed from a reading of 55 against 60 means nothing, because neither peak came from the pressure zone where oscillators actually make claims. Compare peaks at extremes, or do not compare them. The second is the misaligned swing: the two price highs belong to different stories entirely, one a swing top on the daily and one a leftover intraday wiggle, and the oscillator peaks under them were never measuring the same move. Adjacent swings, same timeframe, same story. The third is the trend-context blindness: in a strong uptrend, bearish divergences print repeatedly while price keeps climbing, because momentum always cools before price turns in persistent trends. Each of those printed divergences was real as a pressure reading and wrong as a reversal forecast.
What each witness brings to the cross-examination:
| Oscillator | What it measures | Its divergence flavor |
|---|---|---|
| RSI | Smoothed ratio of average gains to losses | Slowest to peak; cleanest swing-to-swing comparisons |
| Stochastic | Close position within the recent range | Peaks near range extremes; earliest and noisiest |
| MACD | Gap between two moving averages | Histogram shrinks as momentum cools; mid-speed witness |
Reading Rules That Keep You Honest
Four habits separate useful divergence reading from pattern-hunting. First, the swing comparison must be clean: two genuine swing peaks in price, two genuine swing peaks in the oscillator, roughly aligned in time. Second, extremes mean more than mid-range squiggles: a divergence from an overbought oscillator peak carries weight that one from a mid-range wiggle does not. Third, trends eat divergences, so a bearish divergence inside a powerful uptrend is a reason to tighten stops, and rarely a reason to flip direction. Fourth, confirmation comes from price: the divergence earns its keep when price structure then breaks in the direction the momentum predicted.
Divergence, Answered
Which oscillator is best for spotting divergence?
The one whose construction you understand, because the reading includes knowing what the line measures. RSI, stochastic and MACD disagree on math but agree on events, and running two of them turns one witness into a cross-examination.
Does a divergence have to come from an extreme reading?
The strong ones do. A bearish divergence with both oscillator peaks above 70 is a statement about exhausted buying pressure; the same shape with both peaks in the forties is a footnote. The thresholds are not magic, but the further the peaks sit from the middle of the range, the harder the disagreement is to wave away.
How many bars apart can the two peaks be?
Close enough to be one story: the two price swings should be adjacent swings on the timeframe, not a peak from last month compared to this week. The oscillator peaks should sit roughly under the price peaks, and the wider they drift apart in time, the weaker the claim.
Does divergence work on any indicator?
On any bounded, momentum-style reading it works the same way. It does not transfer to price overlays such as moving averages or bands, because those do not measure momentum; they measure price itself, so there is no second witness to disagree.
The next two lessons take the two families seriously: hidden divergence as the trend-continuation signal, and regular divergence as the reversal signal, each with its own playbook.