Support and Resistance — a Deep Dive
Support and resistance are the two ideas everything else in price reading hangs on. Support is a price zone where falling markets keep finding buyers. Resistance is a price zone where rising markets keep finding sellers. Both work because they are memory: prices where the market changed its mind before still shape the orders sitting there today.

That last part matters more than the definitions. A level is not magic. It is a record of past decisions, and traders who acted at that price before tend to act there again. Some defend positions. Some exit trades they regret. Some enter where they missed the first move.
Think of support as a glass floor. It holds until too many traders doubt it at the same time.
Levels Are Zones, Not Lines
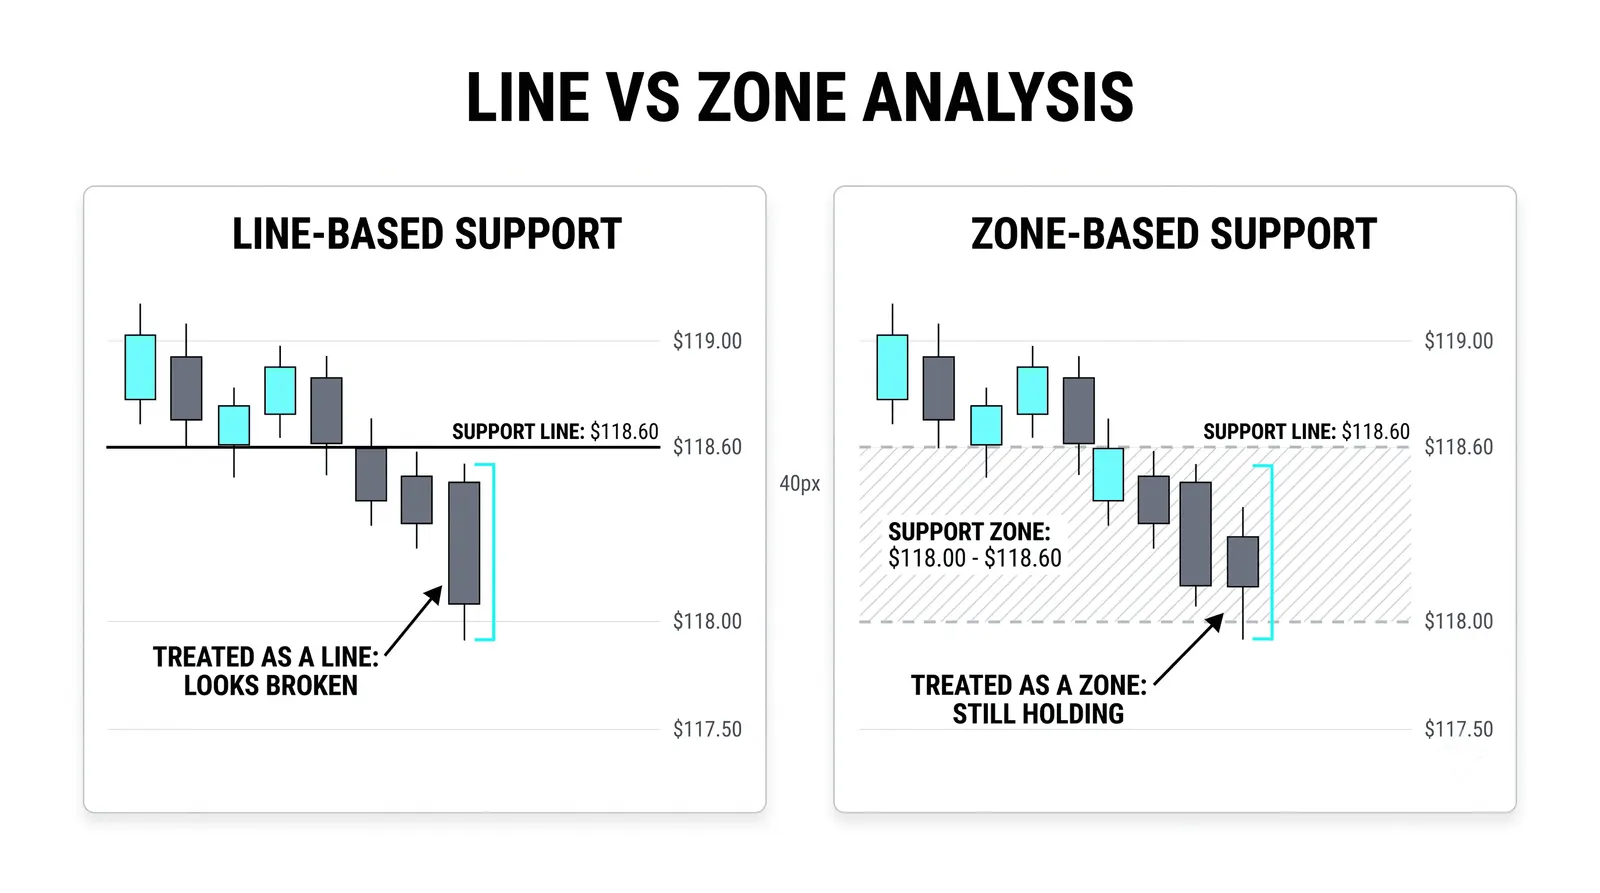
New traders draw a line at an exact price and then get angry when the market ignores it by a few ticks. The market is not ignoring anything. Orders cluster around prices, not on them.
One trader bids at 99.80. Another at 100.10. Another waits for 100.50. The result is a band of buying, not a single point. If you draw a razor-thin line, you will constantly see price "break" your level by a hair and then reverse, and you will misread good levels as failed ones.
Wicks overshoot. That is normal. A stop run or a burst of market orders can push price through the edge of a zone before the real buying shows up. What decides the argument is the close. A wick through support that closes back above it is a hold. A close through it is a warning.
So draw a band. Use the wick extremes and the cluster of closes as your edges, and treat everything inside the band as the level doing its job.
Where Levels Come From
Levels are not random. They form at prices where something happened before, and four sources cover most of what you will mark on a chart.
- Prior swing highs and lows. The most obvious source. A swing high is a price where sellers overwhelmed buyers once already. Traders remember it, and sell orders tend to stack there again.
- Old congestion shelves. Areas where price chopped sideways for days or weeks. Everyone who bought inside that range has a cost basis there. When price returns, some sell at breakeven, and that supply creates a level.
- Gaps. A gap means price jumped without trading through the middle. That untraded space often acts as a level later, because no one had a chance to transact there the first time.
- Round numbers. 100, 1.1000, 50,000. Humans place orders at round numbers, so orders genuinely pile up there. This is one of the few "psychological" ideas in trading that is mechanically real.
When you mark a level, you should be able to say which of these created it. If you cannot, you are probably drawing lines to fill the chart.
What Makes a Level Strong
Not all levels deserve equal respect. Three things separate the ones that hold from the ones that fold.
First, the number and speed of reactions. A level that produced a fast, violent bounce tells you real orders sat there. Price did not drift away from it. It got rejected. Slow, lazy turns are weaker evidence because they may just reflect a quiet market, not committed buyers or sellers.
Second, time spent at the level. A zone where price traded heavily for weeks carries more memory than a price touched once for an hour. More transactions means more traders with a stake in that area.
Third, volume on the reaction. If price hits support and bounces on a clear surge of volume, participation confirmed the level. A bounce on thin volume is a guess, not a verdict.
Strong levels score well on all three. Weak levels usually fail on at least two.
Confluence: When the Level Stops Being Your Opinion
A single level is one argument. Confluence is several independent arguments pointing at the same band of prices.
Say a prior swing low sits at 100. A round number, obviously. Now add a rising trendline that also passes through 100 this week. Three different groups of traders, using three different reasons, all have orders in the same zone. The level is no longer your drawing. It is a crowd.
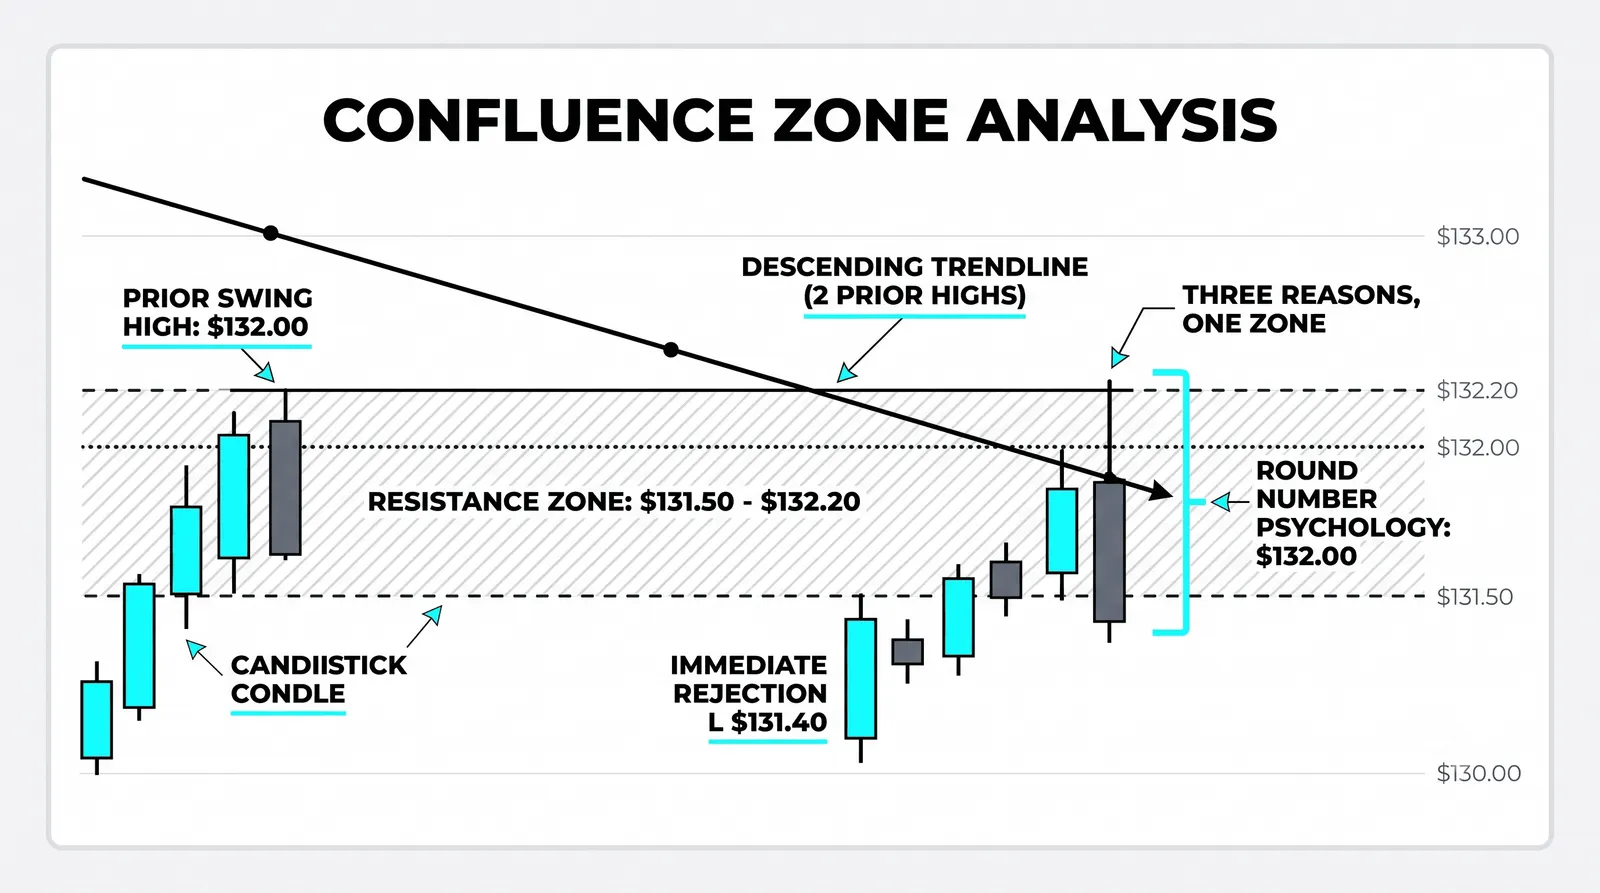
This is the filter that keeps your chart clean. Instead of marking fifteen lines, you ask which zones have more than one reason to exist. Those are the ones worth planning around, the ones worth planning around. The rest is noise you drew yourself.
Confluence does not guarantee a hold. Nothing does. It just means the level is real in the market's memory, not only in yours.
Decay: Why Tests Wear Levels Out
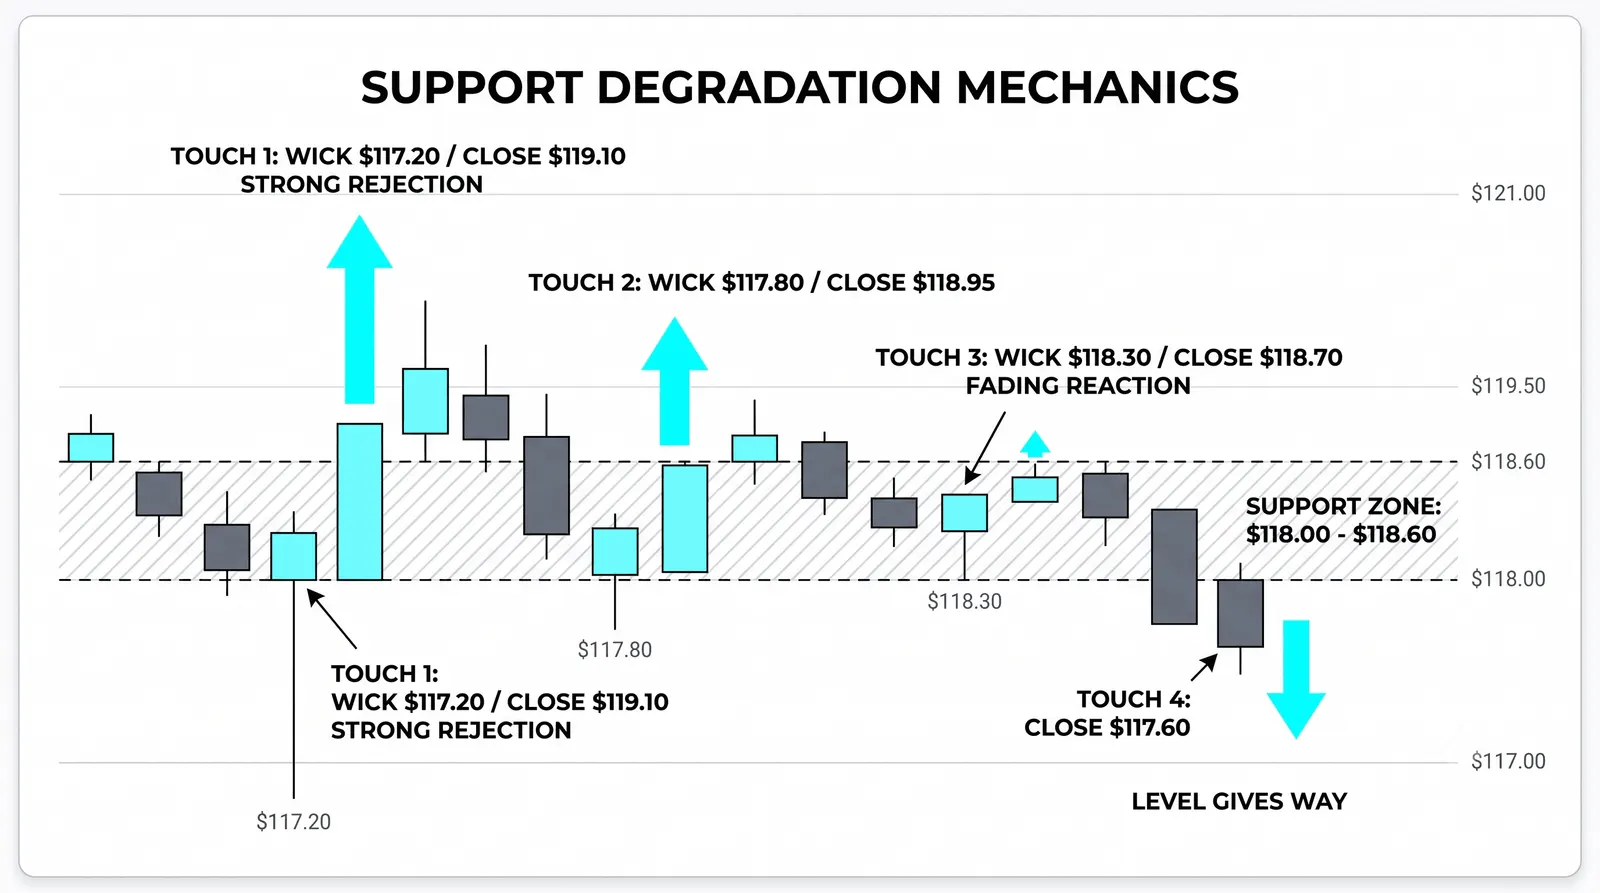
Every test of a level consumes some of the resting orders that made it work. Buyers who filled at the first touch are done. They cannot buy the second touch. Each retest runs on thinner support.
This is why the third test is rarely as clean as the first. The easy, committed orders are gone. What remains is weaker hands and hopeful latecomers.
Watch for the signature of decay: smaller bounces, slower reactions, price spending more time pressed against the level instead of bouncing away from it. A level under pressure that cannot lift off is a level running out of orders.
And when a level finally breaks, it often flips sides. Old support becomes new resistance. The buyers trapped at 100 now want out at breakeven, and their sell orders turn the old floor into a ceiling. This flip is one of the most reliable behaviors in price action, and it falls straight out of the memory idea.
One Level, Three Tests
Here is a hypothetical with round numbers to make decay concrete. Nothing here is a recommendation; it is an illustration of how to read a level over time.
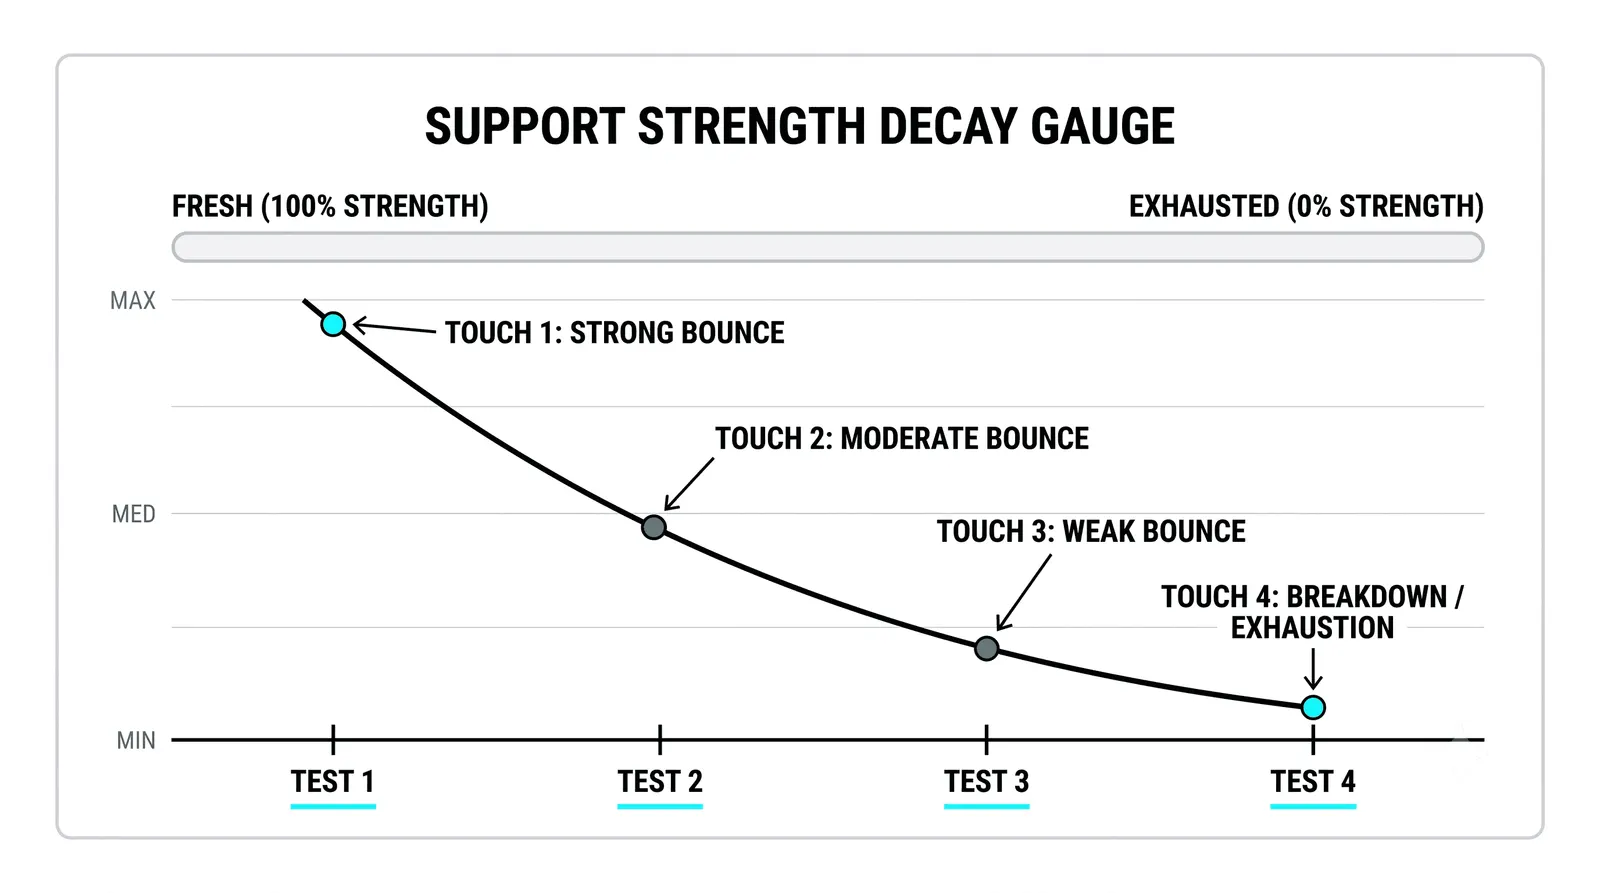
Price falls to support at 100 for the first time. The bounce is sharp: 5 points in a single day, up to 105. Fast reaction, strong orders. This level is alive.
Two weeks later, price returns to 100. This time it bounces only 2 points, and it takes three days to do it. The level still held, but the reaction was slower and smaller. Some of the original buyers already filled. The level is working, but it is weaker than it was.
Then comes the third test. Price reaches 100 and does not bounce at all. It slides through to 97. The resting orders were consumed by the first two tests, and nothing was left to stop the fall.
Now the flip. Price rallies back to 100 from below and stalls. The traders who bought the third touch at 100 are underwater and sell at breakeven. Old support becomes new resistance. If you were still treating 100 as a floor, you were reading last month's memory.
The lesson is not "avoid third tests." It is that a level is a resource that gets spent, and your job is to track how much is left.
Strong Levels vs Weak Levels
| Strong Level | Weak Level | |
|---|---|---|
| What it looks like | Fast, violent rejections on good volume; multiple reasons to exist (swing point plus round number plus trendline) | Slow, drifting turns on thin volume; a single touch with no confluence |
| How it behaves on retest | Price bounces quickly and closes well away from the zone | Price lingers at the zone, bounces shrink, closes creep through the edges |
| How it breaks | Usually only after repeated tests wear it down; the break is decisive and the level flips sides | Breaks casually, often on the first or second touch, with little reaction afterward |
| What to do | Plan trades around it; respect the flip if it breaks | Downgrade it or delete it; do not build a trade on it |
Support and Resistance: Your Questions, Answered
Should I use exact prices or zones?
Zones, always. Orders cluster around prices rather than on them, so a band drawn from the wick extremes and the cluster of closes will survive contact with real markets far better than a single line. Exact prices will have you calling good levels broken over a few ticks.
How many touches make a level real?
Two clear reactions are enough to call it a level, and the quality of those reactions matters more than the count. Two fast, high-volume rejections beat four lazy drifts. Past three or four touches, start worrying about decay instead of gaining confidence, because each test spends the orders that made the level work.
Why do broken levels flip sides?
Because of trapped traders. When support at 100 breaks, everyone who bought there is underwater. When price rallies back to 100, many of them sell at breakeven just to escape. That wave of breakeven selling is what turns the old floor into a new ceiling. The flip is memory working in reverse.
Do these levels work in fast markets?
They work, but they behave differently. In fast conditions, expect deeper wick overshoots through your zones and give the close even more weight than usual. Widening your bands slightly and demanding a decisive close through the level before calling it broken will save you from being shaken out by volatility alone.
Once you can read levels as zones with a history and a remaining balance of orders, the next step is seeing how those same levels behave across timeframes. A support zone on the daily chart means something different when the hourly chart is already bouncing off it, and that multi-timeframe view is where structure reading really starts to pay off.