The Aroon Indicator, Explained
Aroon measures something no momentum indicator quite measures: how recently the market printed a new extreme. Not how far price traveled, not how fast, but how fresh the record is. Two stopwatches run at once. One counts bars since the highest high of the lookback, the other counts bars since the lowest low. Fresh records mean a side of the market is still pressing; stale records mean it stopped pressing a while ago.

Tushar Chande introduced the indicator in 1995, and the construction still stands out among trend tools. Where the ADX stack averages directional ranges to grade trend strength, covered in the ADX lesson, Aroon grades trend freshness, and the two answer different questions. Both sit in the trend drawer of the four indicator categories, though, and this lesson explains what Aroon adds that the others lack.
The Two Stopwatches: the Math
Both lines use the same skeleton. Pick a lookback, twenty-five periods by default. Aroon Up equals 100 times the lookback minus the number of bars since the lookback's highest high, divided by the lookback. Aroon Down repeats that with the lowest low. The reading runs from 0 to 100.
A worked pair of numbers fixes the idea. Suppose the highest high of the last twenty-five bars printed three bars ago. Aroon Up = 100 × (25 − 3) ÷ 25 = 88. The record is fresh, so buyers get a high score. If instead that high printed twenty bars ago, Aroon Up collapses to 20: the record is old, and the buyer side has coasted ever since. The same arithmetic on the lowest low drives Aroon Down.
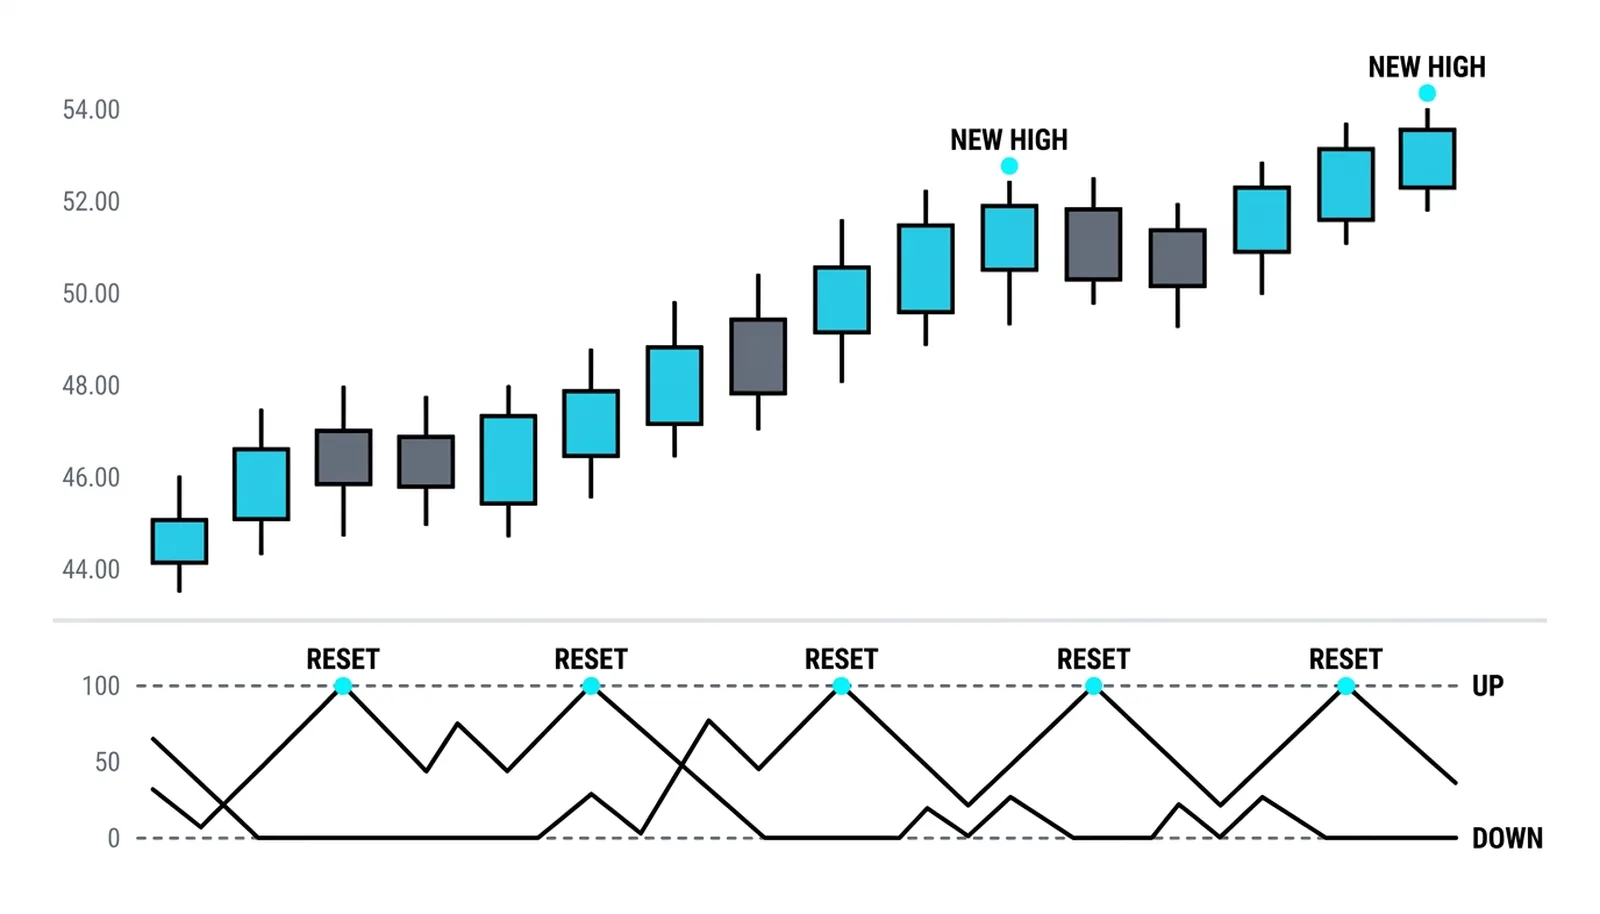
The rally above prints new highs every few bars, and Aroon Up keeps returning to the ceiling of its range. Every touch of 100 is the stopwatch resetting: a fresh record, zero bars old. Aroon Down hugs the floor the whole way because the lowest low of the window keeps getting older as price climbs.
The Regime Read: 70 and 30
The conventional thresholds split the range at 70 and 30. Above 70 means the corresponding extreme printed recently, within the last seven or so bars of a 25-bar window. Below 30 means it is stale, eighteen bars or older. The space between is undecided.
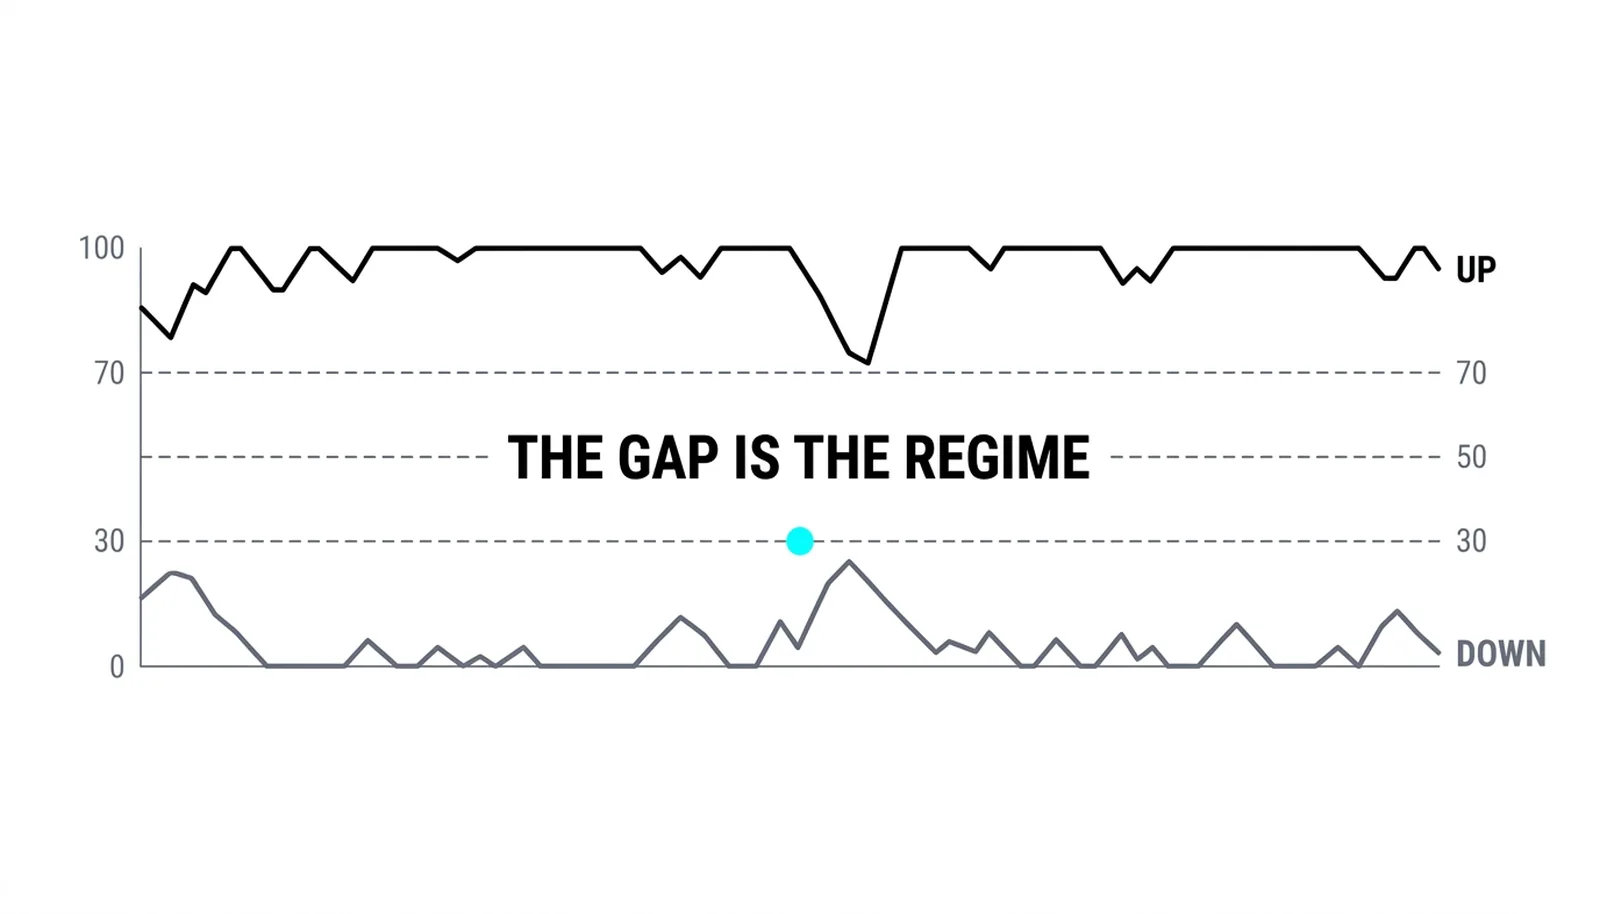
The healthy uptrend keeps one stopwatch fresh and the other stale. Aroon Up rides above 70 nearly the whole way, Aroon Down sits below 30, and the gap between them is the regime. Pullbacks nudge the pair toward each other without closing the story, because the lookback window still contains the trend's extremes.
| Reading | Meaning | The caveat |
|---|---|---|
| Up above 70, Down below 30 | Fresh highs, stale lows: uptrend regime | Description, not a timing signal |
| Both between 30 and 70 | No fresh extremes either way: range or transition | Common in chop; says stand aside |
| Both above 70 | Records printing on both sides: violent whipsaw | Happens in high-volatility reversals; treat with suspicion |
The Oscillator Variant: Up Minus Down
Some platforms plot a single line instead of two: the Aroon oscillator, which is Aroon Up minus Aroon Down, running from minus 100 to plus 100. The two-line and one-line versions contain identical information, since the oscillator is just the gap between the stopwatches. A reading of +80 means the high is fresh and the low is old; a reading of zero means both extremes printed at the same distance back, which is the neither-side-in-control state. Traders who prefer one line get cleaner charts and lose nothing; traders who prefer two see each side's stopwatch separately, which makes the crossing event easier to spot by eye.
Where Aroon Earns Its Keep
The best use is as a freshness check on everything else in the chart. A breakout you are considering: has the new high printed within the last few bars, or is the breakout riding a record from fifteen bars ago? A pullback you are watching for support: how old is the lowest low underneath it? The indicator answers freshness questions instantly, and freshness is a dimension that price bars alone make you squint for. What it cannot do is measure how big the move was, which cuts both ways: a one-tick new high scores the same 100 as a runaway breakout, and only the chart around it tells those apart.
The Cross: Regime Change in One Event
The single event most traders watch is the crossing. When Aroon Down, which had been pinned near the floor, climbs through Aroon Up, which had been riding the ceiling, the market just printed a fresher low than its last high. The stopwatches have swapped stories.
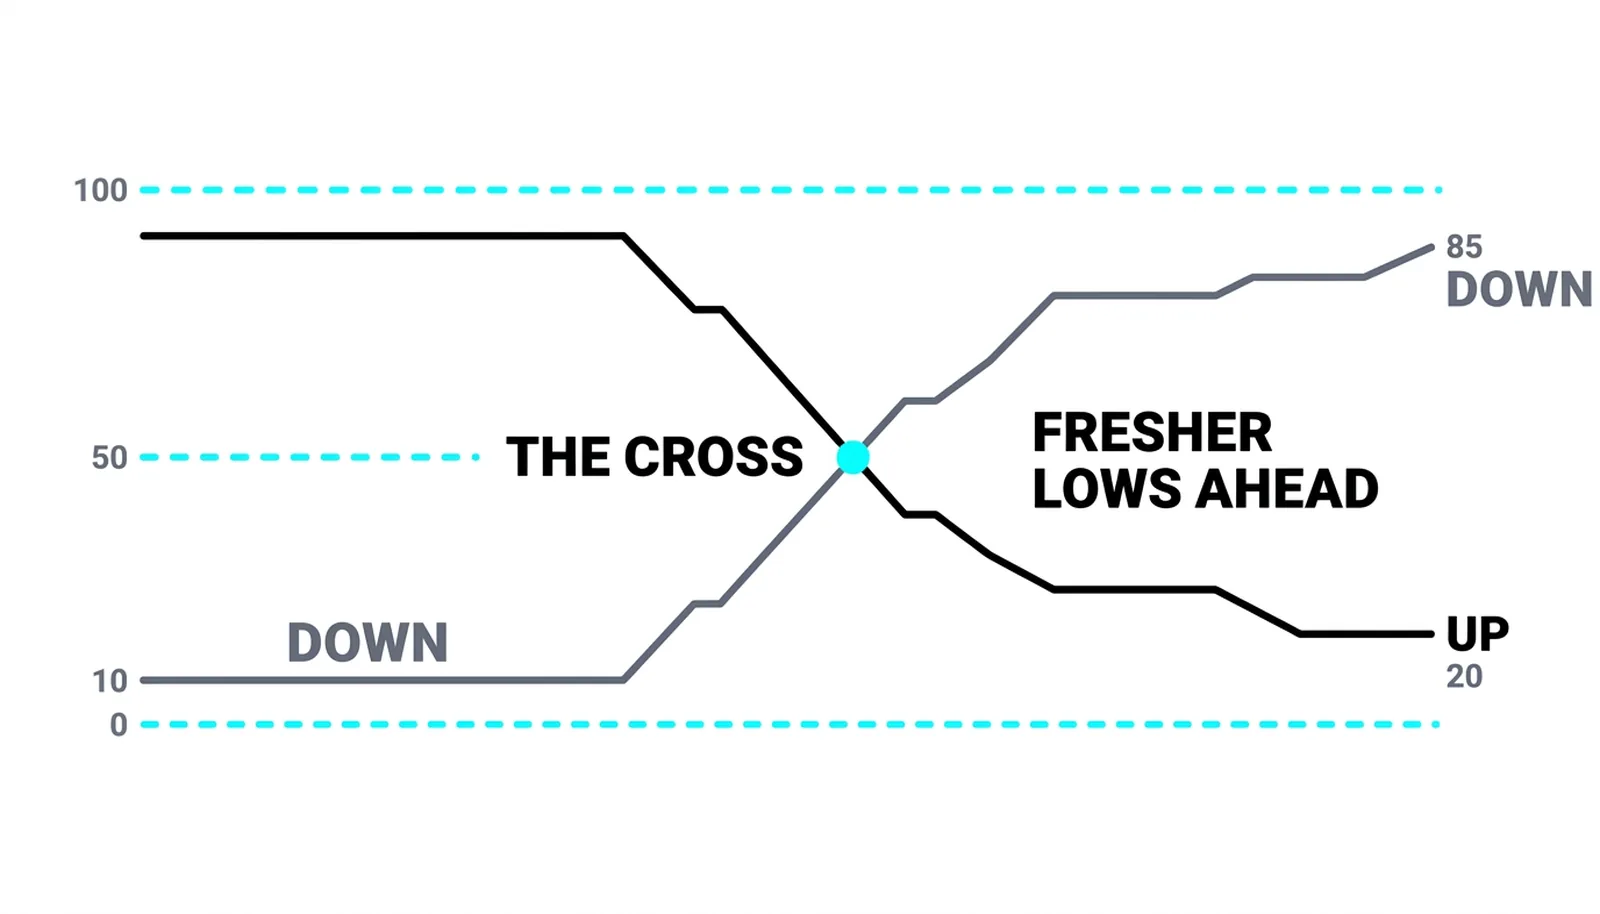
The cross above lands right as the breakdown gets going, and the lines keep separating as the downtrend prints fresher lows. As a regime signal the cross is clean: before it, the up-stopwatch owned the chart; after it, the down-stopwatch does. As a timing tool it is rougher, since a cross can only confirm what the price bars have already done, which is why the reading works best beside price structure rather than instead of it.
That price-first habit matters for everything in this course, including the divergence work in the next lesson, where a fresh price extreme that the momentum refuses to confirm is the core of the signal. Aroon contributes its own angle to that question: it tells you whether the extreme is new, which is step one of any comparison between two swing points.
Aroon, Answered
What lookback should Aroon use?
The default 25 is a sensible frame for swing trading on daily charts. Shortening it to 14 makes the lines busier and the thresholds noisier; lengthening it past 50 turns the tool into a slow regime filter. The thresholds and the lookback should move together if you change either.
How is Aroon different from ADX?
ADX averages directional ranges to grade how strongly a market trends, and it has no opinion about which extreme printed last. Aroon reads only the clock on the newest high and low. A market can carry a high ADX with stale extremes, or fresh extremes with modest ADX, and the two readings describe genuinely different conditions.
Can both lines sit above 70 at once?
Yes, and it is informative when it happens. Both stopwatches fresh means both extremes printed recently, which takes violent two-sided trade: a whipsaw day, a squeeze breaking, a gap being filled in the other direction. The reading is not a trend call in either direction; it is a volatility call, and it argues for standing aside until one stopwatch goes stale again.
Does Aroon work on intraday charts?
The math carries over, but the meaning of "fresh" shrinks with the bar size, and session noise produces extreme prints that mean less. It keeps its clearest signal where a new bar represents a meaningful unit of trade, which for most people means daily and higher timeframes.