The Nine Tests of Wyckoff Analysis
The nine tests of Wyckoff analysis are a checklist for grading a trading range: nine questions the classic accumulation and distribution framework wants answered before money goes to work, with a buying set scored at a bottom and a selling set that mirrors it exactly at a top. Each test asks whether a specific piece of evidence has printed, and the trader scores the range line by line rather than trading a hunch.

The preceding lessons built the accumulation and distribution schematics with their phases and events. Those schematics are the material. This lesson owns the grading tool. Think of an auditor working through a nine-line checklist, where the opinion only comes when every line has an answer, and one unanswered line is itself an answer.
What the Card Is For
A checklist answers what was designed to be answered. The nine tests do not predict the future. They confirm whether a range has done the work a range is supposed to do: absorb supply, transfer stock, build a cause, and prove the new trend has support behind it.
Guessing asks one vague question: is this a bottom? Scoring asks nine precise questions, each with observable evidence attached. A guess can be wrong in one undiagnosed way. A scorecard shows exactly which line failed, which line passed, and which line is still open.
That last point carries the practical weight. A pending line is not noise. The test that has not yet been passed is precisely the thing that can fail the position, so the scorecard tells the trader where the risk sits before entry, not after.
The First Four Tests: Evidence and Character
Test one: the price objective of the previous move is accomplished. The count projected from the older range has been paid out, so the decline or rally is not stopping halfway with unfinished business below or above.
Test two: the opening evidence has printed. A preliminary stopping point, a climax on heavy volume, and a secondary test on declining volume all appear. These are the phase A events from the schematics, and the test simply asks whether they showed up in the right order with the right volume shape.
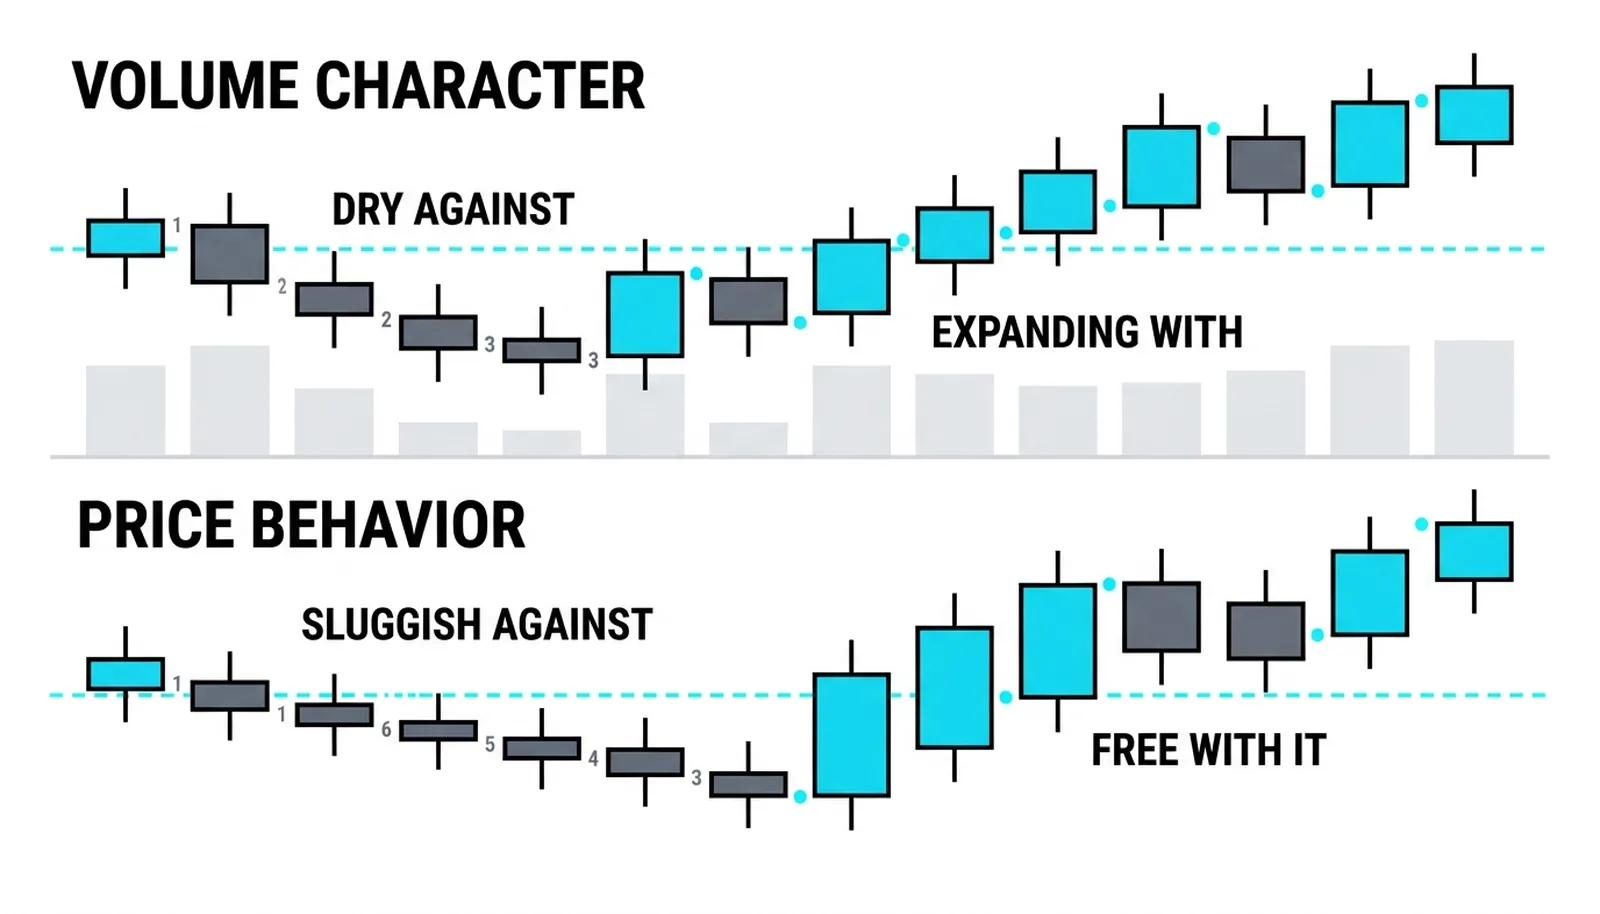
Test three: the volume character is right. Moves against the future trend carry unconvincing, drying volume, while moves with the future trend come on quiet, unpanicky volume at first and then genuine expansion. Volume should argue for the intended direction, not against it.
Test four: the price behavior is right. The market is sluggish going against the future trend and responsive going with it. At a bottom, declines crawl and rallies move freely. At a top, the reverse. Price should travel easily in the direction the trader plans to trade.
The Middle Tests: Cause and the Edge
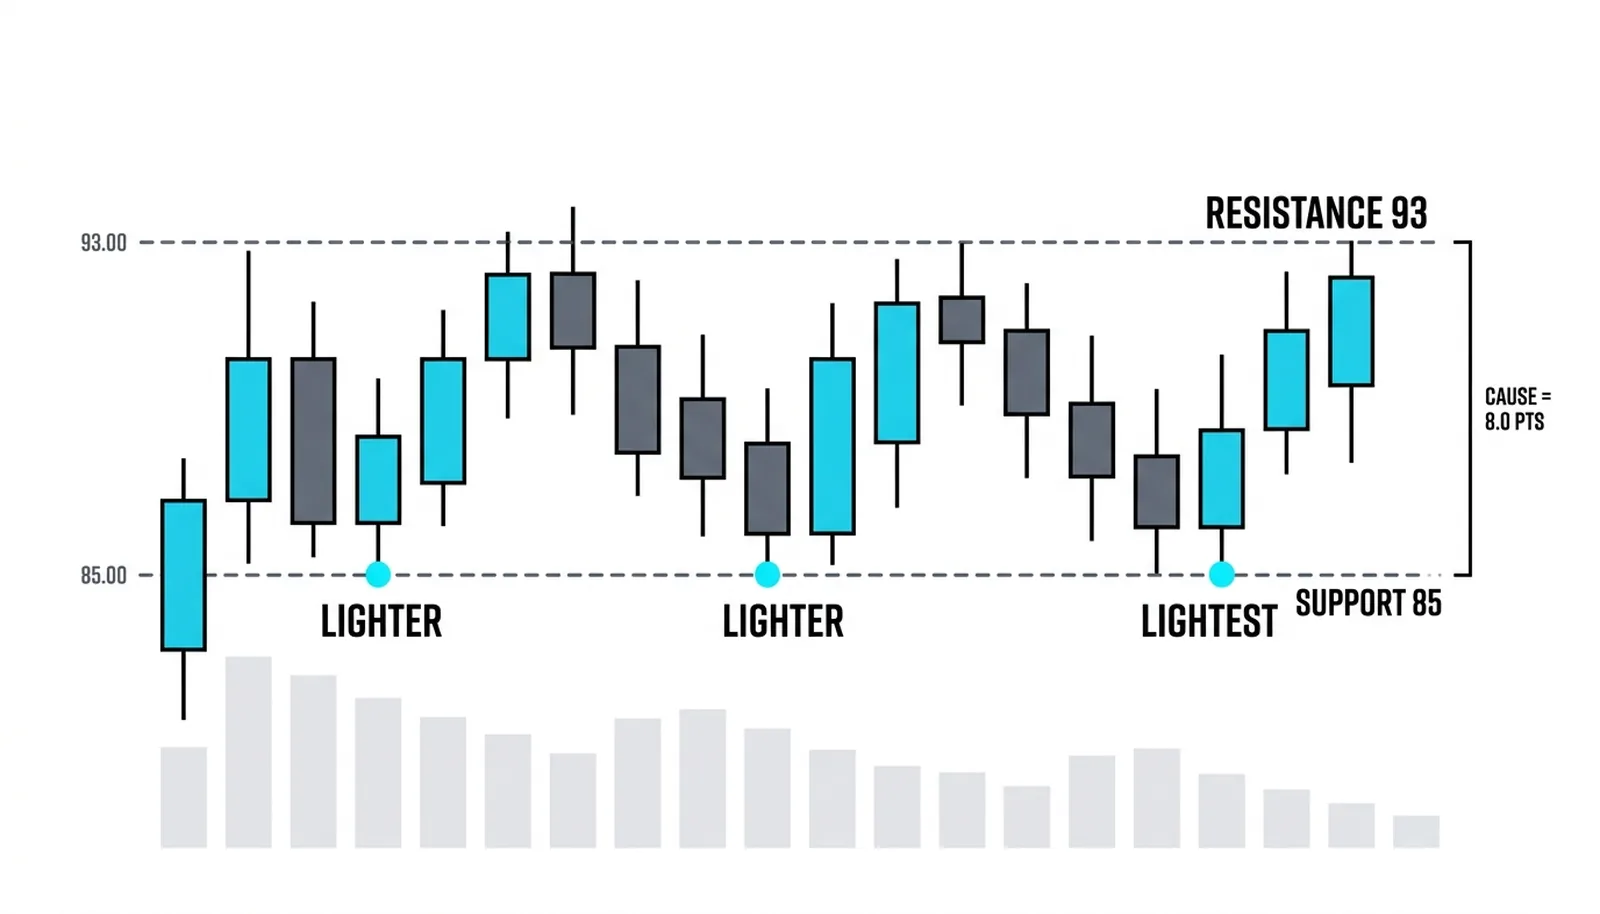
Test five asks about time. The range must run long enough to build a fresh cause, and that means weeks of sideways travel, not days. A cause built over four sessions projects a small move. A cause built over four months can carry a campaign. The count method from the schematic lessons measures this cause, but the test only asks whether enough time passed for one to form.
Test six watches the returns to the range edge. Each trip back toward support at a bottom, or resistance at a top, should arrive on lighter volume than the last and should hold. Fading volume at the edge means the supply or demand at that boundary is being consumed.
This is the quiet heart of the method. The edge is where the range proves itself, and each successful test on shrinking volume is one more confirmation that the other side is running out of stock.
The Last Three Tests: Proof
Test seven: the terminal shakeout has printed and recovered. At a bottom, the spring dips below support and closes back inside the range. At a top, the upthrust pokes above resistance and fails back in. The shakeout is where weak holders give up their shares, and the recovery is the passing grade.
Test eight: the breakout from the range carries expansion and follow-through. A sign of strength leaving an accumulation range, or a sign of weakness leaving a distribution range, must travel on clearly larger volume than the range's interior and must keep moving. A breakout that stalls at the boundary is not a breakout.
Test nine: the pullbacks after the breakout hold on light volume. The shelves above a broken range top, and the failing rallies below a broken range bottom, confirm the new trend has hands behind it. The market should refuse to go back.
The Selling Set: The Mirror
Every line flips at a top, and the mirror is exact. Test one becomes the upside objective accomplished. Test two becomes the buying climax and secondary test on declining volume. Tests three and four ask whether rallies are sluggish and declines responsive, with volume unconvincing on the way up.
Test five still asks about time, since distribution needs a cause just as accumulation does. Test six watches returns to resistance fade on lighter volume. Test seven is the upthrust instead of the spring. Test eight is the sign of weakness breaking support on expansion. Test nine is the failing rally that cannot reclaim the range.
One honest note on sources: the numbering and wording of the tests varies between books in the Wyckoff tradition. This lesson paraphrases the checklist plainly rather than quoting any one edition. The content is stable even where the count is not.
A second honest note: a perfect card is rare. Real ranges score six or seven of nine with one or two lines pending, and the trader's job is to know exactly which lines are open and what those open lines would cost if they fail.
One Range, Scored
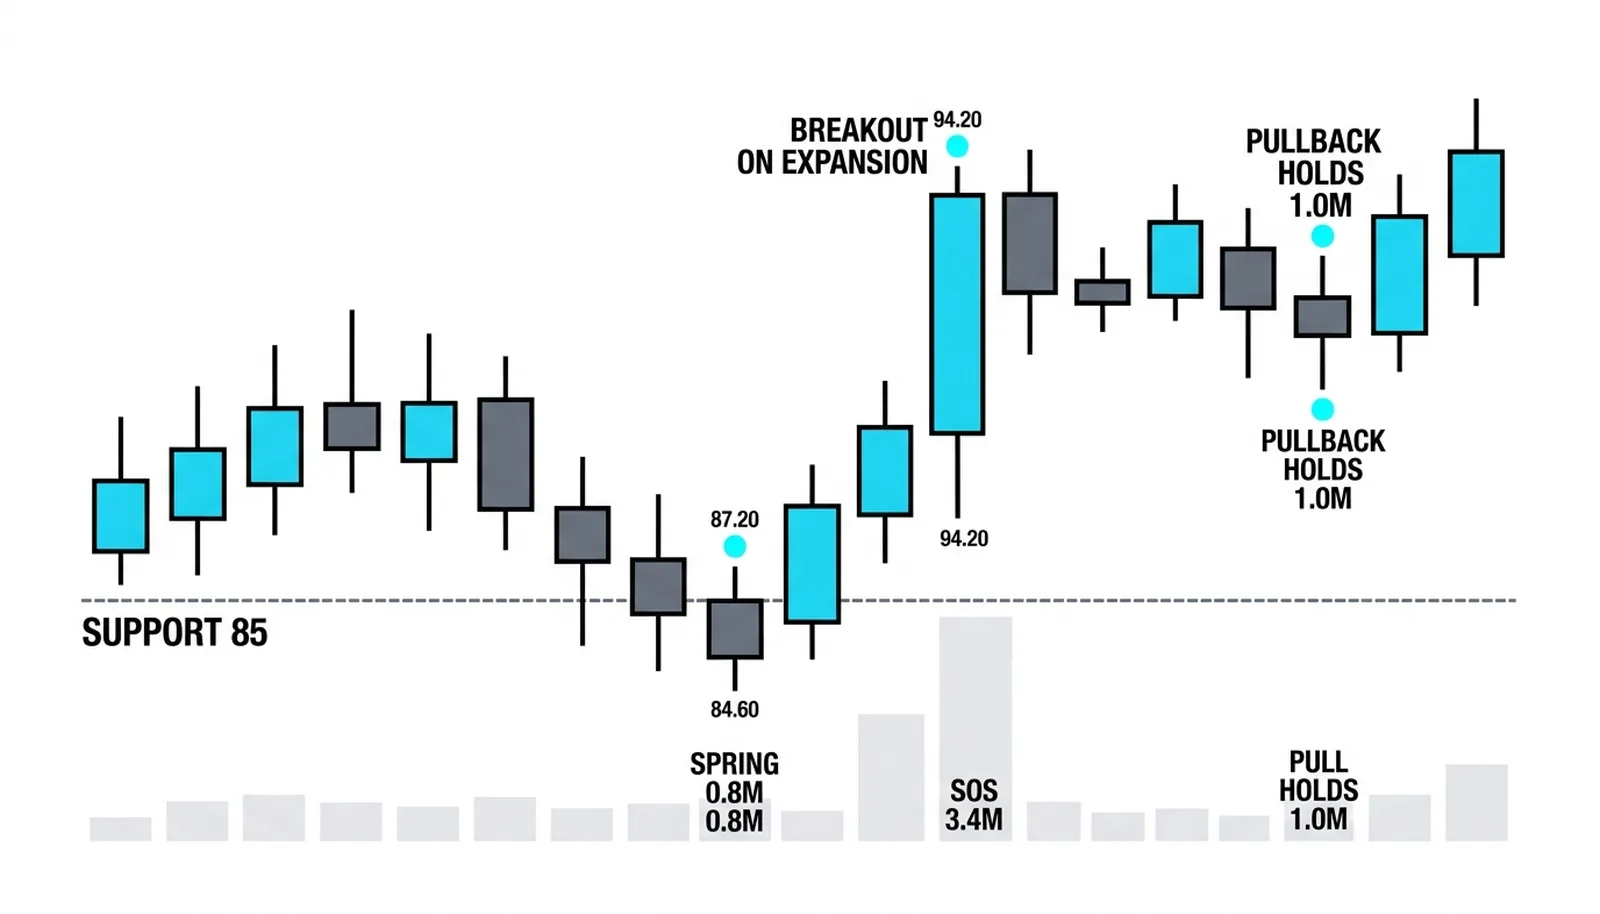
All numbers here are invented round figures for illustration. A stock declines from 108 and prints a selling climax at 85.2 on 5.8 million shares against a 1.4 million average, closing at 86.4. The secondary test holds at 86.9 on 1.1 million. The range between 85 and 93 then runs four months. Rallies toward the top expand from 0.9 to 2.1 million shares while reactions stay quiet at 0.7 to 0.9 million. A spring pokes 84.6 on 0.8 million and closes at 87.2. A sign of strength breaks out to 94.2 on 3.4 million. The first pullback holds at 92.1 on 1.0 million. The cause measures 8.0 points, projecting 101.0.
Scored line by line: test one passes, the decline from 108 reached its projected zone. Test two passes, climax plus secondary test on falling volume. Tests three and four pass, volume and behavior both favor the upside. Test five passes, four months of cause. Test six passes, reactions shrank to 0.7 million. Test seven passes, the spring printed and recovered. Test eight passes, the breakout ran on 3.4 million. Test nine is pending at the moment of the read, since only one pullback has held. Eight answered and passed, one open, and the open line is the risk: if the next pullback breaks 92 on expansion, the scorecard says so immediately.
| Test | Accumulation Question | Distribution Mirror | Passing Looks Like |
|---|---|---|---|
| 1 | Downside objective accomplished? | Upside objective accomplished? | Old count fully paid out |
| 2 | Climax and secondary test printed? | Buying climax and secondary test printed? | Retest on clearly lower volume |
| 3 | Volume favors the upside? | Volume favors the downside? | Quiet with trend, dry against it |
| 4 | Price responsive upward? | Price responsive downward? | Sluggish against, free with |
| 5 | Enough time to build a cause? | Enough time to distribute? | Weeks of sideways travel |
| 6 | Support tests fading on volume? | Resistance tests fading on volume? | Each return lighter than the last |
| 7 | Spring printed and recovered? | Upthrust printed and failed? | Shakeout closes back inside |
| 8 | Breakout on expansion? | Breakdown on expansion? | Wide move, follow-through |
| 9 | Pullbacks holding on light volume? | Rallies failing on light volume? | Market refuses to return |
The Nine Tests, Answered
What are the nine buying tests in the Wyckoff method?
The nine buying tests are the classic accumulation and distribution framework's checklist for confirming an accumulation range: objective accomplished, climax evidence printed, volume character correct, price behavior correct, sufficient time for a cause, fading tests of support, a spring that recovers, a breakout on expansion, and pullbacks that hold on light volume.
What are the nine selling tests?
The nine selling tests are the exact mirror applied at a top. Each question flips direction: upside objective paid, buying climax and secondary test, volume and behavior favoring the downside, time to distribute, fading returns to resistance, an upthrust that fails, a breakdown on expansion, and rallies that cannot reclaim the range.
How many of the nine tests should pass before you trade?
There is no fixed minimum, but six or seven passing lines is a realistic working standard, because perfect cards are rare. What matters is knowing which lines are pending, since each open line is a live risk the position still carries.
Do the nine tests work on any timeframe?
Yes, because the tests grade behavior rather than clock time. A range on an hourly chart and a range on a weekly chart both print climaxes, springs, breakouts, and pullbacks, and the same nine questions apply to each. The next lesson takes the full method across multiple timeframes and shows how the same scorecard reads at every scale.