The Wyckoff Accumulation Schematic
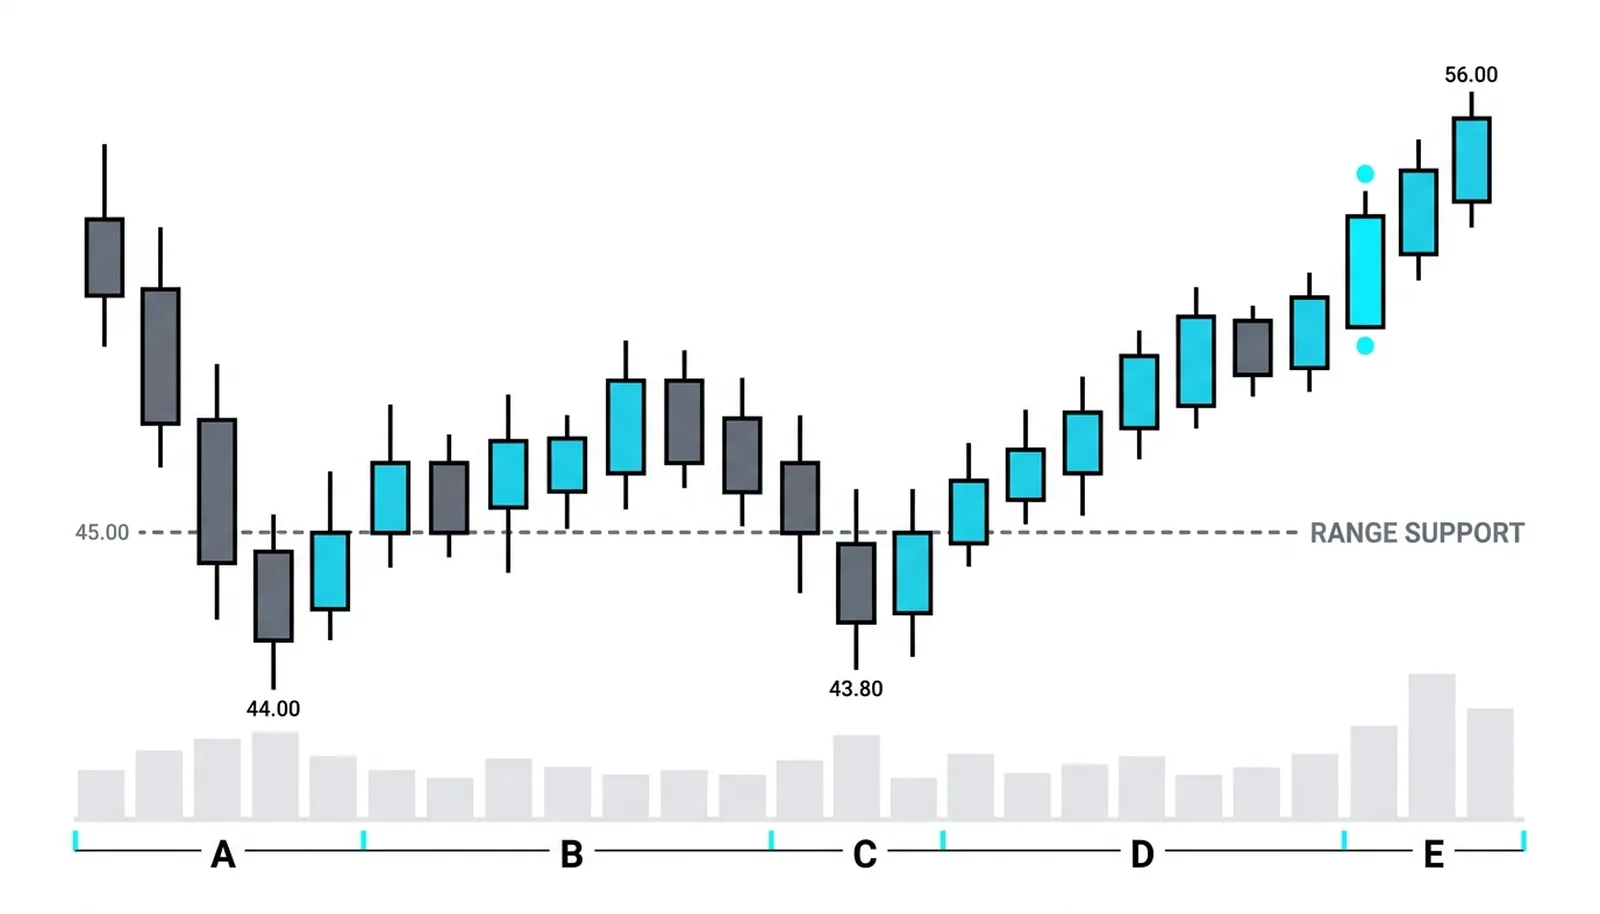
The Wyckoff accumulation schematic is the classic map of how a bottom forms: five phases running from the climax that stops a decline to the breakout that delivers the new uptrend, with named events at each stage. Instead of guessing whether a range is a bottom or a pause before more downside, you get checkpoints. Each event either confirms the story or breaks it.

Think of it as a novel told in chapters, where each chapter has one job and skips none of the setup. Phase A stops the fall. Phase B builds the cause. Phase C tests. Phases D and E deliver the trend. Read them in order and the price action stops looking random.
The previous lessons introduced the composite man, the actor behind the moves, and the four market phases, the cycle this range sits inside. This lesson zooms into one slice of that cycle, the accumulation phase, and draws its detailed map. Everything here assumes you already know who is supposedly buying and why a range exists at all.
Phase A: Stopping the Fall
Phase A is where the downtrend dies. Four events mark it, and each one tells you something different about supply.
Preliminary Support is the first sign the decline is being met. Price is still falling, but buyers start showing up in size, and the down moves begin to stall at lower lows instead of accelerating.
The Selling Climax is the panic flush. Wide down bars, huge volume, public capitulation. This is where weak hands exit and large interests absorb what they sell.
The Automatic Rally is the bounce off that flush. Once the selling pressure is exhausted, price snaps back hard on its own, and that rally defines the top of the new trading range.
The Secondary Test is the quiet return toward the low. Price revisits the climax area, but this time volume shrinks and the spread narrows. Supply is drying up.
The stopping volume and climax lessons covered the mechanics of these events in detail, so treat this as the map those events plug into. The point of Phase A is simple: supply has finally been met by demand large enough to stop the decline.
Phase B: Building the Cause
Phase B is the longest stretch of the schematic, and the dullest to watch. Price chops sideways between the Automatic Rally high and the climax low. Rallies get sold. Dips get absorbed. Nobody makes money except the patient.
This two-way trade has a purpose. Every dip that gets bought on falling volume is the composite interest accumulating stock without pushing price up. Every rally that gets capped keeps the range intact so accumulation can continue. The boredom is the process working.
The Wyckoff method's law of cause and effect says the horizontal build during this phase is the cause, and the trend that eventually follows is the effect. A longer, well-built Phase B supports a larger move later. Traders who get shaken out here usually leave right before the range starts paying.
Phase C: The Test
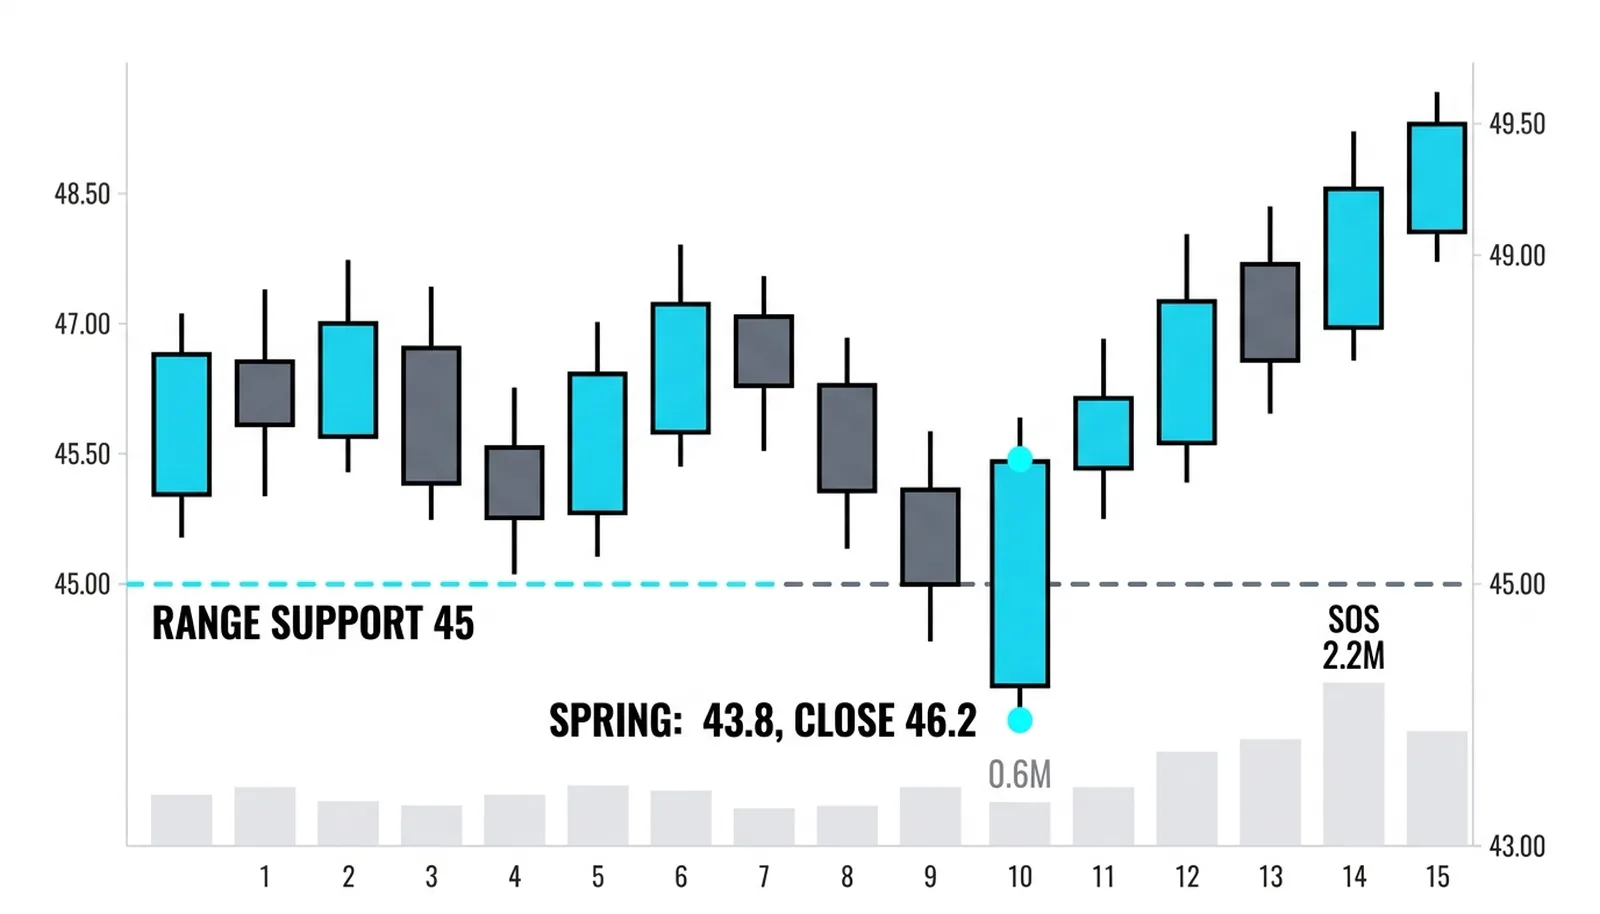
Phase C holds the schematic's sharpest buy point: the Spring. Price pokes below range support, stop orders trigger, late shorts pile in, and then price recovers, often closing back inside the range on low volume. The poke below finds no supply left. Nobody is actually selling down there, only stops getting cleaned out. A Spring that recovers quickly on thin volume is one of the strongest single signals in the whole method, because it proves the downside is empty.
That single paragraph is deliberate. The Spring deserves its own treatment, and the next lesson is a deep dive on exactly that event: how to read it, how to trade it, and how it fails.
Phases D and E: Demand Takes Over
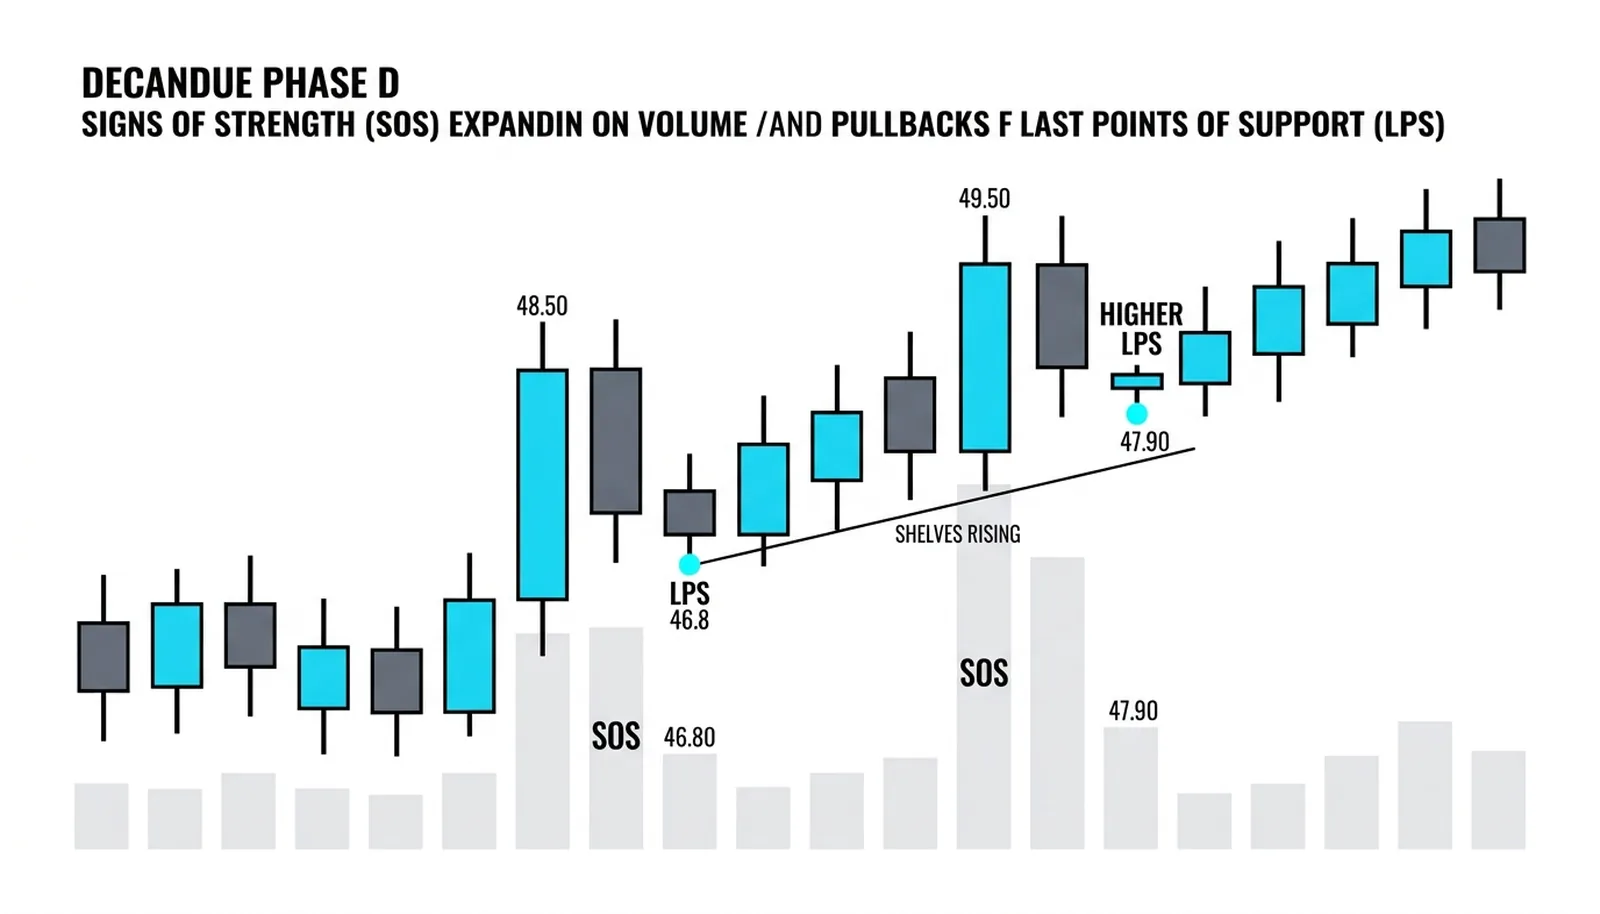
Phase D is where the evidence stacks up. Price starts making higher lows inside the range. Signs of Strength appear: wide up bars on expanding volume, demand finally showing itself in the open. Between those pushes, pullbacks stall at progressively higher levels, forming Last Points of Support, the rising shelves where dips get bought before price can fall back into the middle of the range.
Each shelf is one more piece of evidence that supply is gone. A trader watching Phase D should see volume expand on rallies and contract on pullbacks, over and over.
Phase E is the resolution. Price breaks out of the range, the cause built in Phase B converts into effect, and the markup phase begins. The schematic's job is done the moment the trend is delivered.
One Schematic, Measured
Hypothetical numbers, invented for illustration. A stock declines for months and the fall ends at 44 with a Selling Climax printing 4.1 million shares against a 1.3 million average. That is panic, and it is being absorbed.
The Automatic Rally carries price to 49, setting the top of the range. The Secondary Test comes back down and holds 45.5 on only 1.1 million shares. The low held, and the volume collapsed. Supply is thinning.
Weeks of chop follow between 45 and 49. Rallies toward 49 get sold, dips toward 45 get absorbed. Phase B, doing its slow work.
Then the Spring: price dips to 43.8, below the range, on just 0.6 million shares, and closes back at 46.2 the same session. The break found no sellers. A Sign of Strength bar follows, printing 2.2 million shares up to 49.5. A pullback holds 47.9 on 0.8 million, a Last Point of Support. The breakout follows, and Phase E delivers the trend.
| Phase | Events | Volume Texture | What It Proves |
|---|---|---|---|
| A | PS, SC, AR, ST | Climax spike, then shrinking on the test | The decline is stopped and supply is met |
| B | Rallies sold, dips absorbed | Mixed, generally declining | The cause is being built quietly |
| C | Spring | Very low on the break, recovery follows | No supply left below the range |
| D | SOS, LPS shelves | Expanding on rallies, contracting on dips | Demand has taken control |
| E | Breakout | Strong and sustained | The effect is delivered |
Now the honesty. The schematic is how accumulation tends to unfold, not a template every range follows. Real ranges skip events, repeat events, and shuffle the order. You will see two Secondary Tests and no clean Spring, or a Spring that arrives before a proper Automatic Rally. The phase logic matters more than the labels: stopped supply, a built cause, a successful test, then demand in control. If you can identify those four conditions in a messy range, you understand the schematic better than someone who can recite every label but freezes when the chart improvises.
The Wyckoff Accumulation Schematic, Answered
What is the Wyckoff accumulation schematic?
It is the Wyckoff accumulation schematic's map of how a market bottom forms, laid out in five phases from the climax that stops the decline to the breakout that starts the new uptrend. Each phase contains named events, such as the Selling Climax and the Spring, that act as checkpoints so traders can judge where the range stands instead of guessing.
What is a spring in Wyckoff analysis?
A Spring is a poke below range support late in accumulation that quickly recovers, usually on low volume. It triggers stop orders and traps late shorts, and its recovery proves there is no real supply below the range. It is considered one of the best buying points in the schematic, and the next lesson covers it in full detail.
What is the difference between phase B and phase C?
Phase B is the long sideways build where the cause is constructed through repeated absorption of dips and selling of rallies. Phase C is the short, decisive test of that work, usually a Spring, that checks whether any supply remains below the range. Phase B is the process; Phase C is the check.
Does every accumulation follow the schematic?
No. Real ranges skip events, repeat them, and rearrange the order. The schematic shows the typical path, but the underlying logic, stopped supply, built cause, successful test, rising demand, is what you should actually be tracking on the chart.
Next up: the Spring gets its own lesson, including how it fails and what separates a tradable one from a trap that keeps falling.