Wyckoff Across Multiple Timeframes
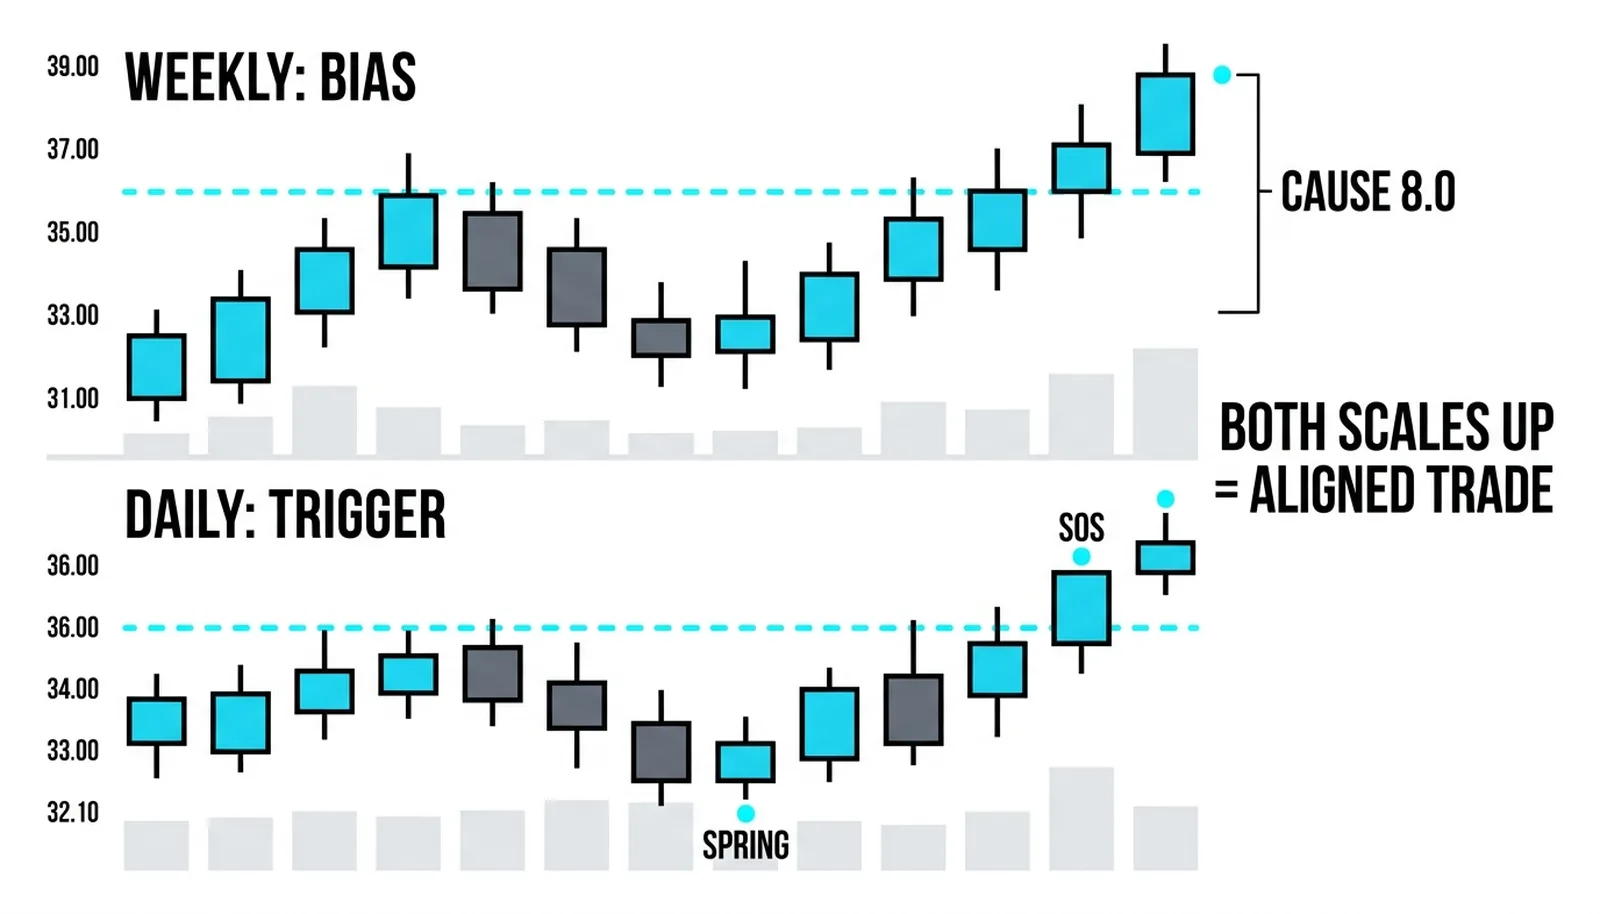
Wyckoff across timeframes comes down to one idea: the method reads the same on every scale, and the practical skill is dividing the labor between them. The campaign phases, the events, the springs and upthrusts, all print on monthly charts and hourly charts alike. The higher timeframe sets the bias. The lower timeframe sets the timing. That division is the working model.

Think of it like listening to an album before judging the single: a great track cannot rescue a bad album, and a bad track cannot sink a good one. The big chart is the album. The small chart is the track. You need both to agree before the trade deserves your money.
The preceding lessons own the schematics, the events, and the nine-test checklist, so this one does not re-teach them. This lesson owns scale: what happens when the charts disagree with each other, and how to decide which chart wins. The generic multi-timeframe skills from earlier levels, reading structure top-down and matching candle context across scales, carry over unchanged and are not repeated here.
The Method Is Scale-Free
The method rests on a simple observation: large interests run campaigns, and campaigns leave the same marks regardless of how long they take. A distribution that unfolds over eighteen months on a weekly chart produces the same sequence of events as a distribution that unfolds over three days on a five-minute chart. Preliminary supply, buying climax, automatic reaction, secondary test, upthrust, sign of weakness. The labels do not care about the clock.
The composite operator, the Wyckoff method's personification of the combined smart money, runs the same campaign on every scale at once. A weekly accumulation can contain a dozen daily accumulations and distributions inside it, each one complete, each one tradeable on its own terms. The method is fractal because the behavior behind it is fractal. Buying and selling pressure organize the same way whether the campaign lasts a quarter or a lunch hour.
This is part of why the Wyckoff framework transfers across markets and eras better than most: the campaign logic does not tune to a scale, and committed capital behaves the same at every magnification.
Bias From Above, Timing From Below
The workflow has two steps and they happen in order. First, read the higher timeframe and name its phase. Accumulation, markup, distribution, markdown, or an unlabeled range you refuse to guess at. Second, drop down one scale and wait for that scale to print a tradeable event aligned with the higher reading. A spring or a sign of strength inside a higher accumulation. An upthrust or a sign of weakness inside a higher distribution.
The higher chart is allowed to decide direction, location, and whether a trade should exist at all. It answers: which side of the market has the campaign behind it. The lower chart is allowed to decide the entry, the stop placement, and the trigger. It answers: when, exactly, do you act.
Timing lives one scale down. The weekly gives the trade, the daily gives the entry. The daily gives the trade, the hourly gives the entry. Skipping this division is how traders end up with a correct opinion and a terrible fill: buying a weekly accumulation at the top of a daily rally.
One rule settles every dispute: the higher timeframe always wins the argument. When the two scales conflict, the bigger chart is right by definition, because the bigger chart is where the larger campaign lives.
Cause Is Scale-Bound
the Wyckoff method's law of cause and effect says the horizontal range builds a cause, and the cause funds a measured objective. The part traders get wrong is that cause is scale-bound. A weekly range height funds a weekly objective. A daily range height funds a daily objective. They are separate accounts.
The mixing error looks like this: a trader counts the cause on a small daily range, then projects the target as if the weekly range built it. The count says four points, the trader expects fourteen, and the position gets held long past the level the actual cause paid for. Targets become imaginary the moment the scales get blended.
The error comes from optimism, not arithmetic. The big number is more exciting, so the small range gets credited with it. The fix is mechanical: whatever chart you counted the cause on, that chart owns the objective. If you want the bigger target, you wait for the bigger range to finish building.
When the Scales Disagree
The conflict case deserves blunt treatment. A beautiful daily spring inside a weekly distribution is a trap borrowed from a dying campaign. The daily test can pass every item on the nine-point checklist while the weekly campaign runs the other way. The spring works for a few days, the rally dies at weekly resistance, and the trader who bought the perfect daily event holds a loss inside a weekly markdown.
This is not a flaw in the spring. The spring did its job on its own scale. The failure is the trader's, for treating a local event as a campaign signal. An aligned trade only exists when both scales read the same direction: the weekly in accumulation or markup, the daily printing a spring or sign of strength inside it, or the mirror image on the short side.
The second honesty beat is the noise floor. Small timeframes print fussier schematics. Volume data quality degrades as the scale shrinks, sessions fragment the tape, and random inventory flows start to look like composite-man events. Not every wiggle deserves a phase label. Sometimes a range is just a pause, and forcing a Wyckoff label onto noise produces confident analysis of nothing. When the schematic will not resolve cleanly, the correct reading is no reading.
One Campaign, Two Scales
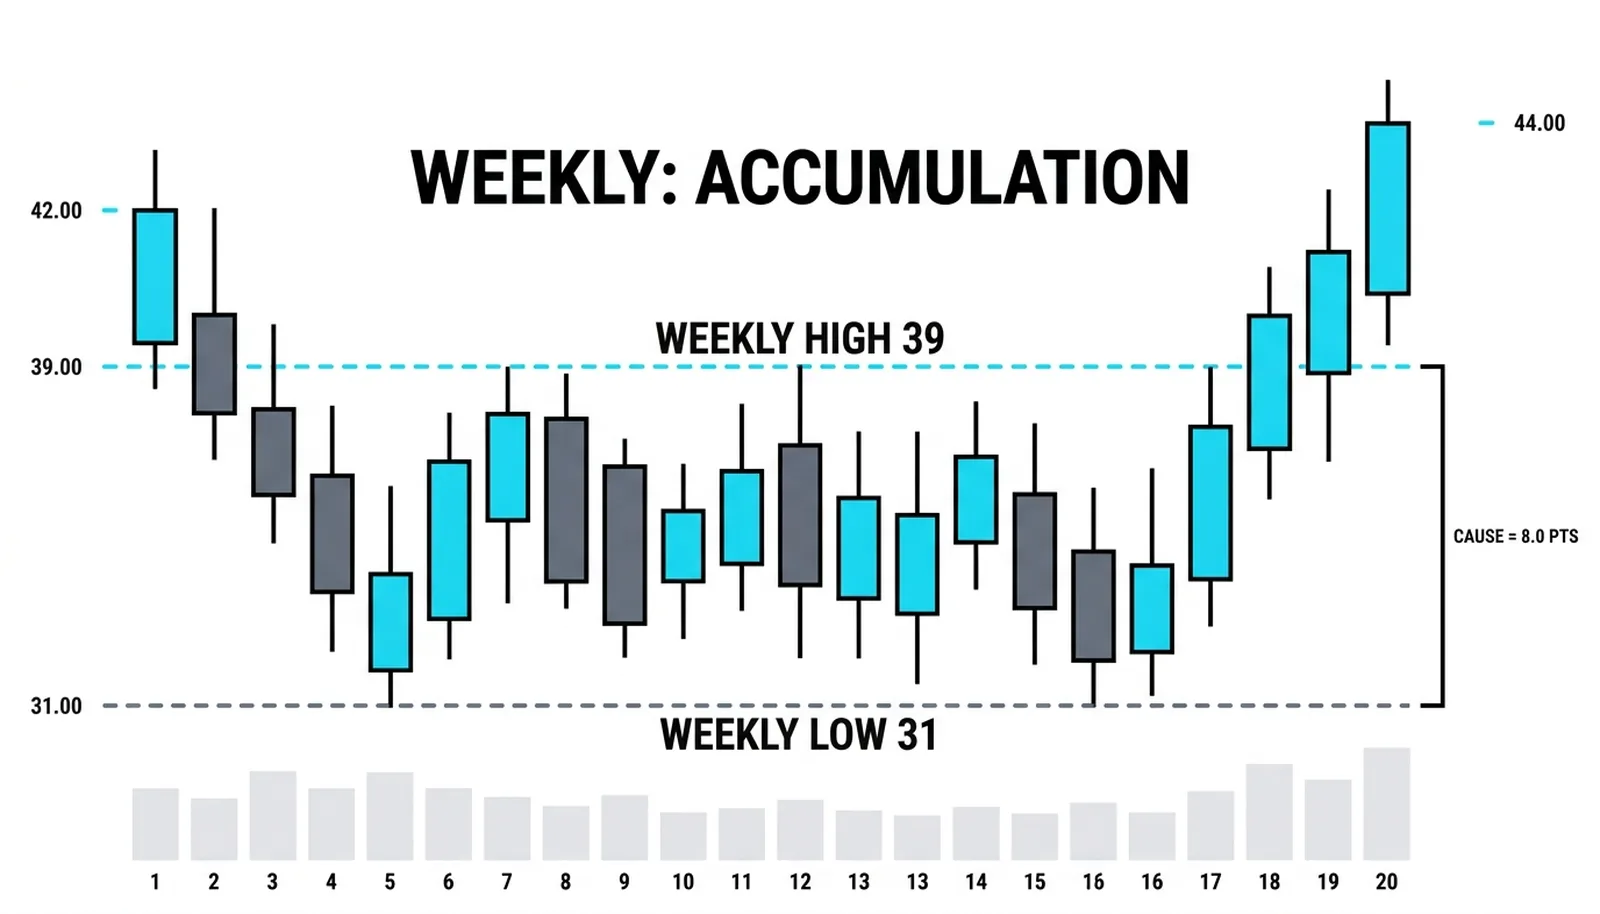
Hypothetical numbers, invented for illustration. A stock falls from 58 in a bear market and then spends five months ranging between 31 and 39 on the weekly chart. The weekly reads as accumulation: selling climaxes and secondary tests on the way down into support, shrinking volume on the dips, expanding volume on the rallies. The weekly range height is 8.0 points, so the weekly cause counts 8.0 points of objective once the range resolves.
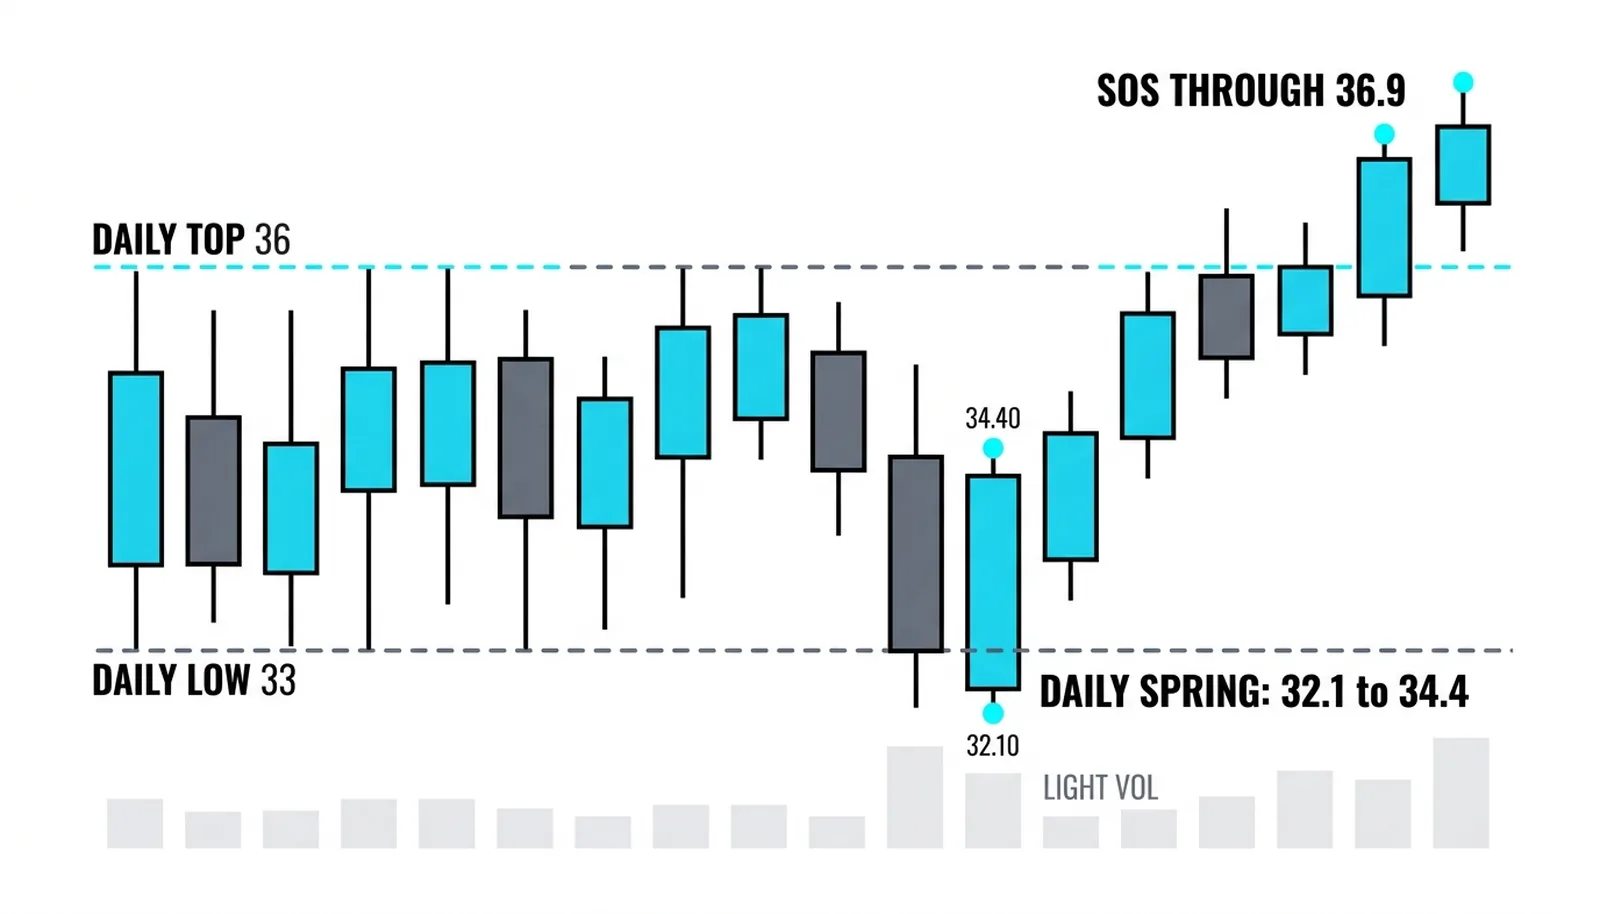
Inside that weekly range, the daily chart builds its own smaller structure: a six-week range between 33 and 36. This is the scale that will provide the entry. The daily prints a spring that pokes down to 32.1 on light volume and closes at 34.4 the same session. Light volume on the break, strong close back inside the range: the daily event is valid, and it sits inside a weekly accumulation, so the alignment test passes.
The daily sign of strength carries price to 36.9, breaking the daily range top. From there the move extends through the weekly resistance at 39. Now the weekly event has printed too: the weekly range has resolved upward. The weekly cause projects 39 plus 8.0, an objective of 47.0. Notice the accounting: the daily range, only 3 points tall, never gets asked to fund this target. The weekly cause pays for the weekly objective.
What would have cancelled the trade at each step? On the weekly, a sign of weakness below 31, or an upthrust failing at 39 with expanding volume, would have re-labeled the whole structure as distribution and killed any long. On the daily, the spring closing back below 33 on heavy volume, or the sign of strength failing to clear 36.9, would have cancelled the entry while leaving the weekly bias intact. The weekly decides whether a long should exist. The daily decides when. Neither is allowed to do the other's job.
| Scale | What it shows | What it decides | What would cancel it |
|---|---|---|---|
| Weekly | Five-month accumulation, 31 to 39, cause of 8.0 points | Bias, direction, the 47.0 objective | Sign of weakness under 31, or failed upthrust at 39 |
| Daily | Six-week range, 33 to 36, inside the weekly structure | Entry zone and stop location | Range resolving downward before any spring |
| Daily spring | Poke to 32.1 on light volume, close at 34.4 | The trigger to enter long | Close back under 33 on heavy volume |
| Daily sign of strength | Rally to 36.9, then through weekly 39 | Confirmation, add or hold | Failure to clear 36.9, or rejection back under 39 |
Wyckoff Across Timeframes, Answered
Does the Wyckoff method work on all timeframes?
Yes, the campaign logic is scale-free. The same phases and events print on monthly, weekly, daily, and intraday charts because the underlying behavior, large interests building and unloading positions, repeats at every magnification. The practical limit is the noise floor: on very small scales, volume quality degrades and random flow mimics events, so the method works but the labels get less reliable.
Which timeframe should you trade Wyckoff on?
Trade one scale below the timeframe that gives you the bias. If the weekly accumulation is your reason for the trade, execute on the daily spring or sign of strength inside it. The higher chart owns the opinion, the lower chart owns the entry, and mixing those jobs is where most Wyckoff trades go wrong.
What happens when two timeframes disagree?
The higher timeframe wins, always. A daily spring inside a weekly distribution is a trap from a dying campaign, not a buying opportunity. The aligned trade only exists when both scales read the same direction, so a conflict means no trade, not a smaller trade.
How do you measure the Wyckoff objective across timeframes?
Count the cause on the same scale you expect the effect on. A weekly range height funds a weekly objective, a daily range height funds a daily one, and the two accounts never blend. If you want the bigger target, wait for the bigger range to finish building and resolve.
With the Wyckoff block complete, the volume work continues: auction market theory, where the range, the value area, and the two-way auction explain why those campaigns exist at all.