Sign of Weakness: Wyckoff SOW and LPSY
Weakness at a market top does not arrive quietly; the sign of weakness is the wide-spread, heavy-volume down bar that breaks a distribution range's support, the supply-side mirror of the sign of strength. The last points of supply are the feeble rallies that follow it, where final sellers unload the last of their inventory onto hopeful buyers before the markdown begins.

A topping campaign, in the classic accumulation and distribution framework, is a retreat conducted in stages. A retreating army fights a series of rearguard actions, each stand weaker than the one before it, and each failed stand marks the front line further back. That is the shape of phase D: a break, then rallies that cannot recover the ground the break took.
The Sign of Weakness: Supply Goes Public
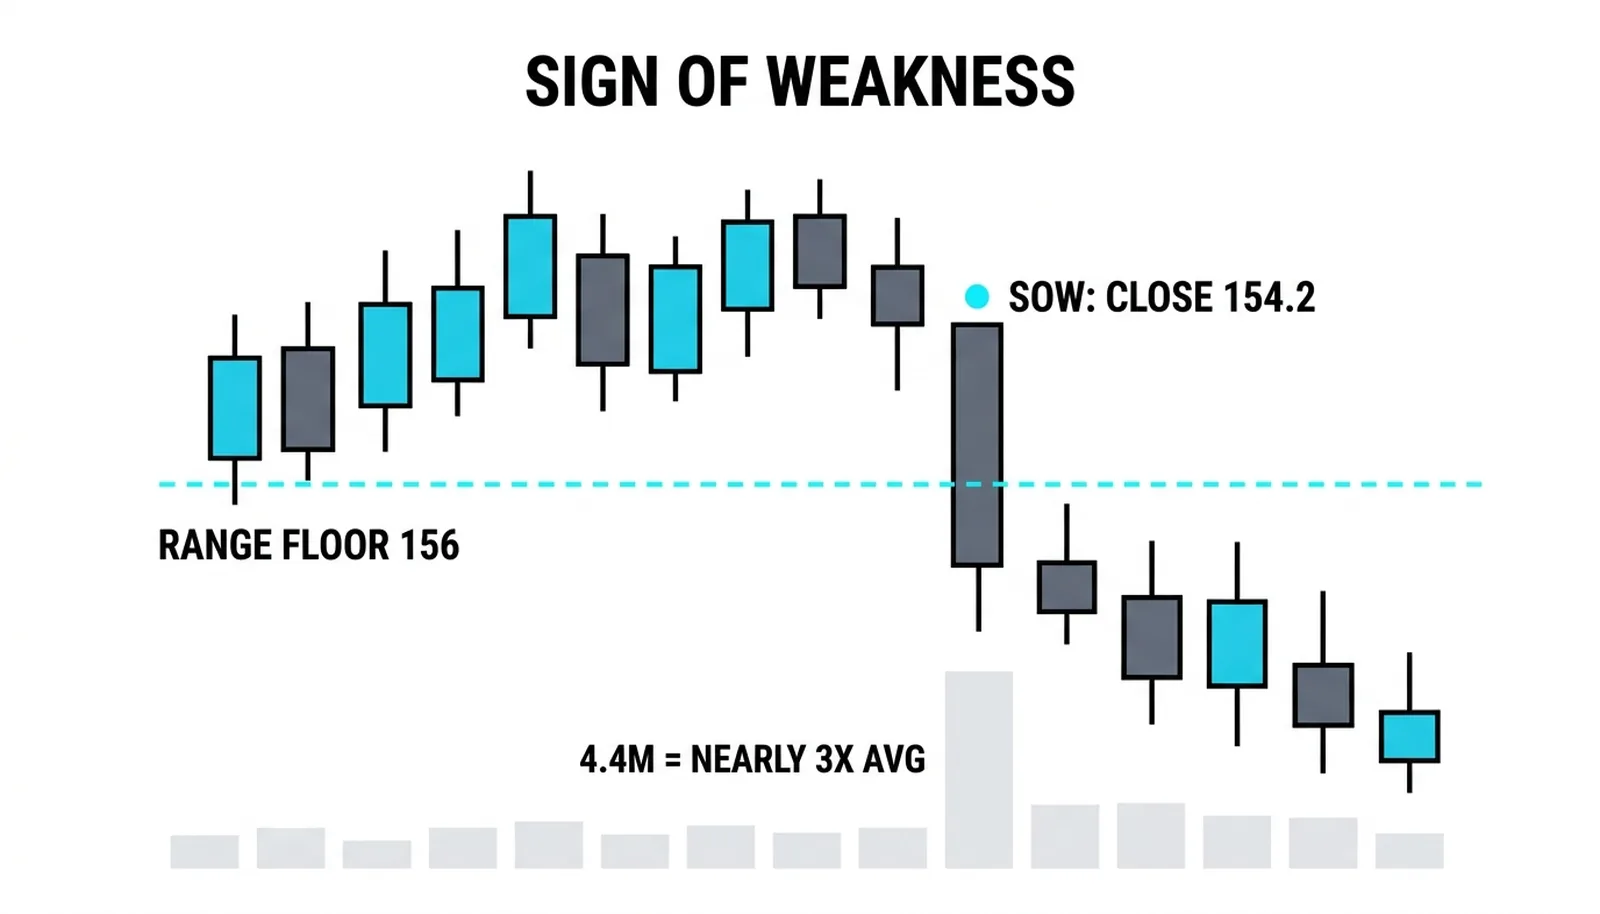
The sign of weakness, SOW, is a specific bar with a specific job. It prints a wide spread downward, closes in the lower part of its range, and does so on volume clearly above the range average. Most important, it takes out the range floor or the automatic-reaction low that had held for weeks.
That floor is the line the campaign defended. Every prior dip into it was bought, which is what built the range in the first place. When a single bar slices through it on heavy volume, the defense has stopped showing up. Supply is no longer being rationed quietly at the top of the range. It is being dumped in public.
The bar only means this because a range sits behind it. A heavy down bar in the middle of nowhere is just a bad day. A heavy down bar that breaks a two-month shelf after a long advance is a statement from the largest holders in the market. The distribution schematic lesson mapped where this bar lives: phase D, the confirmation phase, after the buying climax, the secondary tests, and the upthrust have already done their work.
This is the mirror of the sign of strength from the accumulation lessons. There, demand broke the ceiling on expanding volume. Here, supply breaks the floor on expanding volume. Same grammar, opposite direction.
The Last Point of Supply: The Last Fare
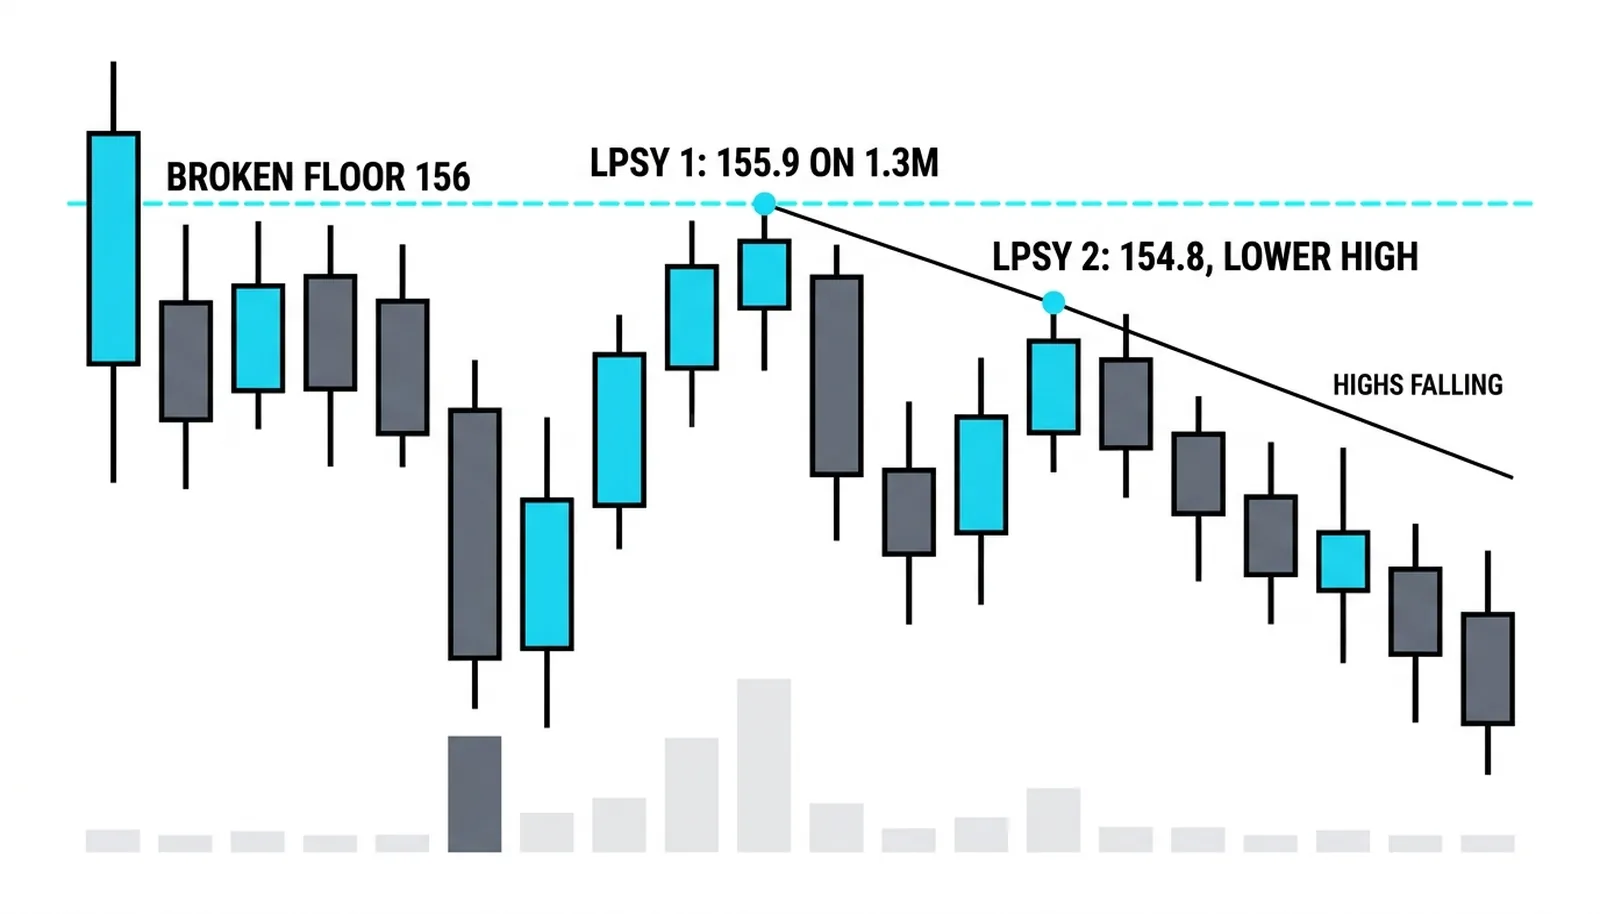
After the break, price almost always tries to rally. That rally is the last point of supply, the LPSY, and it has its own anatomy: it travels on clearly lighter volume than the breakdown bar, and it stalls under the broken floor or prints a lower high beneath the range.
Who is selling into it? The professionals who still hold inventory. The SOW told them the public bid below the floor is gone, so they take the last exit the market offers, the hopeful bounce. Buyers stepping in think they are getting a discount off the old range. Sellers know they are handing over stock that is about to be marked down.
The failing rally beats chasing the breakdown bar for one practical reason: location. Shorting the SOW itself means entering after a wide bar, far from any reference point, with a stop that must sit far away. The LPSY gives a defined level, the broken floor or the rally high, sitting close overhead. Risk shrinks because the level that proves the idea wrong is near.
Watch the volume contrast. Breakdown near triple the average, rally back under it. That asymmetry is the message: sellers act with conviction, buyers respond with hope.
Phase D in Practice
Phase D rarely delivers one clean event. It delivers a rhythm: sign of weakness, weak rally, another push down, another weaker rally. Each rally high prints lower than the one before it. Those descending highs are the map of the retreat, the rearguard giving ground stand by stand.
Read each rally the same way. Does it reach the broken floor? Does volume expand on it or shrink? A rally that cannot even touch the floor it lost is the weakest kind. A rally that reaches the floor on thin volume and dies there is the textbook LPSY.
Two honesty points belong here.
First, a sign of weakness can print earlier than phase D in a sloppier top. Any heavy down bar that takes out a swing low after a long advance is a warning, even mid-range. What makes it a phase D event is the campaign context around it: the climax, the tests, the upthrust already on the chart. Without that context, treat the bar as a caution flag, not a short signal.
Second, the failed break is real. If price closes back above the broken floor on heavy volume and follows through, the bears were baited. The breakdown absorbed supply instead of releasing it, and the range needs rebuilding. The honest read is to step aside. Arguing with a reclaimed floor is how breakdown traders donate their accounts.
The Exit Ladder
The breakdown trader gets three rungs, each priced in risk.
- Rung one, the breakdown entry. Short as the SOW undercuts the floor, or on its close. The stop sits back above the range, often above the last minor high inside it. This is the widest stop of the three, because the bar is wide. What proves it wrong: any close back above the floor.
- Rung two, the LPSY entry. Short the first failing rally as it stalls under the broken floor, with the stop just above that rally high. The stop can be tight because the level that failed is close by. What proves it wrong: the rally exceeding its own high with volume behind it.
- Rung three, the confirmation entry. Short the second, lower rally high, the one that cannot even reach the floor. Stop above that high. By now the lower-highs sequence is established, so this entry trades confirmation against a later price. What proves it wrong: a rally that takes out the prior rally high.
Each rung costs less risk and offers less price. That trade-off never disappears; it only moves.
One Break, Two Failing Rallies
All numbers here are invented for illustration.
A stock runs from 120 to 166. The buying climax prints a 168.6 high on 6.2 million shares against a 1.5 million average. For two months the range holds between 156 and 168. The upthrust after distribution pokes 169.1 on 2.8 million and closes at 164.0, back inside. The stage is set.
The sign of weakness opens at 162.0, spreads down to a 153.4 low, and closes at 154.2 on 4.4 million shares, nearly triple the average. The 156 floor is gone. The first last point of supply rallies to 155.9 on 1.3 million and stalls under the broken floor. The second reaches only 154.8 on 1.0 million, a lower high.
| Event | Price | Volume | The Read |
|---|---|---|---|
| Sign of weakness breaks 156 floor | Close 154.2 | 4.4M | Supply public; floor defended for two months is gone |
| First LPSY stalls under floor | 155.9 | 1.3M | Thin rally into broken support; sellers unloading final inventory |
| Second LPSY, lower high | 154.8 | 1.0M | Rearguard gives ground; buyers cannot even reach the floor |
| Markdown under way | Toward 143.6 | Expanding on drops | Range height of 12.0 projected down from 155.6 area |
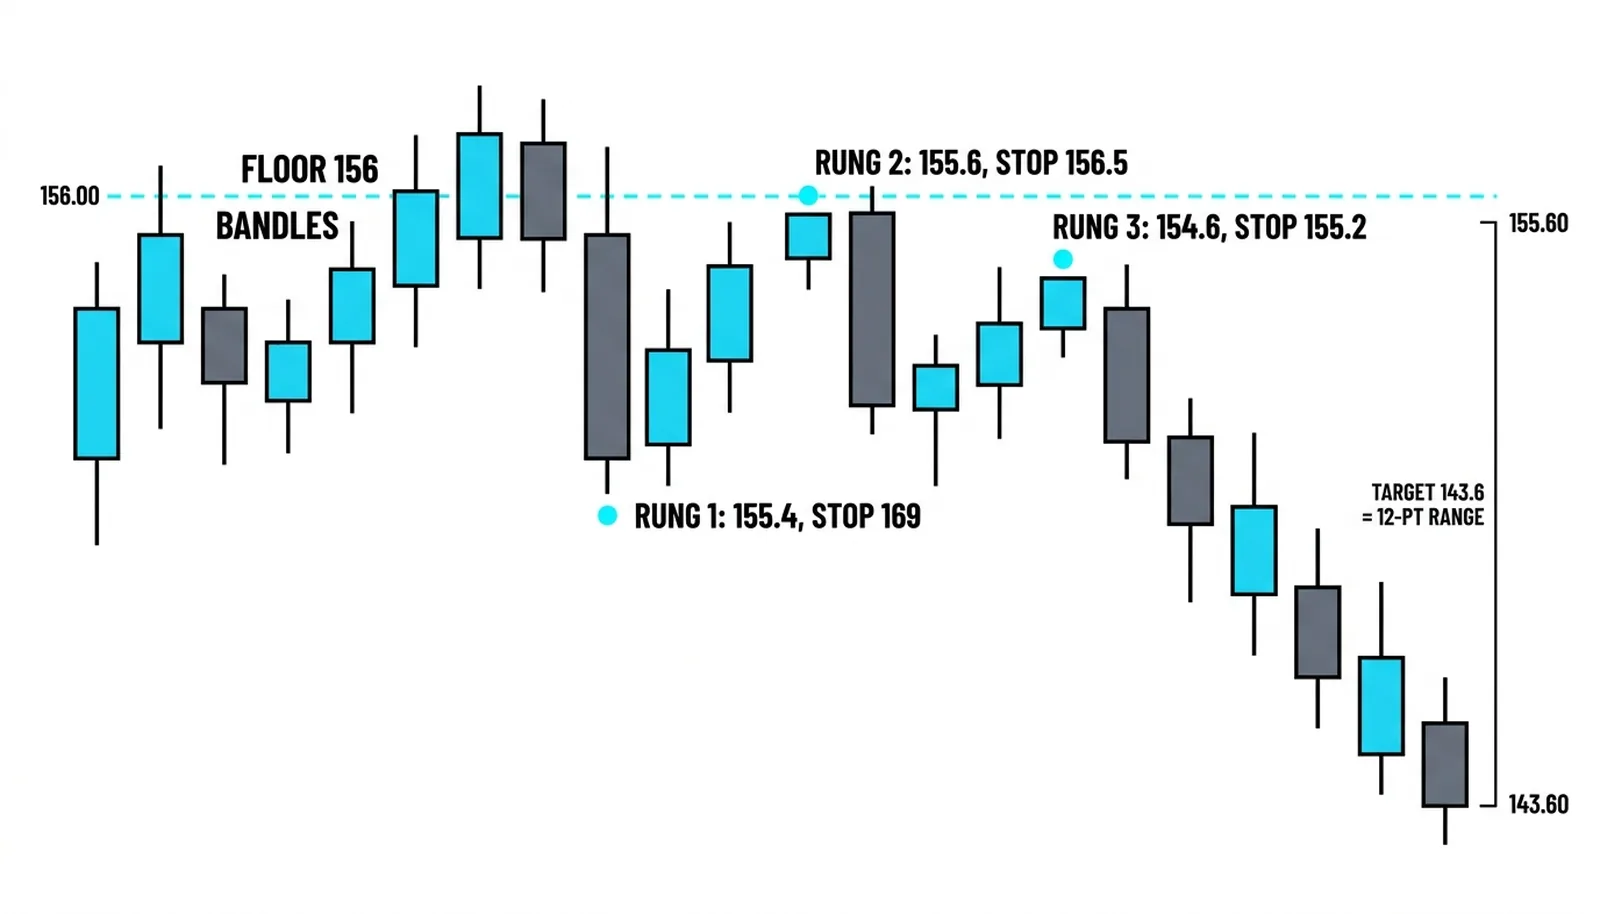
Pricing the ladder. Rung one: short at 155.4 as the floor gives way, stop above the range at 169.0, risk of 13.6 points. Rung two: short the first failing rally at 155.6, stop above 156.5, risk of 0.9 points. Rung three: short the second rally at 154.6, stop above 155.2, risk of 0.6 points.
The range height is 12.0 points. Projected from the 155.6 breakdown area, the target sits at 143.6, filled within four weeks in this illustration.
The cancellation read at every step: a close back above 156 on heavy volume kills rung one; the first rally exceeding 155.9 with expanding volume kills rung two; any rally clearing the prior rally high kills rung three. The trade lives only while the floor stays lost and the highs keep falling.
Sign of Weakness and LPSY, Answered
What is a sign of weakness in Wyckoff analysis?
A sign of weakness is the wide-spread, heavy-volume down bar that breaks a distribution range's floor and closes in the lower part of its range. It marks the moment supply stops being rationed quietly and gets dumped in the open, and it defines the start of phase D, the confirmation phase of a top.
What does LPSY mean in trading?
LPSY stands for last point of supply, the feeble rally that follows a sign of weakness. It travels on lighter volume, stalls under the broken floor or prints a lower high, and gives the remaining professional sellers their final exit while offering breakdown traders a low-risk short entry.
Where should the stop go on a breakdown trade?
The stop goes just above the level that failed: above the range for a breakdown entry, or above the failing rally high for an LPSY entry. The LPSY stop can be tight precisely because the rally high sits close by, which is the main reason experienced traders prefer the rally over chasing the break.
What does it mean when price reclaims the broken support?
A heavy-volume close back above the broken floor, with follow-through, means the breakdown failed and the bears were trapped. The range needs rebuilding, and the correct response is to exit and stand aside rather than defend a short the market has already rejected.
Next in the Wyckoff block: the nine buying and selling tests, the checklist the classic accumulation and distribution framework uses to judge whether a campaign has truly finished, before the method gets applied across multiple timeframes.