PS, SC, AR, ST: The Wyckoff Event Sequence
The Wyckoff event sequence is the ordered set of checkpoints that opens an accumulation range: preliminary support, the selling climax, the automatic rally, and the secondary test. Together they answer one question four times: has the selling actually ended?

A decline stops in stages, never on a single line. Price does not ring a bell at the bottom and reverse. It hesitates, panics, bounces, and then quietly checks whether anyone is still left to sell. The classic accumulation and distribution framework mapped that choreography more than a century ago, and the map still holds because crowds still behave the same way at exhaustion.
Think of the end of an argument in a meeting: one final shout, the pause right after it, and the quieter replies that tell everyone it is really over. Each of the four events below is one of those beats, and each carries its own shape, volume signature, and proof.
The preceding lessons covered the full accumulation schematic and the composite man who acts inside it. This lesson zooms into phase A alone and names its four events in order.
Preliminary Support: The First Yes
Preliminary support is the first sign that a decline is being met. Down bars keep printing on heavy volume, but they stop making progress. Each push lower travels less distance than the one before, even though the turnover stays high.
That mismatch is the signal. Heavy volume with shrinking downward progress means someone is absorbing the supply. Sellers are still hitting the market hard, and a buyer with deep pockets is standing there taking it all without letting price fall much further.
Call it the first yes, but a tentative one. Absorption at preliminary support proves only that a large buyer exists at those prices. It does not prove the selling is finished. More supply can arrive tomorrow, and the tentative buyer can step away. Traders who buy aggressively at preliminary support are front-running evidence that has not yet appeared.
The honest read is narrow: note the level, note the absorption, and wait. The next event usually arrives on its own.
The Selling Climax: Panic Spent
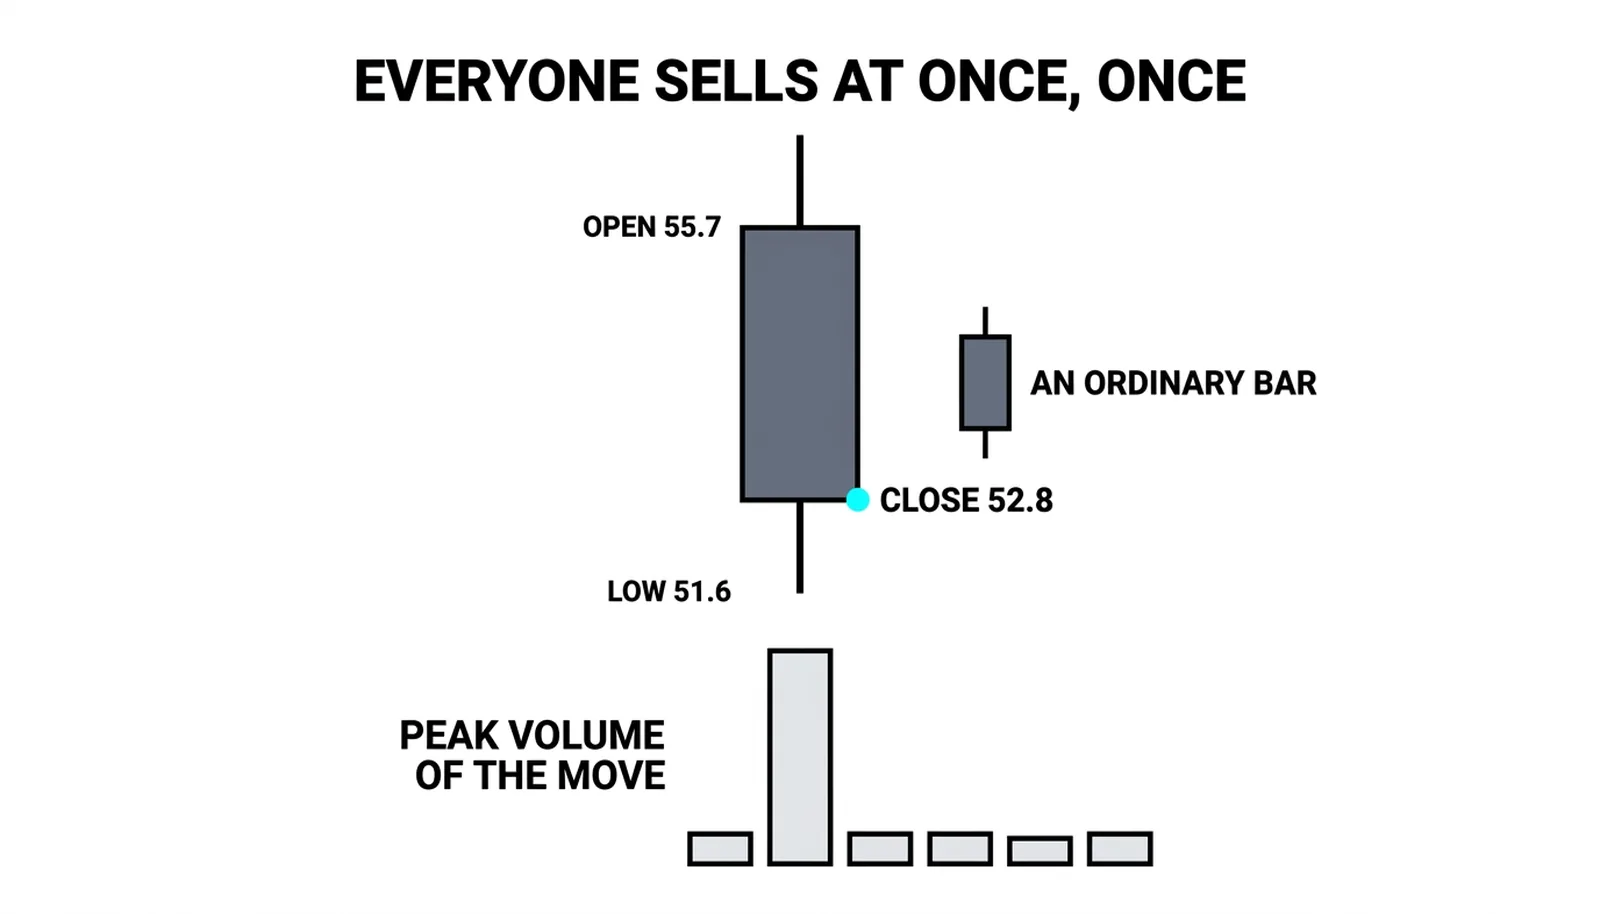
The selling climax is the panic flush. It prints as a wide-spread bar, often the widest of the entire decline, on record or near-record volume, and it closes well off its low. That close matters as much as the volume. A bar that collapses and then recovers into the close shows that buyers overwhelmed the panic before the session ended.
It takes a crowd to print one. A climax requires thousands of independent holders capitulating at once: stop-losses triggering, margin calls forcing liquidation, late shorts pressing, frightened longs dumping at any price. That is why the volume dwarfs everything around it. No single actor manufactures that signature convincingly.
The climax is where public emotion transfers inventory to professional hands. The crowd sells because it cannot bear more pain. The composite operator buys because the pain has made the merchandise cheap.
One naming trap deserves a blunt warning. Some volume-price authors, volume price analysis among them, use selling climax and buying climax in the reverse sense. Standard Wyckoff usage puts the selling climax at the bottom of a decline, where the crowd sells in panic, and the buying climax at the top, where the crowd buys in euphoria. The mechanics are identical either way; only the labels flip. When crossing between books, check the convention before the terminology confuses the analysis.
A climax bar that closes on its low is not a climax. It is just a bad day, and more downside usually follows.
The Automatic Rally: Setting the Ceiling
The automatic rally is the snapback off the climax low. Price rebounds sharply, sometimes violently, over one to several sessions. The classic accumulation and distribution framework named it automatic because the rally needs no fresh buying conviction to happen. Once the panic sellers are spent, even modest demand meets an empty offer. Short covering adds fuel. Price rises because nobody is left to push it down, and that vacuum does the work.
This distinction matters for reading intent. A rally driven by an absence of sellers is weaker evidence than a rally driven by aggressive new buying. The automatic rally proves the immediate supply is exhausted. It proves nothing yet about durable demand.
The high of the automatic rally becomes the first ceiling of the new range. From that point forward, the market has two coordinates: the climax low below and the rally high above. Everything that follows in the accumulation plays out between them.
Treat that ceiling as provisional. Price will test it, respect it, and occasionally poke through it before the range matures. But as a working boundary, it is the best information available at that moment.
The Secondary Test: Measuring the Sellers
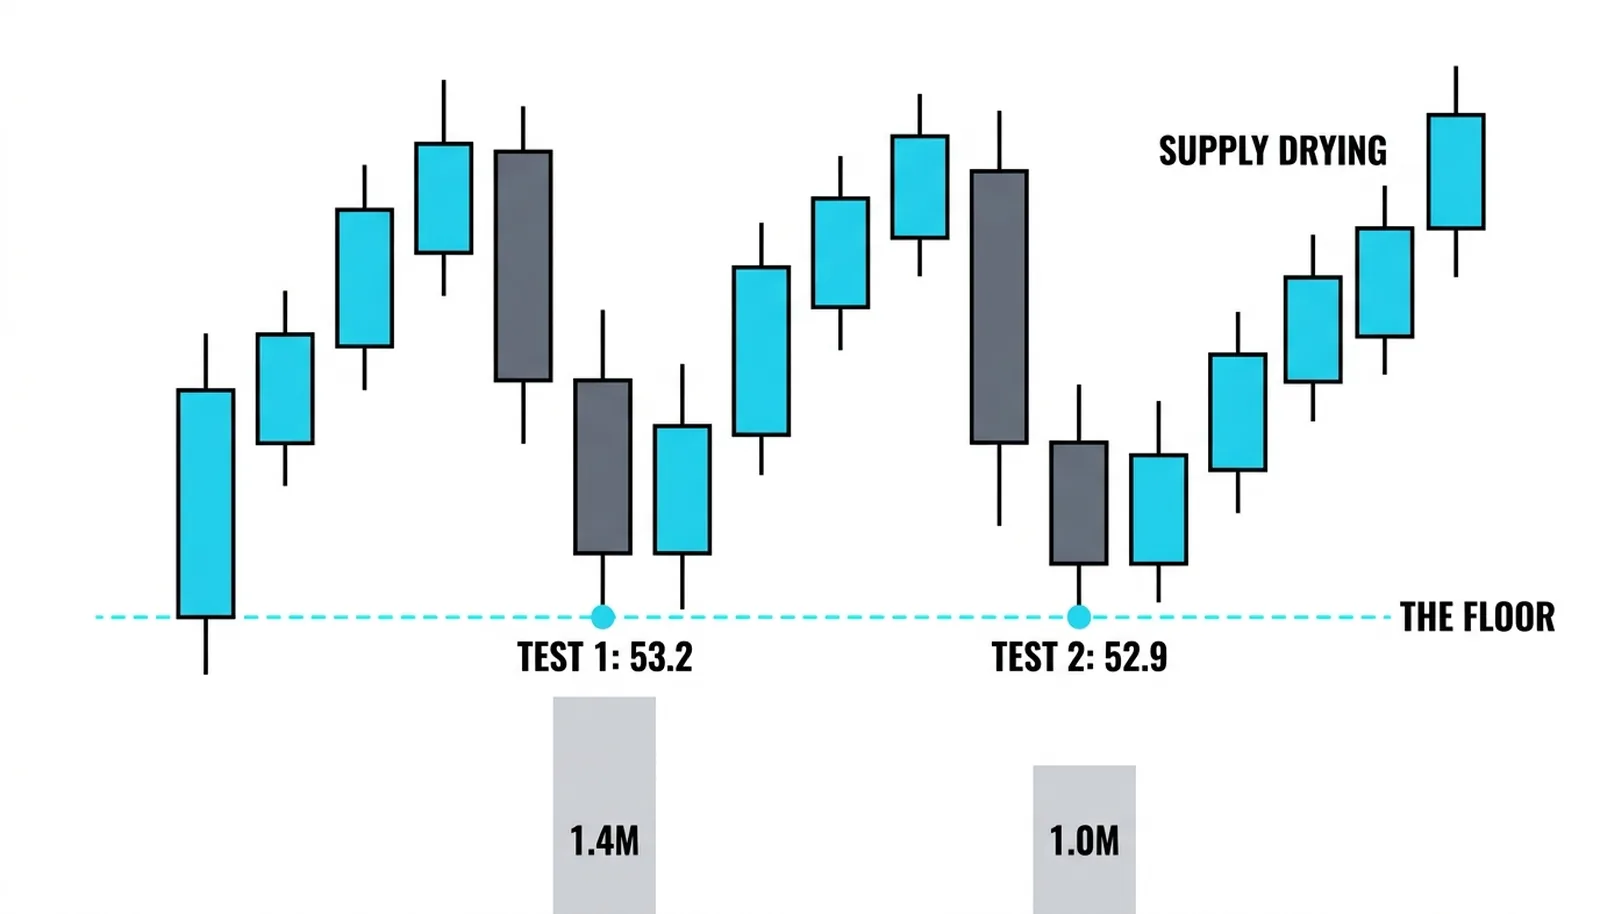
The secondary test is the quiet return toward the climax low. After the automatic rally fades, price drifts or declines back toward the area where the panic bottomed. The defining feature is volume: the test arrives on clearly lower turnover than the climax itself.
Lower volume on the retest is the entire message. If sellers still had ammunition, the return to the lows would bring them out in force. A quiet drift downward means the supply is gone. The sellers who would sell at those prices already sold at the climax.
A test that holds, ideally at or above the climax low, confirms the bottom. The confirmation strengthens if the spread of the down bars narrows and the closes firm up. That combination says the path of least resistance has turned.
A failed test carries its own information. If price breaks the climax low on heavy volume, the absorption failed and the decline has more work to do. If price breaks the low on light volume and recovers, the base needs more time. Either way, the campaign is delayed, and the disciplined response is to step back rather than average into a structure that has not proven itself.
Reading the Four Together
Each event asks the same question from a different angle: is the supply gone? Preliminary support asks whether anyone is absorbing. The selling climax asks whether the crowd has capitulated. The automatic rally asks whether the sellers have actually vanished. The secondary test asks whether they stay gone when given a second chance.
The sequence works as an admission interview for a new range. Each checkpoint passes or fails on its own evidence, and the accumulation only earns trust when all four have answered. Skipping ahead, buying the climax low and assuming the rest, is a guess dressed as a method.
One honesty note before the example. Real ranges skip events, repeat events, or shuffle the order. Sometimes two climaxes print before the rally. Sometimes the secondary test arrives twice. The sequence describes how bottoms tend to unfold; it is not a form to fill in. When the chart deviates, follow the chart.
What matters is the logic underneath each event, not the tidiness of the pattern.
One Bottom, Four Checkpoints
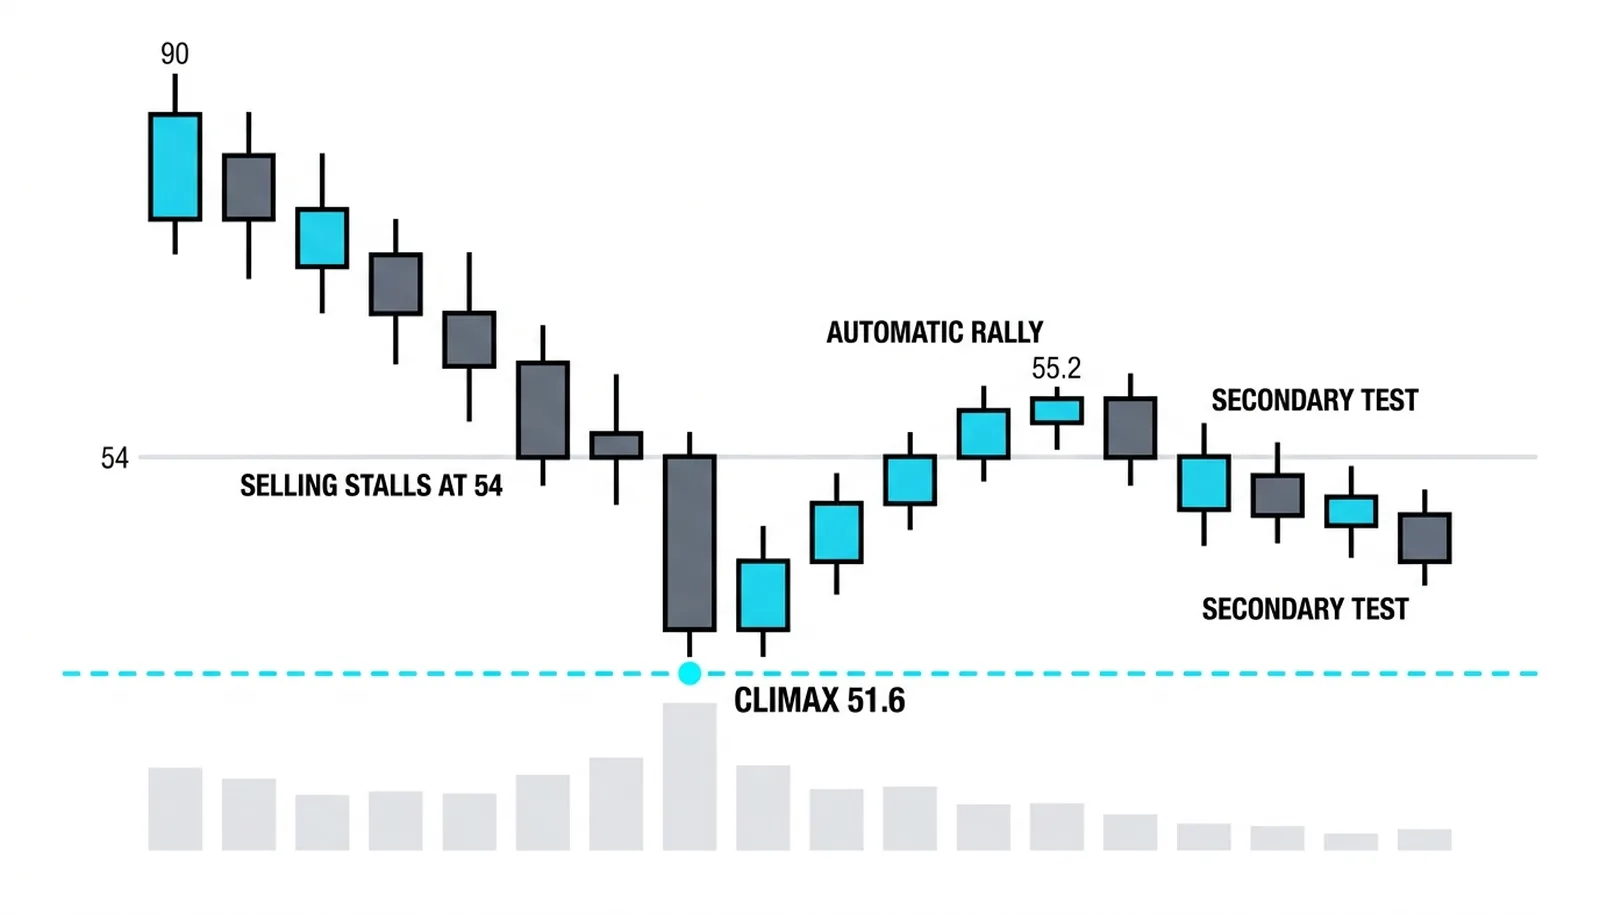
Suppose a stock falls from 90 to 52 over two months, on rising volume. These numbers are invented and round, purely for illustration.
At 54, two down bars print 3.1 million and 2.8 million shares against a 1.2 million average, yet price stops falling. That is preliminary support: heavy effort, no result. The read is that absorption has begun. What would invalidate it is a resumption of the decline on expanding volume, which would mean the absorber stepped away.
Days later the selling climax prints: 4.6 million shares, a 2.9-point spread, a touch of 51.6, and a close at 52.8. The recovery off the low confirms buyers took control before the close. A close near 51.6 instead would have invalidated the climax reading entirely.
The automatic rally carries price to 56.4 in two sessions on 1.9 million shares. The vacuum rally confirms the immediate supply is spent, and 56.4 becomes the working ceiling. A rally that failed almost immediately and broke back under 52 on heavy volume would have cancelled it.
Eleven sessions later, the secondary test drifts down and holds at 52.9 on only 1.0 million shares. Volume has shrunk to a fraction of the climax, and the low holds above it. The sellers are gone. The range, roughly 52 to 57, is born, and the accumulation has passed its first interview. A break of 51.6 on heavy volume would have sent the whole structure back to the drawing board.
| Event | Price and Volume Signature | What It Proves | What Would Invalidate It |
|---|---|---|---|
| Preliminary Support | Down bars on 3.1M and 2.8M shares vs 1.2M average, price stalls near 54 | Large-scale absorption has begun | Decline resumes on expanding volume |
| Selling Climax | 4.6M shares, 2.9 spread, touches 51.6, closes 52.8 | Panic supply exhausted, buyers took the close | Close near the low, or new lows on heavy volume after |
| Automatic Rally | Rally to 56.4 in two sessions on 1.9M shares | Immediate supply gone; sets range ceiling | Rally collapses and price breaks the climax low on volume |
| Secondary Test | Holds 52.9 on 1.0M shares, well under climax volume | Sellers confirmed absent; range validated | Break of 51.6 on heavy volume |
The Wyckoff Event Sequence, Answered
What are the events in a Wyckoff accumulation?
Phase A of a Wyckoff accumulation contains four events in order: preliminary support, the selling climax, the automatic rally, and the secondary test. Each one tests whether the selling pressure has truly ended, and together they establish the boundaries of the trading range that follows.
What is a selling climax in trading?
A selling climax is a wide-spread down bar on record or near-record volume that closes well off its low, marking the moment crowd panic exhausts itself. It signals that public sellers have capitulated and that larger buyers have absorbed their supply, though it needs the later checkpoints to confirm the bottom.
Why is the automatic rally called automatic?
The rally is called automatic because it requires no new buying conviction to occur. Once the climax spends the available supply, even modest demand meets an empty offer, and short covering adds lift, so price rises mechanically from the absence of sellers rather than from fresh enthusiasm.
What does a secondary test confirm?
A secondary test confirms that the sellers who drove the decline are genuinely gone. When price returns toward the climax low on clearly lower volume and holds, it shows no supply remains at those prices. A failed test on heavy volume means the decline has further to run.
With phase A mapped, the next lessons move deeper into the range: the spring, where price breaks the lows one final time to trap the last sellers, and the sign of strength with its last points of support, where the accumulation tips its hand before the markup begins.