The Four Market Phases of the Cycle
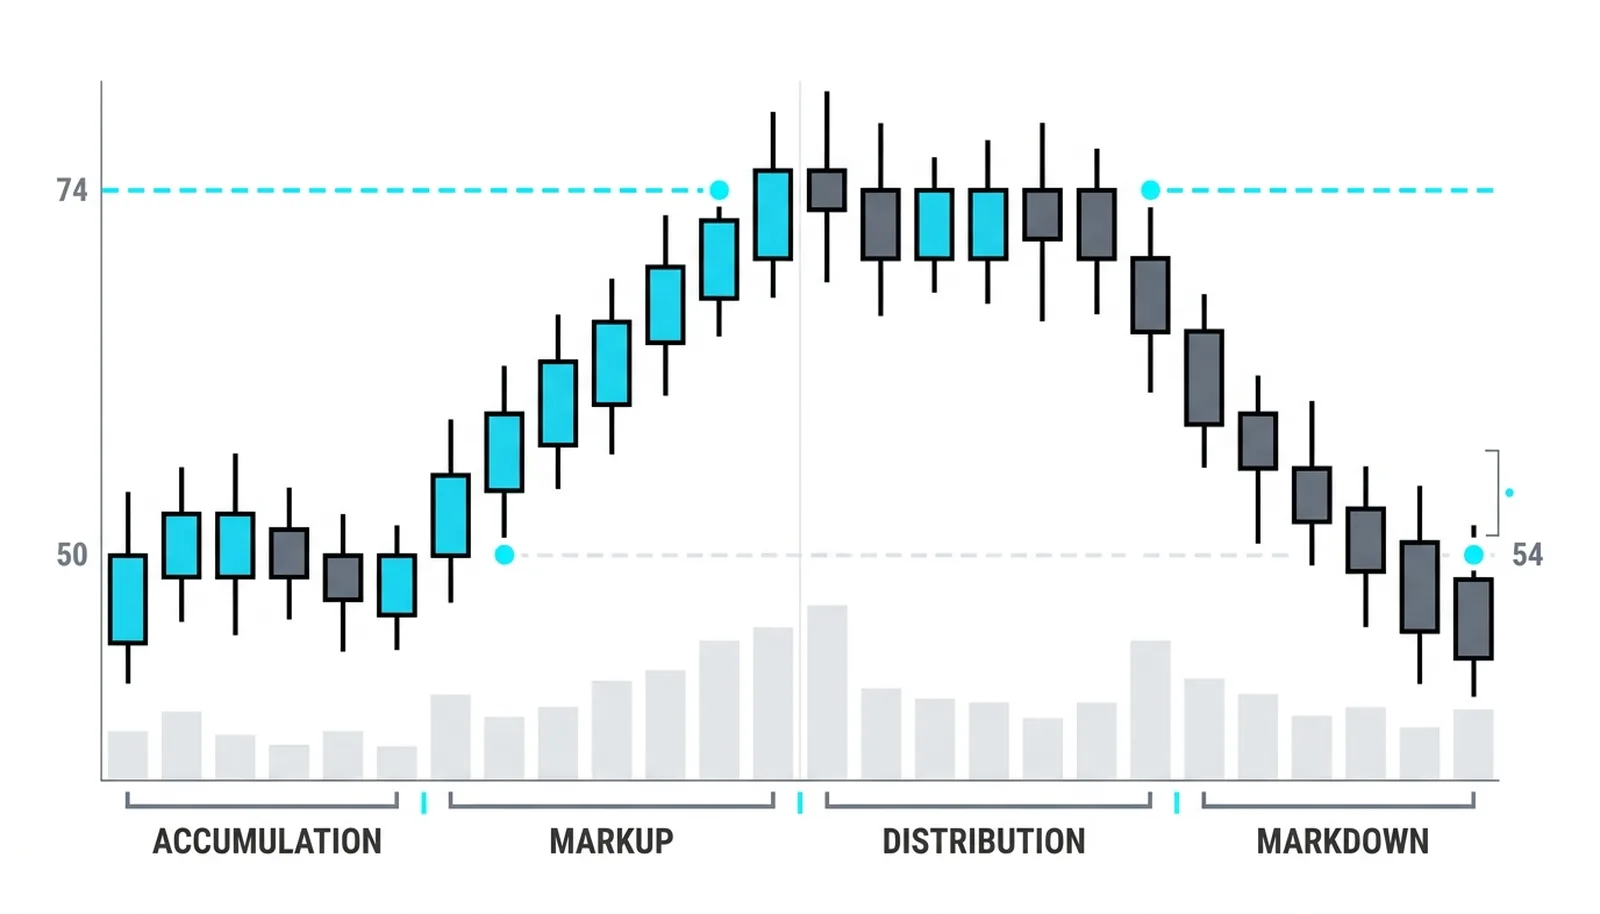
The four market phases are accumulation, markup, distribution, and markdown, and they describe the full cycle a market moves through as professional money builds a position quietly, drives price to where it is going, hands that position to the crowd at the top, and steps aside while the crowd rides it back down. Once you can name the phase you are sitting in, half of the confusion on a chart disappears.

The wheel turns in the same order every time, though never on the same timetable. A decline ends, price goes sideways, price rises, price goes sideways again, price falls. Traders who fight this sequence buy breakouts at the top of distribution and sell panic lows at the bottom of markdown. Traders who respect it wait for their phase and ignore the rest.
Think of it as one night in a nightclub: the doors open and a few people drift in, the floor fills and the energy peaks, last call comes and the mood shifts, and then everyone goes home. The room is the same room all night. What changes is who is in it and what they are doing.
The previous lesson introduced the composite man, the single actor whose behavior stands in for all professional money. This lesson is that actor's schedule. Every phase below describes the operator's activity and what it does to price and volume.
Keep the location principle from earlier in this level in the back of your mind as you read. The four phases are the master background that gives every individual bar and volume reading its meaning.
Accumulation: Building the Position
Accumulation is the range that forms after a decline has run its course. Price stops falling and starts moving sideways, often for weeks or months. To most eyes, nothing is happening.
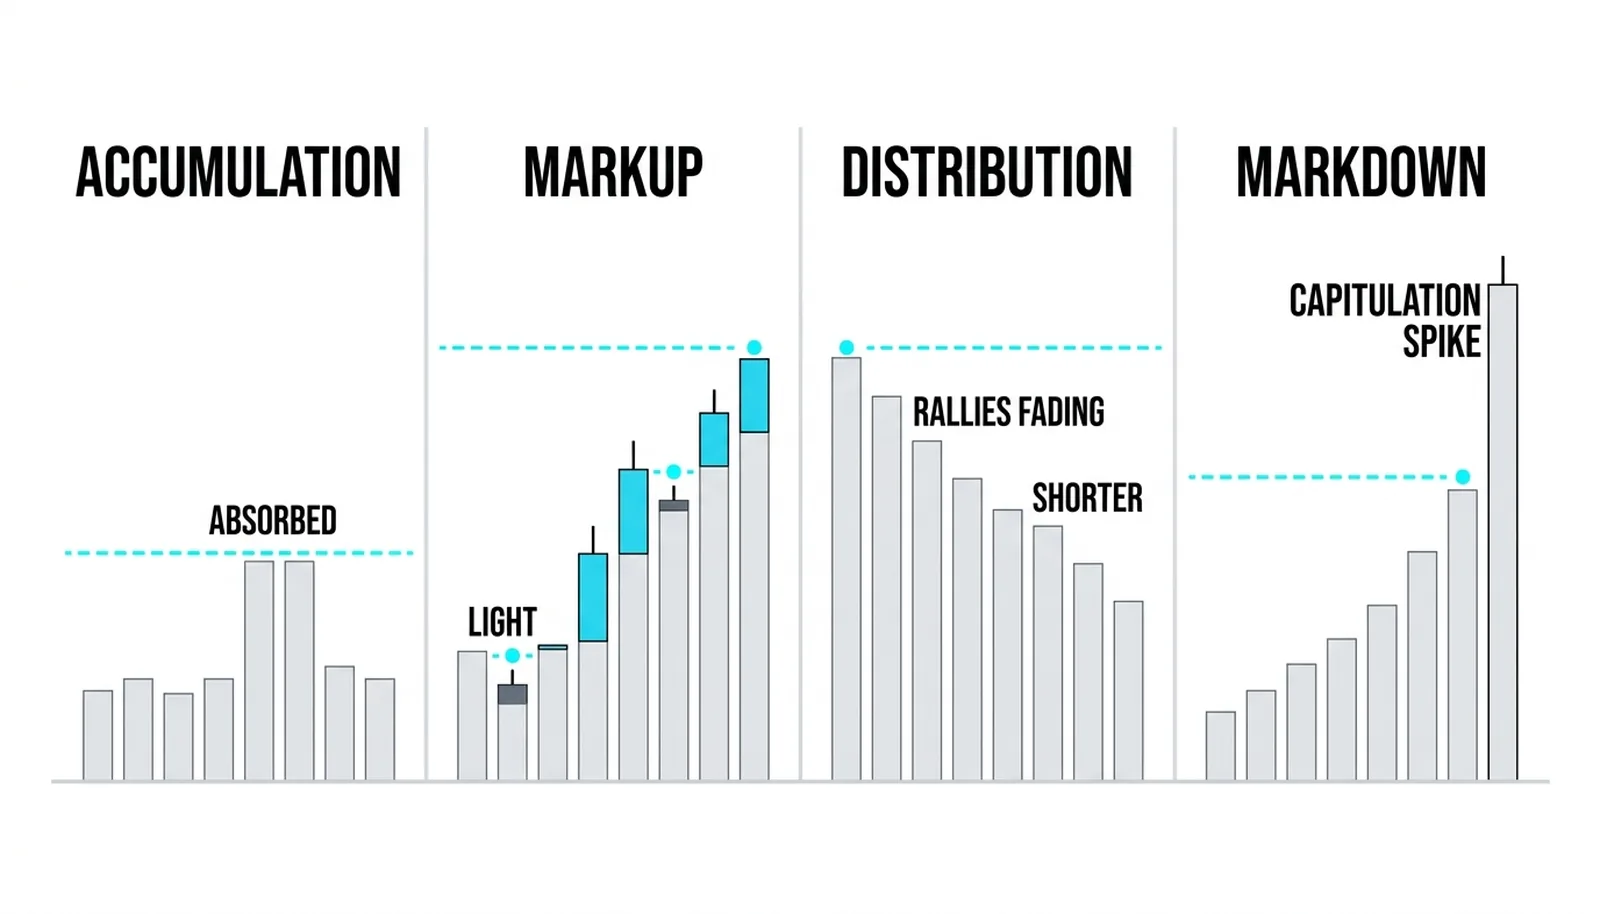
Something is happening. Effort is going in and price is going nowhere, and that mismatch is the signal. Heavy selling waves hit the bottom of the range and fail to push price lower. Down bars print large volume and close well off their lows. The selling is real, but it is being absorbed.
The crowd's mood here is boredom mixed with disgust. Anyone who held through the decline has given up. Anyone watching from outside sees a dead chart and looks elsewhere. That indifference is exactly the condition the operator needs, because a large position cannot be bought quickly without driving price up against the buyer.
So the operator buys patiently, inside the range, on the weak days. The volume texture is quiet two-way chop: unremarkable on the surface, with the tell that heavy down bars stop making downward progress. Each failed push lower is a small piece of evidence that supply is drying up.
The phase ends when the range has absorbed all the selling it is going to get. Price lifts out of the top of the structure, and the character of the chart changes.
Markup: The Effect Delivered
Markup is the trend. The position built quietly at the bottom now pays, because the cause was assembled during accumulation and the effect arrives as a sustained advance — the second law running on schedule.
Participation expands. Volume on up legs runs heavier than anything seen inside the range, and each new high draws fresh attention. The crowd, which ignored the stock for months, starts to notice.
The diagnostic detail is the pullbacks. In a healthy markup, reactions are shallow and hold on light volume. Each pullback stalls above the prior one and forms a shelf, a small platform where price rests before continuing. Light volume on a dip means holders are not selling; they are waiting.
Now the crowd starts buying in earnest. Ask the question that matters: from whom are they buying? Someone who already owns a large position is selling small pieces into that rising demand, letting the trend do the distribution work early. The markup is where the operator's campaign is most visible, and also where the crowd feels smartest.
The phase ends when price stops making easy highs. Up moves shorten, the shelves stop holding cleanly, and the chart flattens at altitude.
Distribution: Handing Over the Position
Distribution is the range at the top, and structurally it is accumulation's mirror. Price goes sideways again. Effort goes in and price goes nowhere again. The texture is the same quiet two-way chop.
The mood is reversed. At the bottom, the crowd was bored and selling out. At the top, the crowd is euphoric and buying everything. News is good, targets are higher, and nobody wants to hear about risk.
The operator's problem is also reversed. A large position cannot be sold quickly without breaking the price, so it must be fed to buyers gradually, into strength, inside the range. Every eager buy order at the top of the structure is liquidity for the seller.
The volume tell is on the rallies. Up moves inside the range start fading on lighter and lighter volume. The demand that powered the markup is thinning, even as the crowd feels most confident. Meanwhile, down moves toward the bottom of the range carry more weight than they should.
Rallies that cannot attract volume are rallies running on leftover enthusiasm. When the last of the position has been handed over, there is no one left with an interest in holding the price up, and the range resolves downward.
Markdown: Standing Aside
Markdown is the downtrend, and its defining feature is absence. The operator neither buys nor supports. With no large bidder underneath, prices fall easily, often faster than they rose.
Volume expands on the down legs. Rallies are weak, brief, and sold. The crowd that bought the top now holds losing positions, and their behavior follows a grim script: hope, denial, and finally surrender.
That surrender is capitulation, the final flush where volume spikes to its highest reading of the whole cycle and price makes its last lunge down. Everyone who can be shaken out is shaken out, all at once.
The crowd sells at the bottom to the same hands that bought below it.
Capitulation resets the wheel. Once the forced selling is exhausted, price stops falling, a range begins to form, and the chart is back at accumulation. The cycle does not announce the handover. You have to read the texture.
One Stock, One Lap
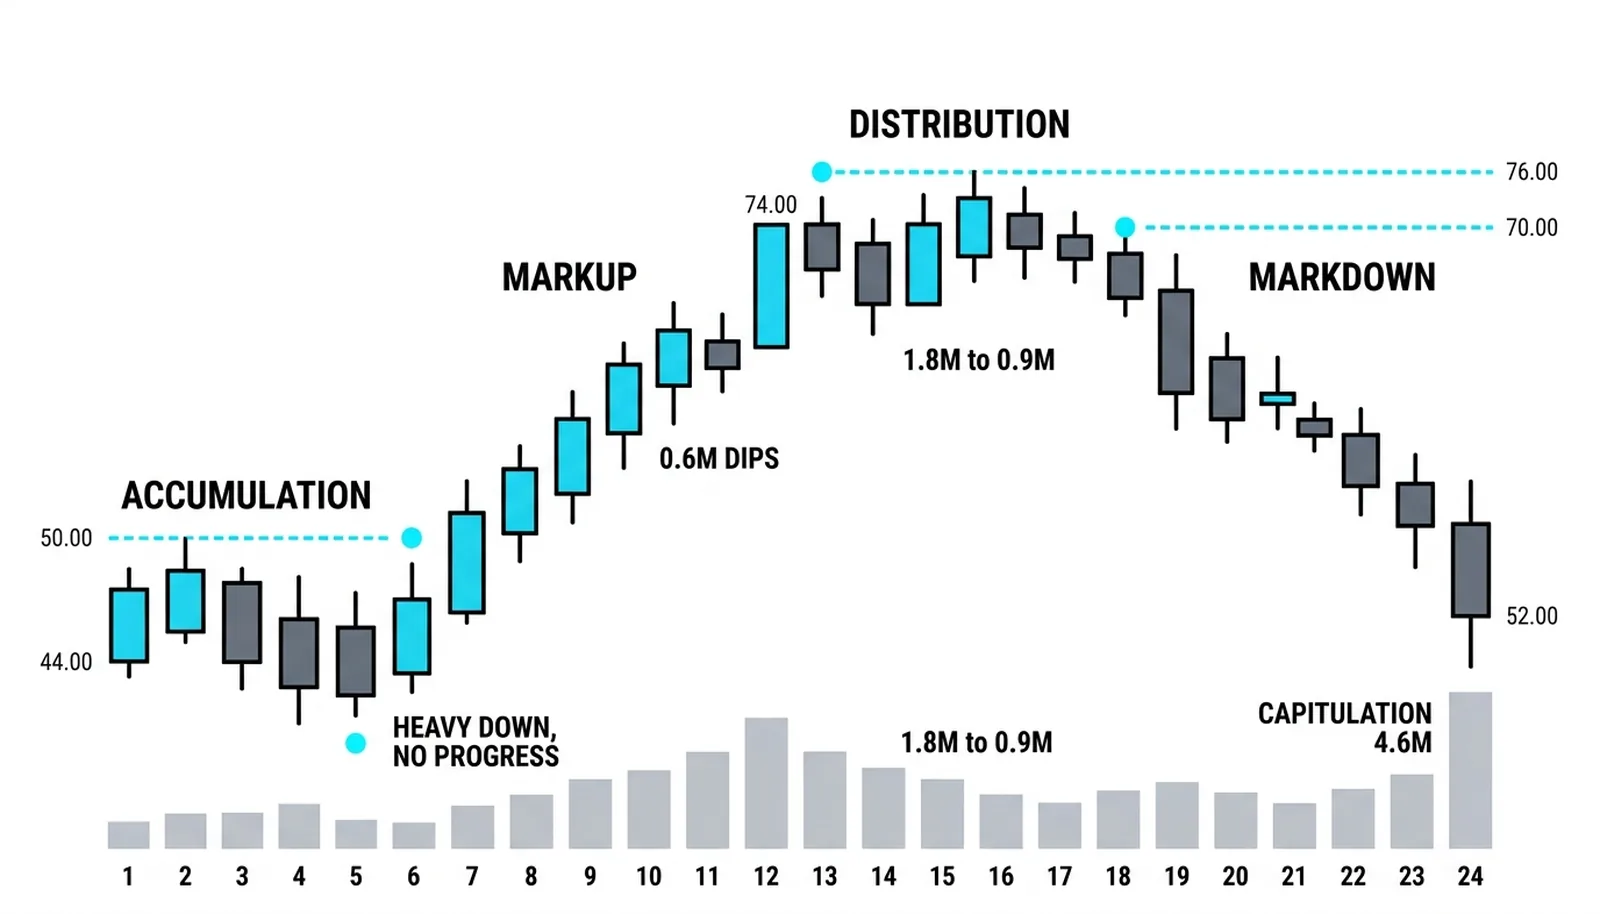
The numbers below are invented round figures, purely illustrative, showing one full lap of the wheel in a single hypothetical stock.
Accumulation. After a long decline, the stock ranges between 44 and 50 for three months. Volume runs between 0.8 and 1.4 million shares a day. Twice, heavy down days print near the top of that volume band, and both times price closes back above 46. Effort in, no progress down. The read: selling is being absorbed inside a range. This is accumulation until proven otherwise.
Markup. Price leaves the range and climbs to 74 over six weeks. Volume rises on the advance, and each pullback prints only about 0.6 million shares before the next leg begins. Pullbacks holding on a fraction of the trend's volume means holders are not selling. The read: a healthy trend; trail it, do not fade it.
Distribution. The stock ranges between 70 and 76 for a month. The crowd is excited. But rally volume shrinks from 1.8 million shares on the first push toward 76 to 0.9 million on the last. Demand is fading at the highs. The read: the same goes-nowhere texture as the old 44-to-50 range, with the mood reversed. Treat strength near 76 as suspect.
Markdown. Price breaks 70 and falls to 52. Down days carry expanding volume, and the final flush prints 4.6 million shares, the biggest day of the whole cycle. That capitulation spike, after an extended fall, marks the exhaustion of selling. The read: the wheel has completed its lap, and the next question is whether a new range is forming.
| Phase | Price texture | Volume texture | The crowd's mood |
|---|---|---|---|
| Accumulation | Sideways range after a decline; down pushes fail | Quiet chop; heavy down bars make no progress | Bored, disgusted, selling out |
| Markup | Rising trend with shallow pullbacks holding as shelves | Expanding on advances; light on pullbacks | Growing interest, then confident buying |
| Distribution | Sideways range at the top; rallies stall | Quiet chop; rallies fade on shrinking volume | Euphoric, buying every dip in the range |
| Markdown | Falling trend with weak, brief rallies | Expanding on declines; capitulation spike at the end | Hope, denial, then surrender |
The Four Market Phases, Answered
What are the four market phases?
They are accumulation, markup, distribution, and markdown: the repeating sequence of a sideways base after a decline, a rising trend, a sideways top, and a falling trend. The sequence describes what professional money is doing at each stage, from building a position to unloading it to standing aside.
How long does each market phase last?
There is no fixed timetable. A phase can last weeks or many months, and the two range phases are usually the longest because large positions take time to build and to unwind. Judge phases by their price and volume texture, never by time elapsed.
How do I know which phase the market is in?
Read the texture, not the mood. Sideways price with heavy down bars failing to push lower marks accumulation; rising price with light-volume pullbacks marks markup; sideways price at highs with rallies fading on shrinking volume marks distribution; falling price with expanding volume marks markdown. When the texture is mixed, the honest answer is that the phase is unclear, and standing aside is a position.
Do the phases always repeat in order?
The full sequence, when it completes, runs in that order, but the wheel can stall or skip. A markup can fail and drop straight back into a longer accumulation, and a markdown can pause in a range that turns out to be continuation rather than a base. Treat the four phases as a map of behavior, not a guaranteed schedule.
With the cycle mapped, the next lesson zooms into the first phase in detail: the Wyckoff accumulation schematic, where the events inside the range get names, labels, and a sequence of their own.