Volume: The Most Honest Market Data
Volume is the count of shares or contracts that actually changed hands during a period, and that simple fact makes it the most honest data on your screen. Price can close anywhere the last two trades agree to meet. Volume just counts. It does not smooth, it does not average, and it does not care what anyone expected the price to do.

Think of it this way: the scoreboard does not care what the commentators said. Every bar on your chart carries two records, the price where trades printed and the number of trades behind it. Price is the headline. Volume is the attendance. This lesson is about why traders treat that attendance figure as the closest thing to ground truth a chart offers.
An earlier lesson, what volume is and why it matters, covered the definition, so we will not re-cover that ground here. What follows is the case for trusting it, and the honest limits on that trust.
Why Traders Trust the Count
Volume is measured, not derived. That single distinction separates it from almost everything else on your chart.
Every indicator you studied in Level 8 is arithmetic performed on price. A moving average averages past closes. RSI compares recent gains to recent losses. MACD subtracts one average from another. Each one carries a lookback period, a smoothing choice, and settings you can tune until the chart tells you what you want to hear. Change the inputs and the signal changes.
Volume has no inputs. There is no 14-period volume, no fast and slow volume, no parameter to optimize. The exchange counts what traded and reports the number. You can display it differently, but you cannot change what it is.
There is a deeper reason too. Every share in that count represents a real decision by a real participant. Someone committed capital. Someone else took the other side. A price tick can happen on a single small trade at the edge of the book, but a large volume figure means a crowd showed up and put money to work. Volume is a record of behavior, and behavior is harder to fake than a quote.
So your chart carries two independent streams of information. Price tells you where trades cleared. Volume tells you how much conviction stood behind those clears. When the two streams agree, you have something solid. When they disagree, the disagreement itself is information. The rest of this lesson works the second stream on its own terms, and the four indicator categories treat it as a family of its own for exactly that reason.
What the Count Says About a Move
Participation grades conviction. That is the core reading skill.
A price move on expanding volume is a move people paid to join. New money flowed in behind the direction, which means the move has sponsors. The same price move on shrinking volume is a move fewer and fewer people back. Price traveled, but the crowd stayed home.
Big moves need believers.
This is why two identical-looking breakouts can mean opposite things. The candlestick shows you the destination. The volume bar shows you how many traders funded the trip. A breakout that triples normal participation carries a different weight than one that drifts through resistance on a quiet afternoon, even if both close at the same price.
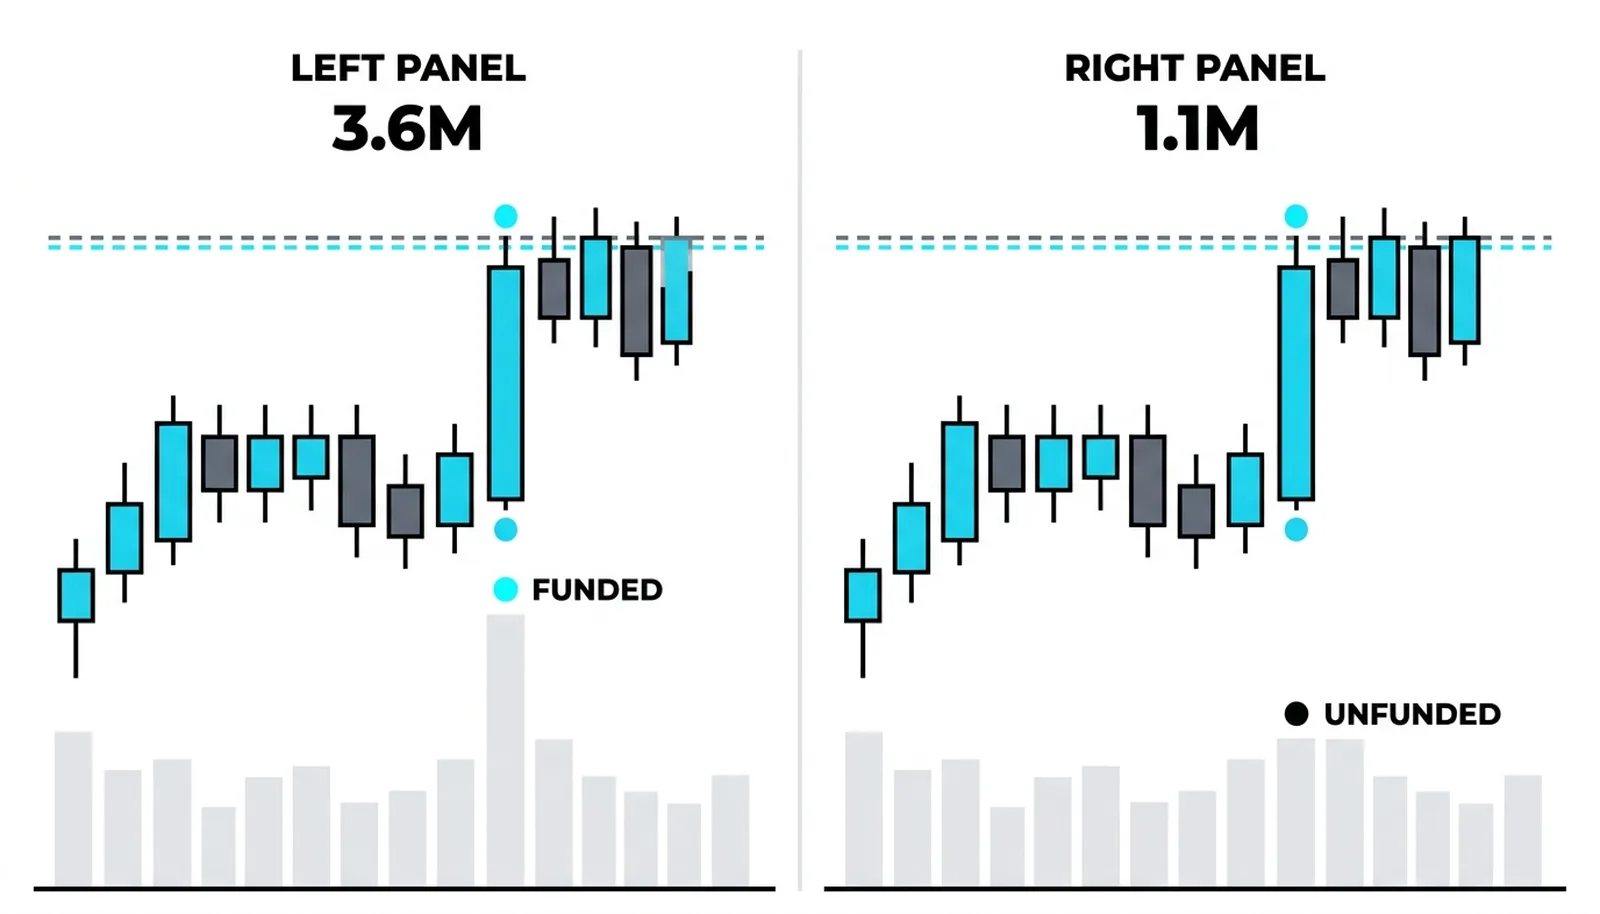
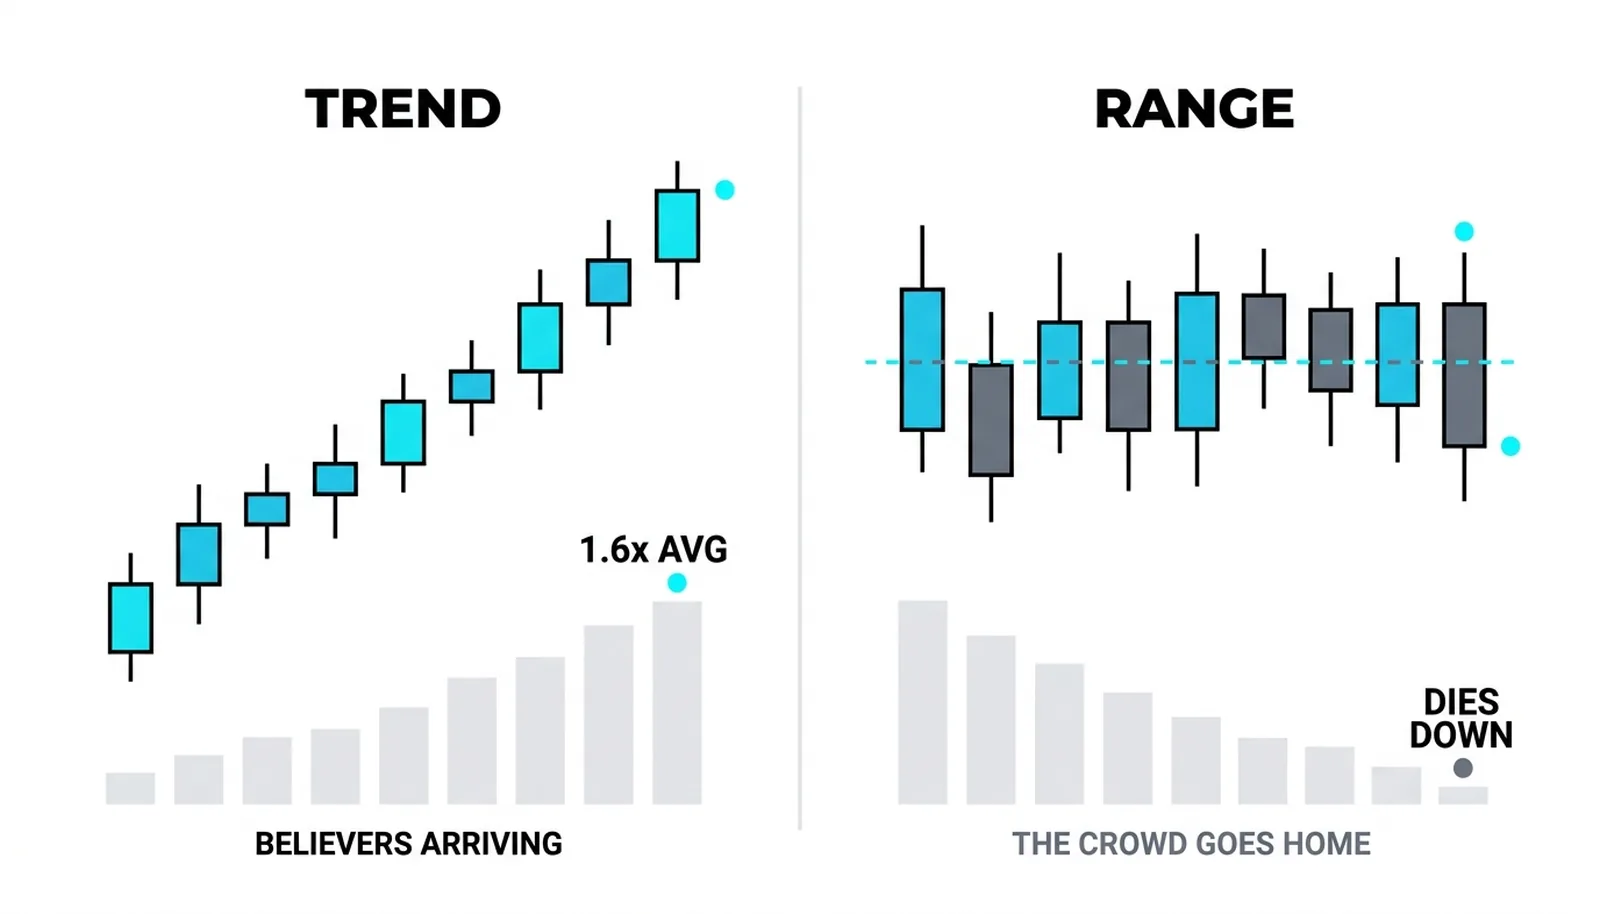
The practical rules for reading volume as confirmation of a move, including the specific patterns to look for, live in the lesson on volume as confirmation. This lesson's job is the underlying logic: you trust the count because it measures commitment, and commitment is what sustains a move after the initial push fades.
The Honest Limits
Honesty about volume includes honesty about where it falls short. Three limits matter.
First, spot forex has no central exchange. There is no single tape counting every euro or yen that changes hands worldwide. What your forex platform shows as volume is tick volume, a count of how many times the price updated during the bar. It is a proxy. Research and long practitioner experience suggest tick volume tracks real activity reasonably well, but it is not a true count of contracts, and you should treat it as an estimate rather than a measurement.
Second, different data feeds aggregate differently. One broker's volume bars will not match another's exactly, because each sees a different slice of the market or builds bars on a slightly different clock. The practical rule: compare volume only within one feed. A bar that looks huge on your platform means something relative to your platform's own history, nothing more.
Third, and most important, volume tells you participation, never direction by itself. A massive volume bar means heavy trading. It does not tell you whether buyers or sellers won, whether the move continues, or whether the day marked a top. A surge in volume can power a breakout or mark the exact exhaustion point where a move dies. The count is honest, but it is silent about intent. You still need price structure to interpret what the participation meant.
How This Level Uses It
The rest of this level builds a working toolkit on top of this foundation. Each upcoming lesson takes one slice of the volume-reading skill.
- Effort versus result compares what volume spent against what price achieved, the fastest way to spot when a move is running out of fuel.
- Volume climaxes covers the extreme spikes that often mark turning points, when participation hits a frenzy and the move exhausts itself.
- Trend versus range behavior shows how healthy volume patterns differ depending on whether the market is traveling or chopping sideways.
- Profile views reorganize the same count by price level instead of by time, revealing where the market actually did its business.
Every one of those lessons assumes what this lesson established: the count can be trusted more than any derived number, within its limits. Without that foundation, the techniques are just shapes on a screen.
Two Breakouts, One Honest Reading
Here is a hypothetical illustration with round numbers. A stock has bumped against resistance at 50 three times over two months. Its average daily volume is 1.1 million shares.
Breakout one. The stock pushes through 50 and closes at 50.8. Volume for the session prints 2.9 million shares, nearly triple the average. Participation says the crowd funded this move. Over the following two weeks, the price grinds higher and reaches 56. The breakout had believers, and the believers kept buying.
Breakout two. Months later, a similar setup forms elsewhere on the chart. The stock closes at 50.9, again clearing resistance. But volume prints 0.6 million shares, roughly half the average. The price moved and almost nobody showed up. Within three sessions, the stock slips back below 50 and returns to its old range.
Same price event. Same resistance level, nearly the same close. The count separated the real breakout from the fake one before the follow-through proved it. The fading case has a price-side signature too: a new high printed on half the participation of the first push, which is the classic warning the volume confirmation lesson turns into rules.
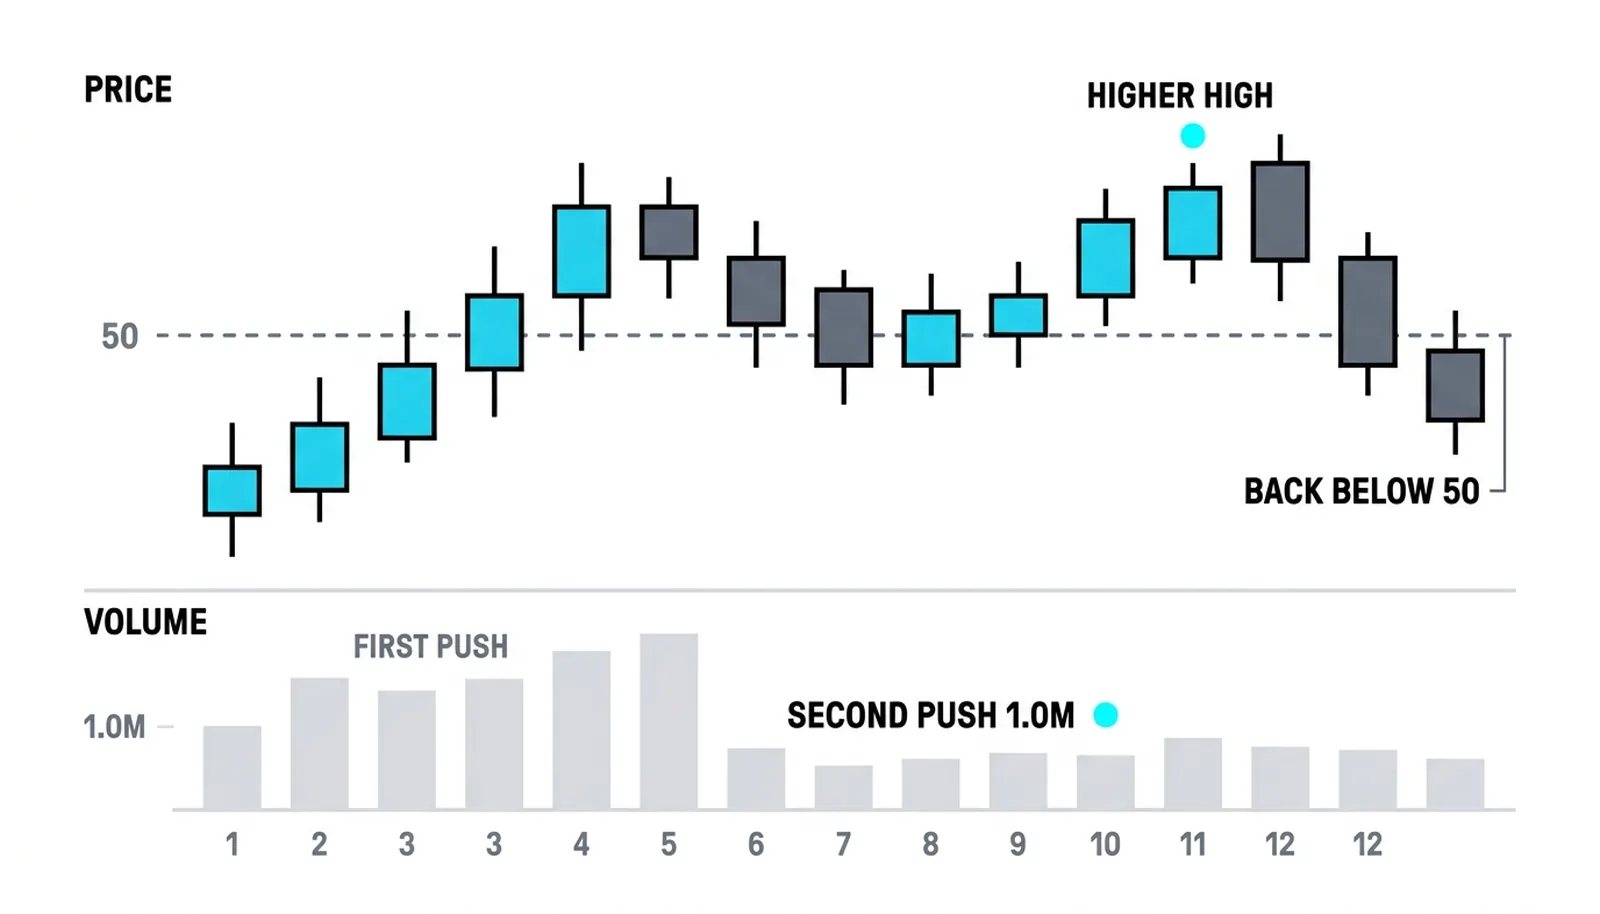
The table below summarizes the four basic combinations and the honest reading of each.
| Price | Volume | What Participation Says | Honest Reading |
|---|---|---|---|
| Up | Up | Buyers are paying to join the move | Healthy advance with sponsorship |
| Up | Down | Fewer traders backing each new high | Rally running on thin support |
| Down | Up | Heavy selling pressure with real commitment | Decline has conviction behind it |
| Down | Down | Sellers losing interest as price falls | Weak decline, possibly fading out |
Volume Questions
Is volume really more honest than price?
Yes, in a specific sense: volume is a direct measurement of activity, while price is just the level where the last trades agreed to clear. Neither lies, but price can drift on almost no participation, which makes it easy to misread. Volume forces you to see how much commitment stood behind each move, which is why traders treat it as the more trustworthy stream.
Why does forex volume differ from stock volume?
Stocks trade on centralized exchanges that count every share, so stock volume is a true total. Spot forex is decentralized across banks and platforms worldwide, so no complete count exists. What forex platforms display is tick volume, the number of price updates per bar, which approximates activity but is not a literal count of contracts traded.
Can volume be manipulated?
The reported count itself is hard to fake on regulated exchanges, since it reflects executed trades. However, participants can generate activity, such as wash-style trading where related parties trade with each other, to make a market look busier than genuine interest warrants. This is one more reason to read volume alongside price structure rather than treating any single spike as proof of conviction.
What is a good average volume baseline?
Use a simple average of recent volume on the same instrument and the same feed, commonly the last 20 to 50 sessions, as your reference. There is no universal good number, because what counts as heavy volume depends entirely on that instrument's own history. A reading near triple its average means something; the same raw figure on a different instrument may be routine.
Next up, the level puts this foundation to work: the effort-versus-result lesson shows what happens when heavy volume produces suspiciously little price progress, and that single comparison will change how you read every trend you trade.