What Is Volume and Why It Matters
Volume is the number of units traded during a period, and it tells you how much conviction stands behind a price move. A price move on heavy volume is an agreement. The same move on thin volume is a rumor.

Price tells you the verdict, and volume tells you how many jurors signed it. Two charts can show the identical rally and mean completely different things, depending on how many participants actually showed up. Learning to read that difference is one of the most useful skills you will build at this stage.
Where Volume Shows Up on Your Chart
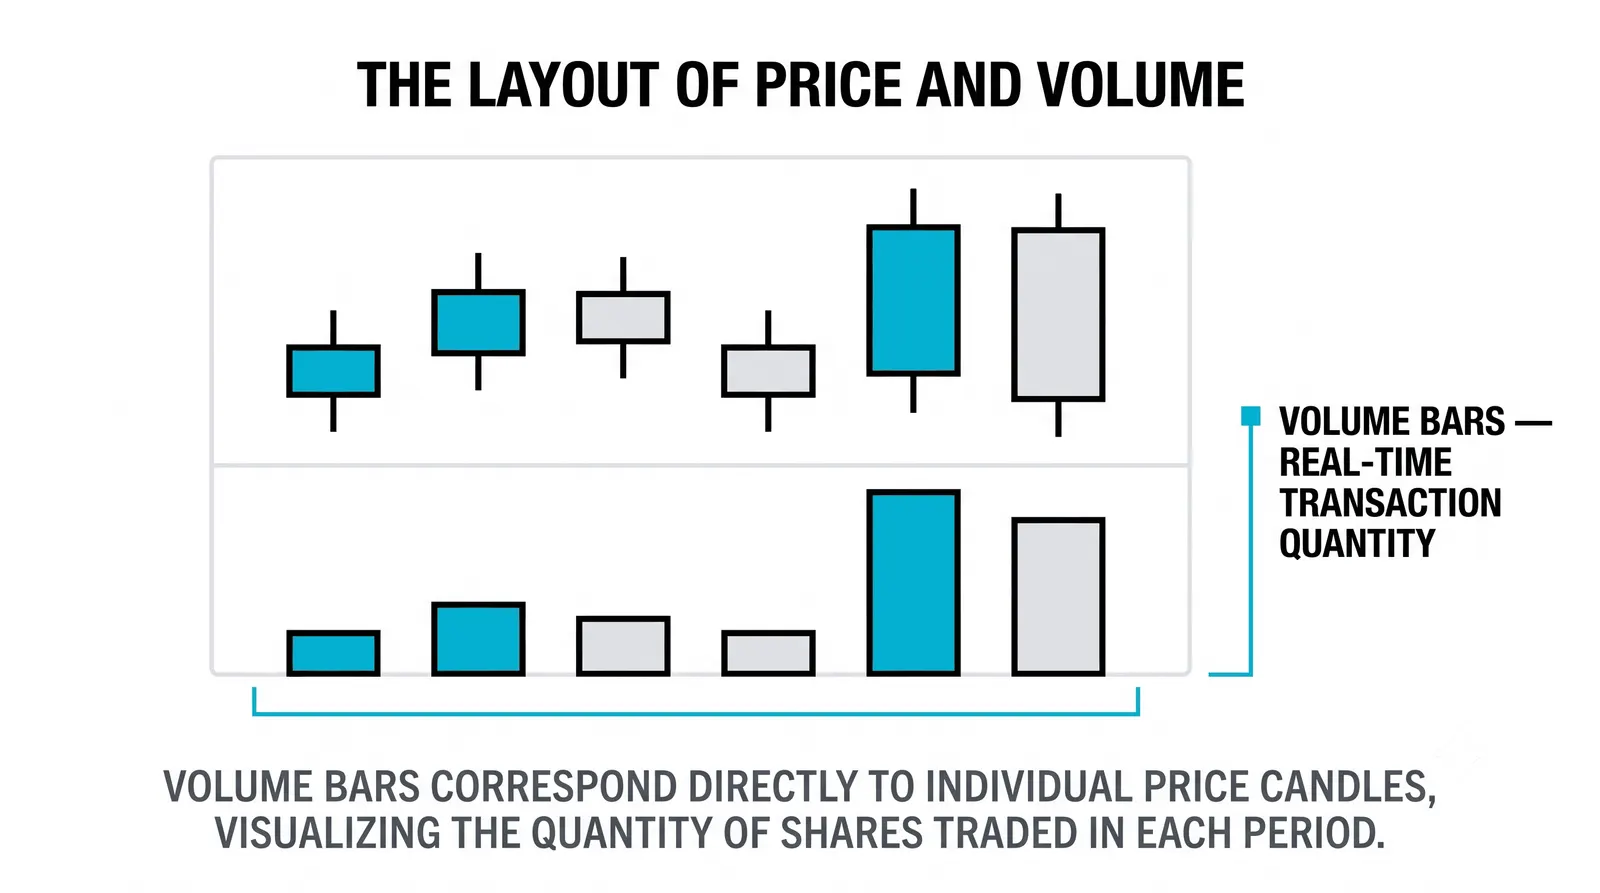
Open any charting platform and you will see a row of vertical bars along the bottom, one bar per candle. That histogram is the volume for each period. A tall bar means a busy candle. A short bar means a quiet one.
The units depend on the market. For stocks, volume counts shares traded. For futures, it counts contracts. The unit changes, but the meaning does not: how much changed hands while price did whatever it did.
Most platforms also color the bars to match the candle, green for up periods and red for down. That coloring is a convenience, not a signal. The height of the bar is what carries the information.
What High Volume Tells You
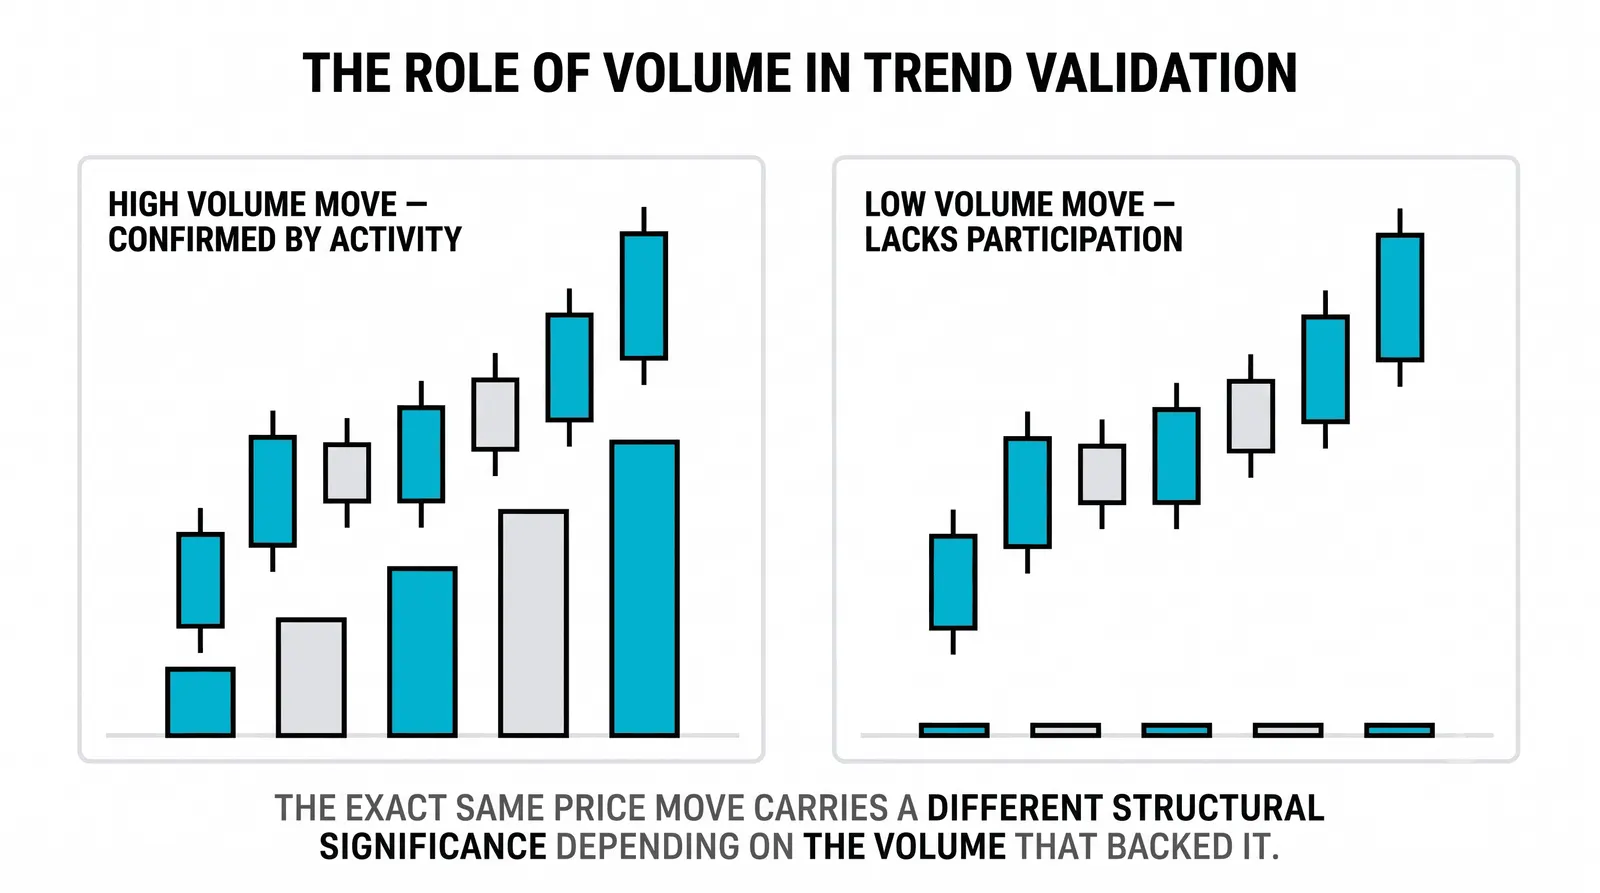
High volume means real participation. A large number of buyers and sellers agreed to transact at these prices, which means the market broadly accepts the new level. Price did not drift there. It was pushed there by weight of numbers.
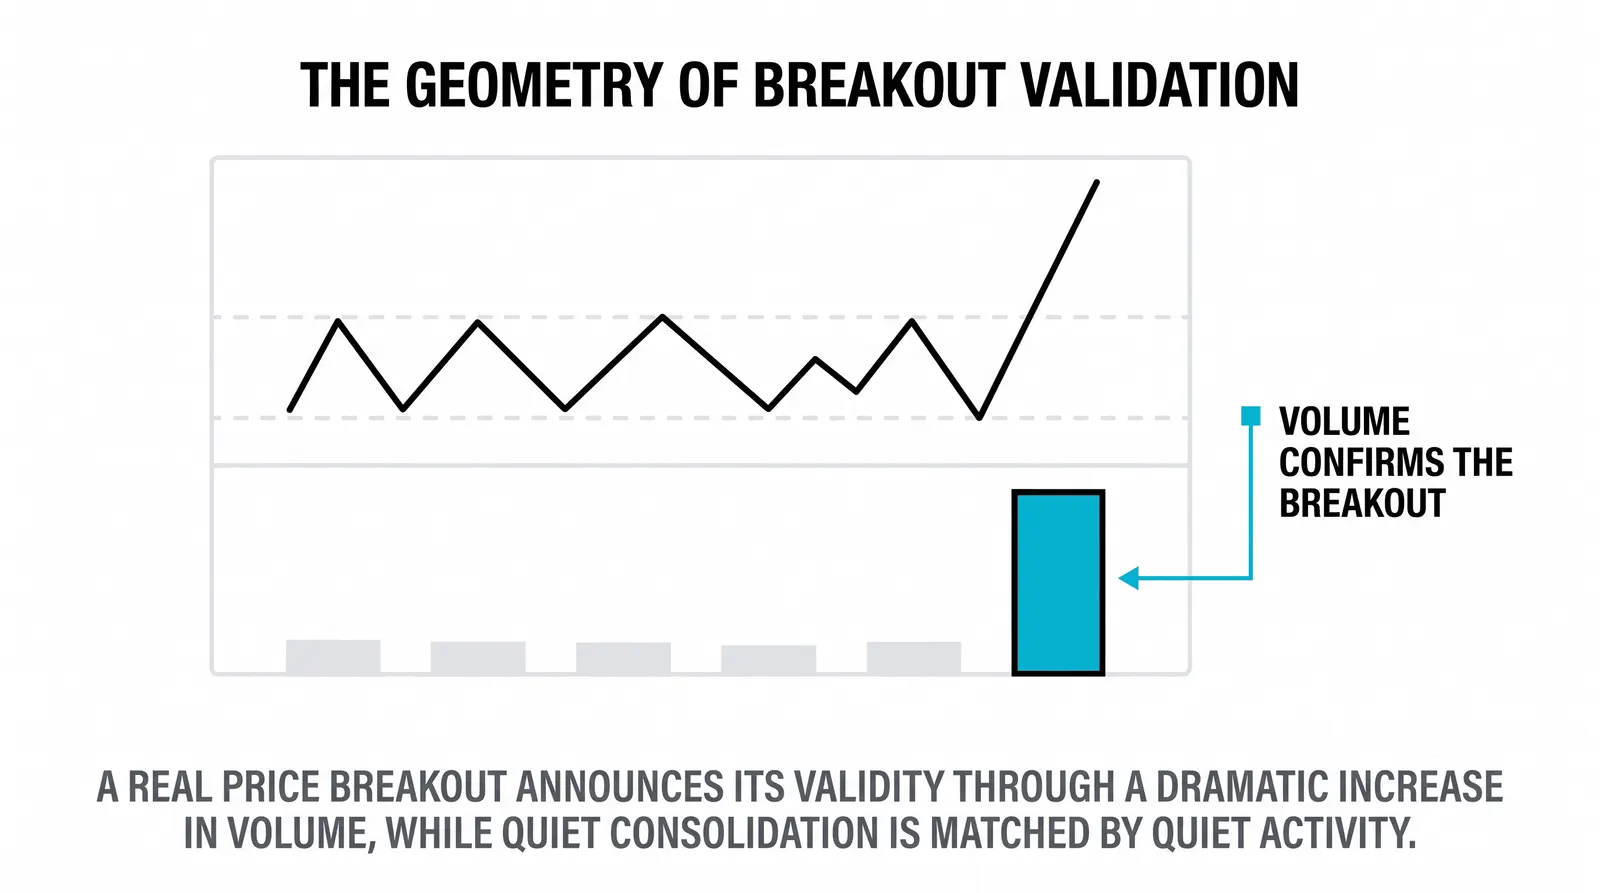
This is why breakouts on heavy volume deserve your attention. When price clears a resistance level and volume expands at the same time, the crowd is voting for the move. Enough traders believe in the new price to commit real money to it.
The same logic applies to reversals. A long decline that ends with a huge volume spike and a strong close often marks genuine capitulation and fresh buying, not a coincidence. Heavy participation at turning points is evidence. Treat it that way.
What Low Volume Tells You
Low volume means thin agreement. Few traders bothered to participate, so the move reflects the opinions of a small crowd rather than the market as a whole. Prices on low volume drift. They do not decide.
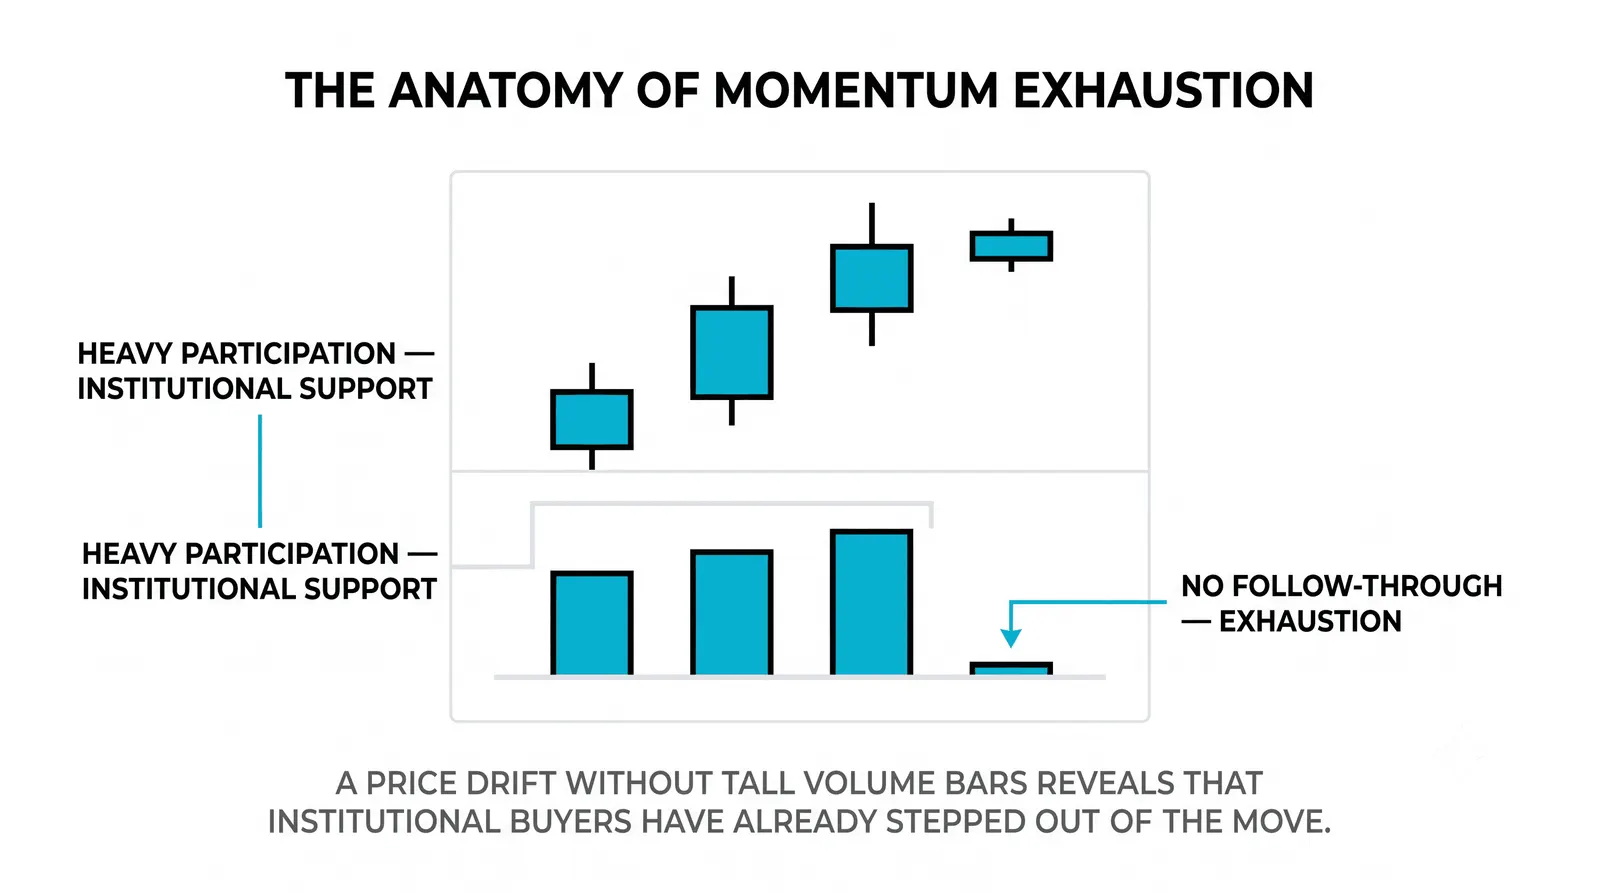
New traders get this wrong most often: a rising price on falling volume is a warning, not a celebration. The rally is running on fewer and fewer believers. Each new high convinces fewer participants. That pattern frequently precedes stalls and reversals, because there is no broad support underneath the price.
Low volume is not automatically bearish. Quiet sessions happen around holidays, lunch hours, and before major news. Context matters. But when price makes an important move and volume stays silent, you should discount the move until participation confirms it.
Reading Volume and Price Together
This is the core skill of volume analysis, so name it plainly: you never read volume alone. You read it against what price did in the same period. There are four combinations, and each one carries a different hint.
- Up on high volume: strong buying interest. The move has broad support and is more likely to continue.
- Up on low volume: weak conviction. The rise may be drift or a trap, and it deserves skepticism.
- Down on high volume: strong selling pressure. Sellers are committed, and the decline carries weight.
- Down on low volume: weak selling. Often just a pullback or pause rather than a real change in direction.
Notice the pattern. Volume does not tell you direction. Price already did that. Volume tells you whether to believe the direction. A move with participation behind it is information. A move without it is noise until proven otherwise.
The table below compresses the four readings into one reference.
| Price | Volume | Reading | Typical Implication |
|---|---|---|---|
| Up | High | Strong agreement to buy | Move has support; continuation more likely |
| Up | Low | Weak buying interest | Rally is fragile; watch for failure |
| Down | High | Strong agreement to sell | Decline has weight; respect it |
| Down | Low | Weak selling interest | Often a pullback, not a reversal |
A Worked Example: The Same Breakout Twice
Imagine a hypothetical stock that has bumped into resistance at 50 three times over two months. You are watching for a breakout. Its average daily volume lately is about 1 million shares.
Version one: the stock breaks above 50, and volume that day runs to 3 million shares, triple the recent average. The close holds at 51. This is broad participation. A large crowd agreed the stock is worth more than 50, and they paid to prove it.
Version two: the stock breaks above 50 on the quietest day of the month, just 400,000 shares, and closes at 50.50. The price picture looks identical on the candlestick chart. The evidence underneath it is completely different. Almost nobody showed up for this breakout.
Now watch the retest, because this is where volume earns its keep. In version one, price dips back to 50 a few days later, volume stays heavy at 2 million shares, and buyers defend the old ceiling as a new floor. That confirms the breakout. In version two, price slides back under 50 on thin, indifferent volume and keeps fading. The breakout fails, exactly as the weak participation hinted it might.
Same price pattern. Opposite conclusions. The only difference was how many traders stood behind the move.
What Volume Cannot Tell You
Be honest about the limits. Volume tells you how much traded, not who traded it. You cannot see from a volume bar whether the buyers were institutions, retail traders, or one large fund splitting orders. It is a count, not an identity check.
Volume also does not predict the future. High volume on a breakout tells you the move has genuine support right now. It says nothing about whether that support exists tomorrow. News can hit, sentiment can flip, and yesterday's conviction becomes irrelevant.
Volume is participation, not prediction. Use it to grade the quality of a price move, then combine it with everything else you already know: trend, structure, and support and resistance. A high-volume move into a major resistance level is still a move into resistance. Volume improves your read of the evidence. It does not replace judgment.
Questions About Volume
What counts as a good volume level?
There is no universal number, because volume is relative. Compare today's volume to the same instrument's recent average, usually the last 20 to 30 periods. A bar running at double or triple its average is significant. A bar at half the average is quiet. The absolute figure means little without that baseline.
Does volume work on every market?
It works wherever volume is accurately reported, which means stocks, futures, and exchange-traded instruments. Spot forex is the exception, because there is no central exchange counting every transaction, so the volume you see is only a sample from one provider. Treat forex volume data as approximate at best.
Why is volume low during some sessions?
Participation follows the clock. Volume is typically heaviest near the open and the close, and thinnest during midday, overnight sessions, holidays, and the days before major announcements. Low volume in those windows is normal scheduling, not a signal. Reserve your skepticism for important price moves that happen to land on quiet volume.
Should I trade on volume alone?
No. Volume is a confirmation tool, not a standalone system. It tells you how much weight sits behind a price move, but it gives you no entry, no target, and no stop. Pair it with the price action and support and resistance skills you already have, and it will sharpen every one of them.
Your next step is simple: pull up charts of instruments you already follow and start reading the volume histogram against every meaningful move. Once you can grade conviction at a glance, you are ready to study how volume confirms price moves at breakouts, gaps, and climactic tops.