Vertical vs Horizontal Volume, Explained
Vertical volume is the same trade data as horizontal volume, read along a different axis. Vertical volume is the familiar histogram under the chart, and it answers when participation happened; horizontal volume is a sideways histogram stacked along the price axis, and it answers at which price levels participation happened. The second view is the one most traders have never used, and it changes how levels get drawn.

Think of the same commute read two ways: the clock on the dashboard says when the road was slow, the wear on the asphalt says where it is always slow. One dataset, two axes. This lesson covers both, because the previous lesson already established why volume data can be trusted at all, and that argument does not need repeating here.
Vertical: The Time View
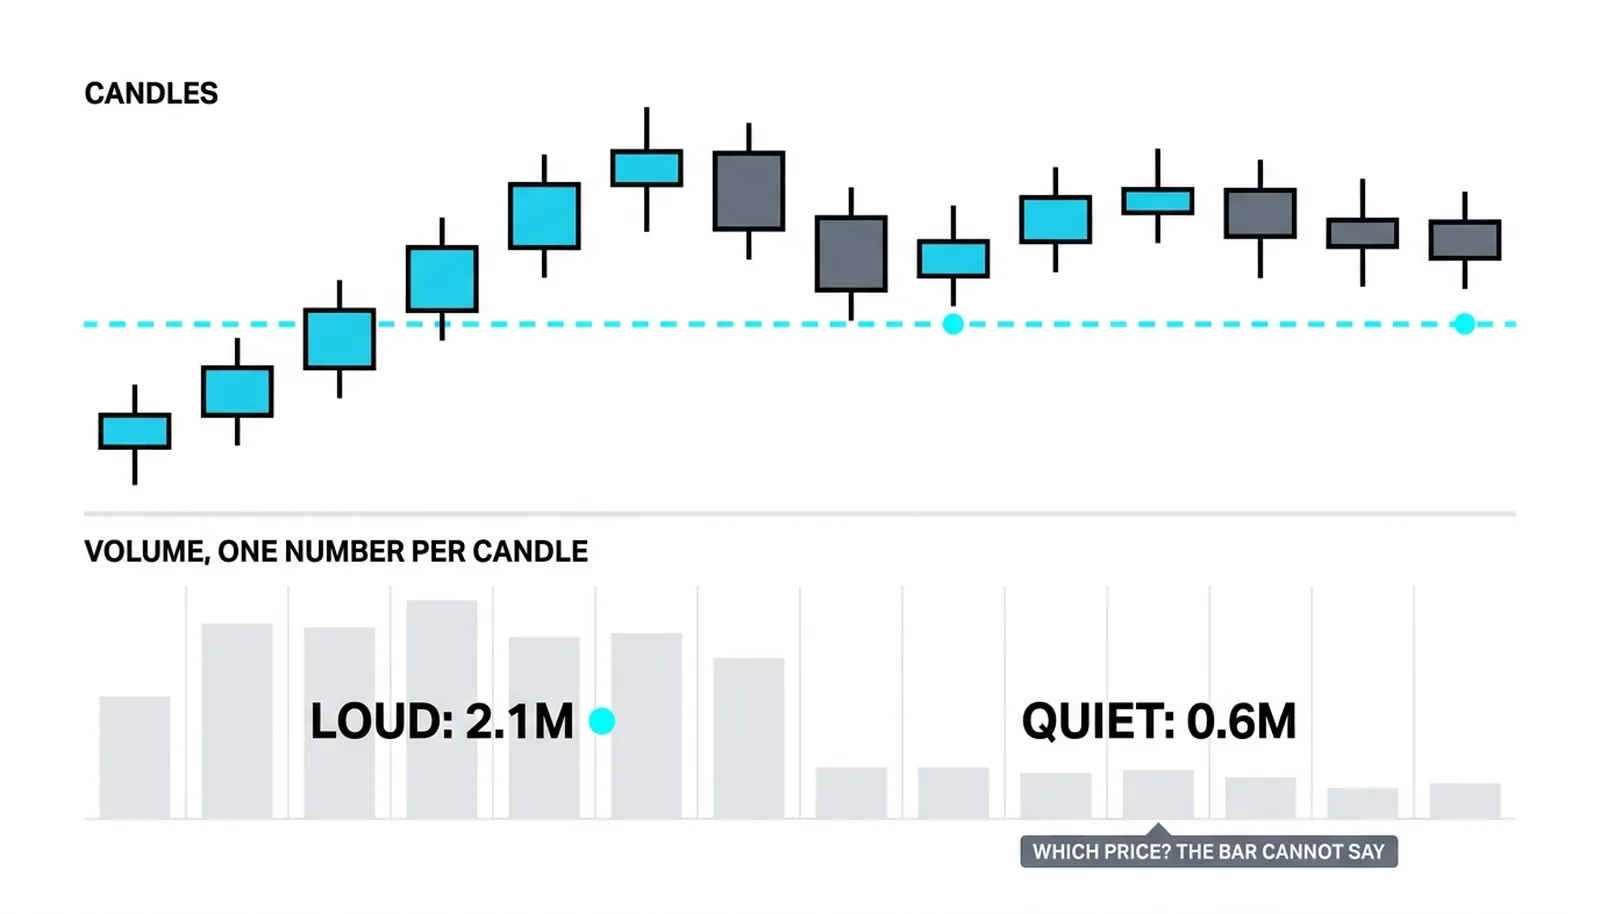
Vertical volume is the default on every charting platform. Each bar sits directly beneath one candle and shows how many shares, contracts, or units changed hands during that candle's life. One candle, one bar, one total.
Its strengths are all about timing. A breakout candle carrying triple its average volume tells you the move attracted real participation. A rally whose bars shrink session after session tells you enthusiasm is fading. A range where volume dries up tells you the crowd has lost interest, which often precedes expansion.
Those timing reads are the bread and butter of volume work, and they are genuinely useful. Spikes confirm. Dry-ups warn. Divergence between price and participation flags tired trends.
The blind spot is structural. The vertical histogram collapses everything that happened inside a candle into one number. A candle that traded heavily at 101 and barely at 104 looks identical to a candle that did the opposite, as long as the totals match. The time view cannot tell you which prices attracted the business.
Horizontal: The Price View
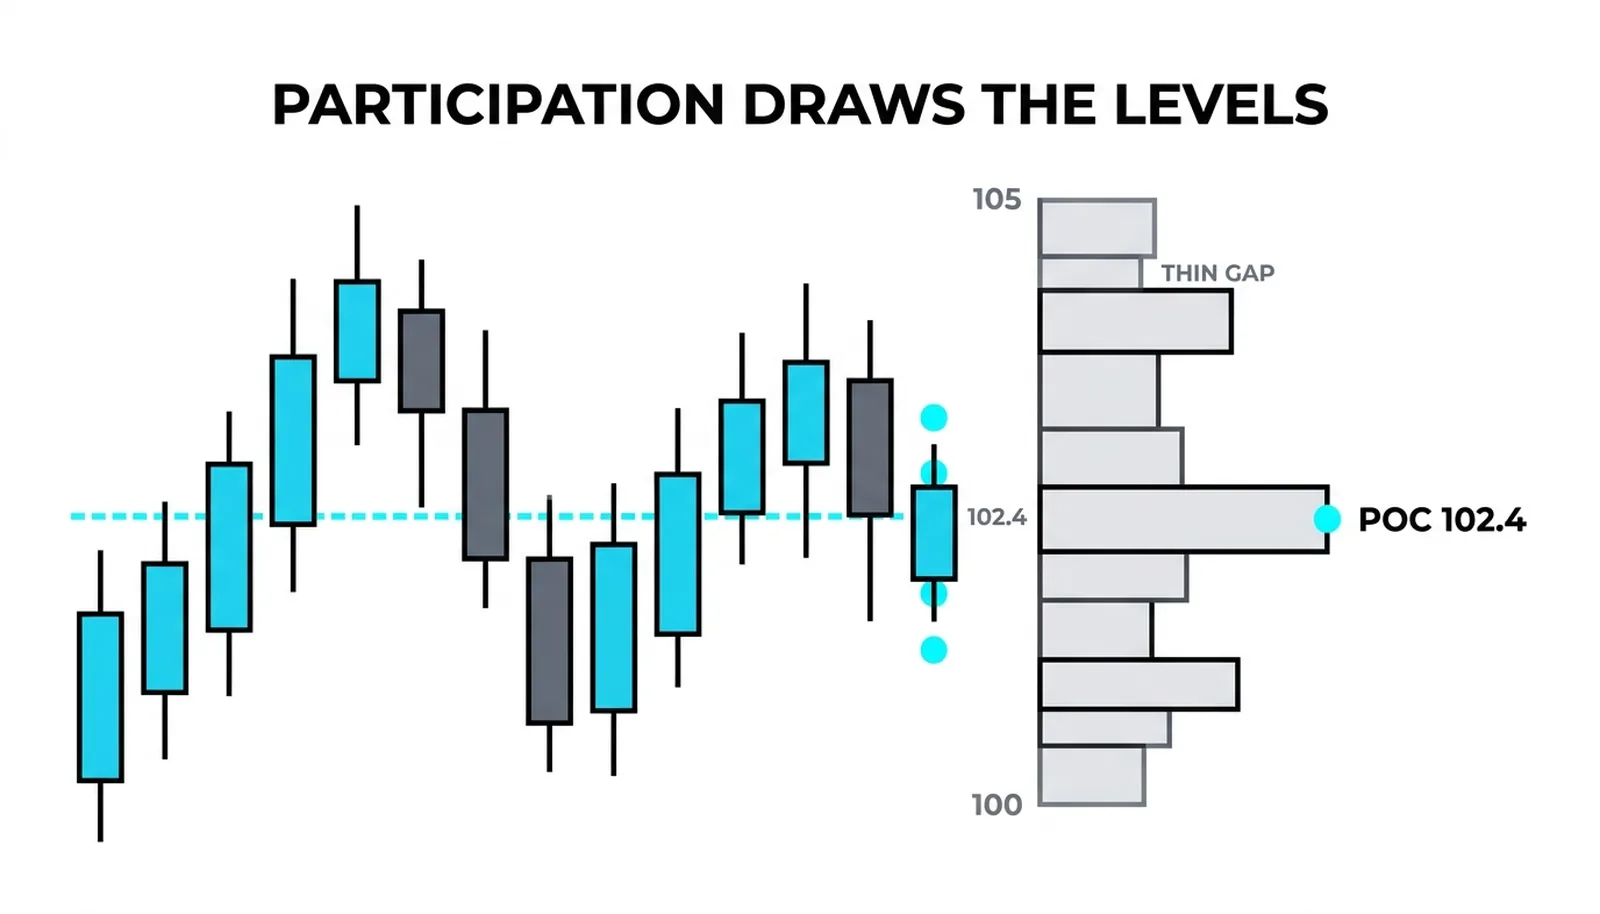
Horizontal volume flips the question. Take a lookback window, say the last twenty sessions. For each price bucket touched during that window, sum the volume that traded there. Then draw those totals as sideways bars along the price axis, so the histogram grows left or right from the edge of the chart instead of up from the bottom.
The tallest bucket is called the point of control. It is the single price where the most business was done over the window, the level the market kept coming back to and agreeing on.
Clusters of tall buckets are called high-volume nodes. They mark price zones where participation was heavy and two-sided trade was comfortable. Thin stretches between them are low-volume nodes, prices where little trade happened because the market moved through quickly or never accepted those levels.
The result is a profile of the window: fat where the market spent time and did business, thin where it passed through in a hurry. The support and resistance lessons own the craft of drawing levels by eye; horizontal volume is a way of letting participation draw the levels instead.
What the Horizontal View Adds
Prior days' point of control tends to pull price back toward it and act as a shelf. Price drifting back toward it often stalls there, because that is where the most positions were built and where the most traders have a stake. Acceptance at a busy price looks like stalling and churning. Rejection of a busy price looks like acceleration away from it.
High-volume nodes behave like accepted-value zones. Price entering one tends to slow, rotate, and take time to cross, because both buyers and sellers did heavy business there and the level is crowded with memory. Low-volume nodes behave like territory price crosses quickly, because there is little inventory of old positions to slow the move. Breaks through thin zones often travel fast until they reach the next fat node.
Here is the honest caveat. The profile depends entirely on the lookback window. A twenty-session window produces one point of control; a sixty-session window produces a different one, possibly at a different price with different nodes. The tool does not discover eternal levels. It summarizes a chosen slice of history, and the trader chooses the slice.
That dependence is not a flaw to hide. It is a parameter to set deliberately, matched to the timeframe being traded.
Using Both Without Clutter
Split the jobs by question. Vertical volume serves timing decisions: is this breakout confirmed, is this rally losing fuel, is this range going quiet before a move. Horizontal volume serves level decisions: where is the accepted price, where will price likely stall, where will it likely run fast.
Most platforms show the vertical histogram by default and hide the profile behind an indicator menu, often named volume profile or market profile depending on the vendor. Turning both on at once clutters a chart fast, so many traders keep vertical on the main chart and pull the profile up only when marking levels.
Neither replaces price structure. They grade it.
A level drawn from structure is a hypothesis. Volume in either orientation is evidence about that hypothesis: did participation show up at the level, and when. Structure says where to look. Volume says how seriously to take what is found there.
One Range, Read Both Ways
Hypothetical numbers, round ones. A stock ranges between 100 and 105 for a month.
The vertical view shows the first week loud, about 1.8 million shares a day, then the last two weeks quiet at roughly 0.7 million a day. Read along the time axis, the story is fading interest: something happened early, the crowd showed up, then attention drained away.
The horizontal view over the same month tells a different story. The point of control sits at 102.5, holding about 40 percent of the month's entire volume. Fat nodes sit at 101 and 104. A thin gap runs between 104.5 and 105, where almost nothing traded.
Now price, after the quiet weeks, drifts back to 102.5. It stalls there for three sessions, churning in a tight band, then bounces. That is acceptance at the busy price doing what acceptance does: the level where the most positions were built attracts trade, absorbs orders, and slows the move.
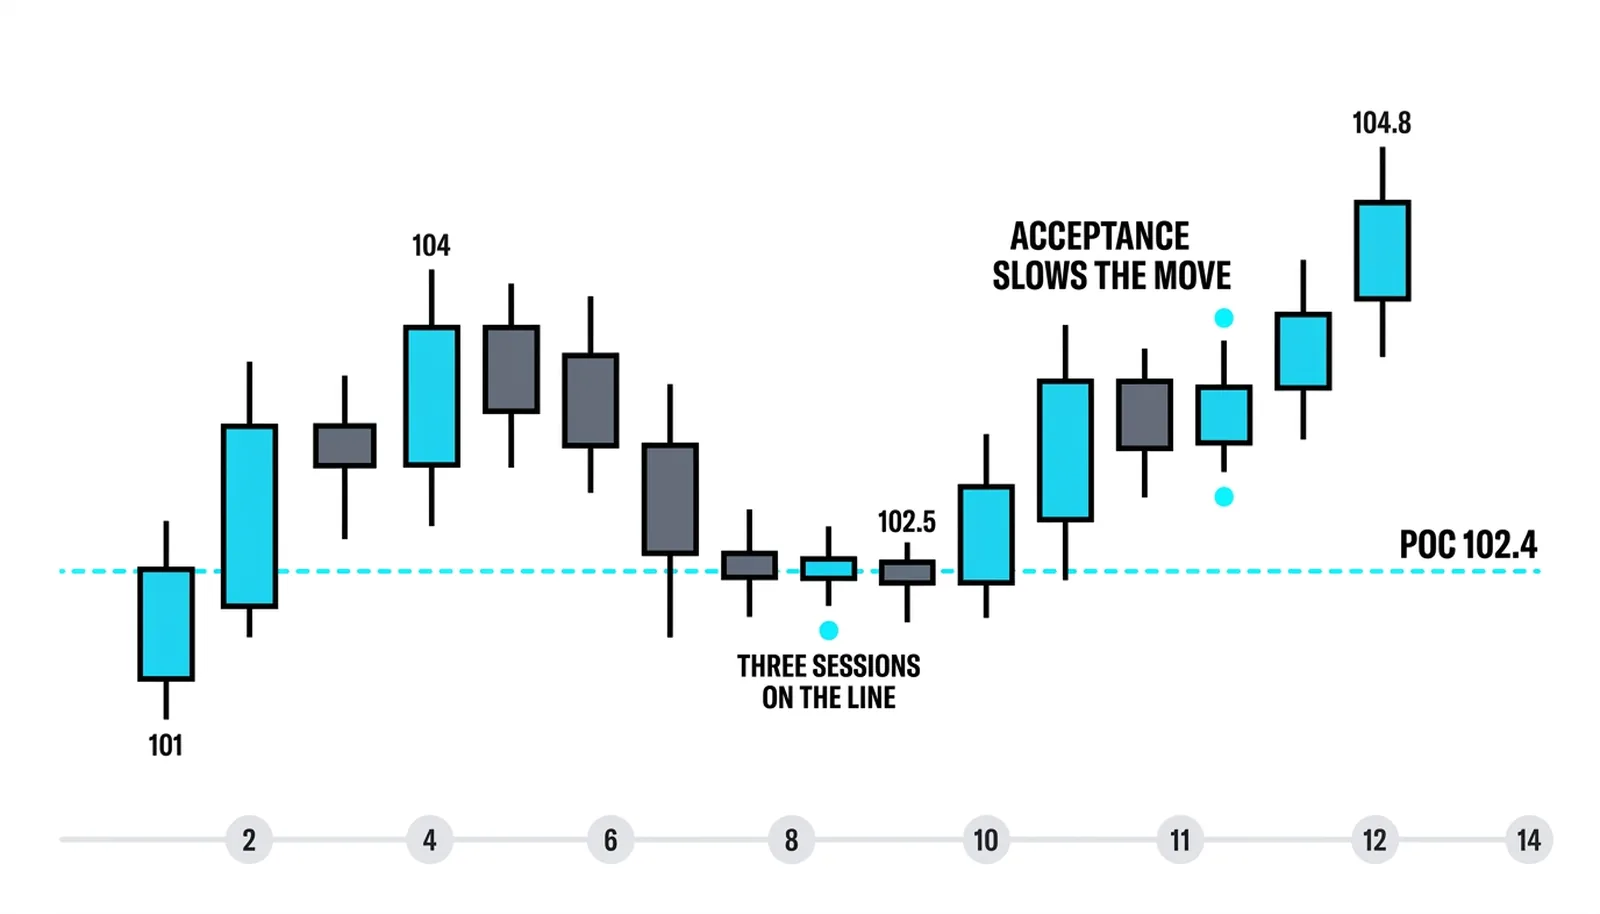
Neither view alone told the whole story. The time view said interest was fading. The price view said where the market's business was concentrated. Together they framed a testable expectation: a stall at 102.5, a fast trip through 104.5 to 105 if price ever got there.
| Question it answers | What it shows on screen | Its blind spot | |
|---|---|---|---|
| Vertical volume | When did participation happen? | Histogram bars under each candle | Cannot say which prices the activity happened at |
| Horizontal volume | At which prices did participation happen? | Sideways histogram along the price axis | Cannot say when during the window the activity occurred |
| Both together | When and where did participation happen? | Timing bars plus a price profile over a chosen lookback | Neither draws structure; both depend on the trader's window and timeframe |
Vertical vs Horizontal Volume, Answered
What is a point of control in horizontal volume?
It is the single price bucket that traded the most volume over the chosen lookback window. It marks the level the market accepted most, and prior points of control often act as shelves or draw price back toward them when it returns.
Do high-volume nodes act as support and resistance?
They often behave that way, because heavy past participation means many positions were built there and many traders have a stake in the level. Treat them as zones where price tends to stall and rotate rather than as exact lines, and let structure confirm them.
Does horizontal volume repaint when the lookback changes?
Yes. Change the window and the totals, nodes, and point of control all recalculate, so the profile can shift noticeably. This is a property of the tool, not a defect; fix the lookback deliberately to match the timeframe being traded.
Which view should a beginner start with?
Start with vertical volume, because it is on every platform by default and its timing reads are the foundation for everything else. Add the horizontal profile once level-drawing from the earlier lessons feels natural, and use it to check whether participation agrees with the levels the eye picked.
The next lesson builds directly on this split: it takes the point of control and node structure introduced here and turns them into a repeatable way to plan entries and exits around accepted value.