Why Harmonic Patterns Fail: The Real Causes
Harmonic patterns fail for four reasons, and only one of them is the method doing its job. A harmonic pattern is a conditional structure: it promises an edge at a specific price zone only if every gate on the way there held. When a condition breaks, the promise is void, and any trade taken on the drawing after that point is a trade on a picture, not a pattern.

Think of a cracked bell, cast in the same shape as a sound one, its flaw hidden until the moment it is struck. A broken pattern looks identical to a valid one on the chart. The difference only sounds when price reaches the zone and the trade is struck. This lesson is the autopsy of that sound: the four ways the drawings die, what each death costs, and which deaths belong to the method and which belong to the trader.
Each pattern lesson in this level ended with a void rule. This lesson is the anatomy behind those rules, nothing more.
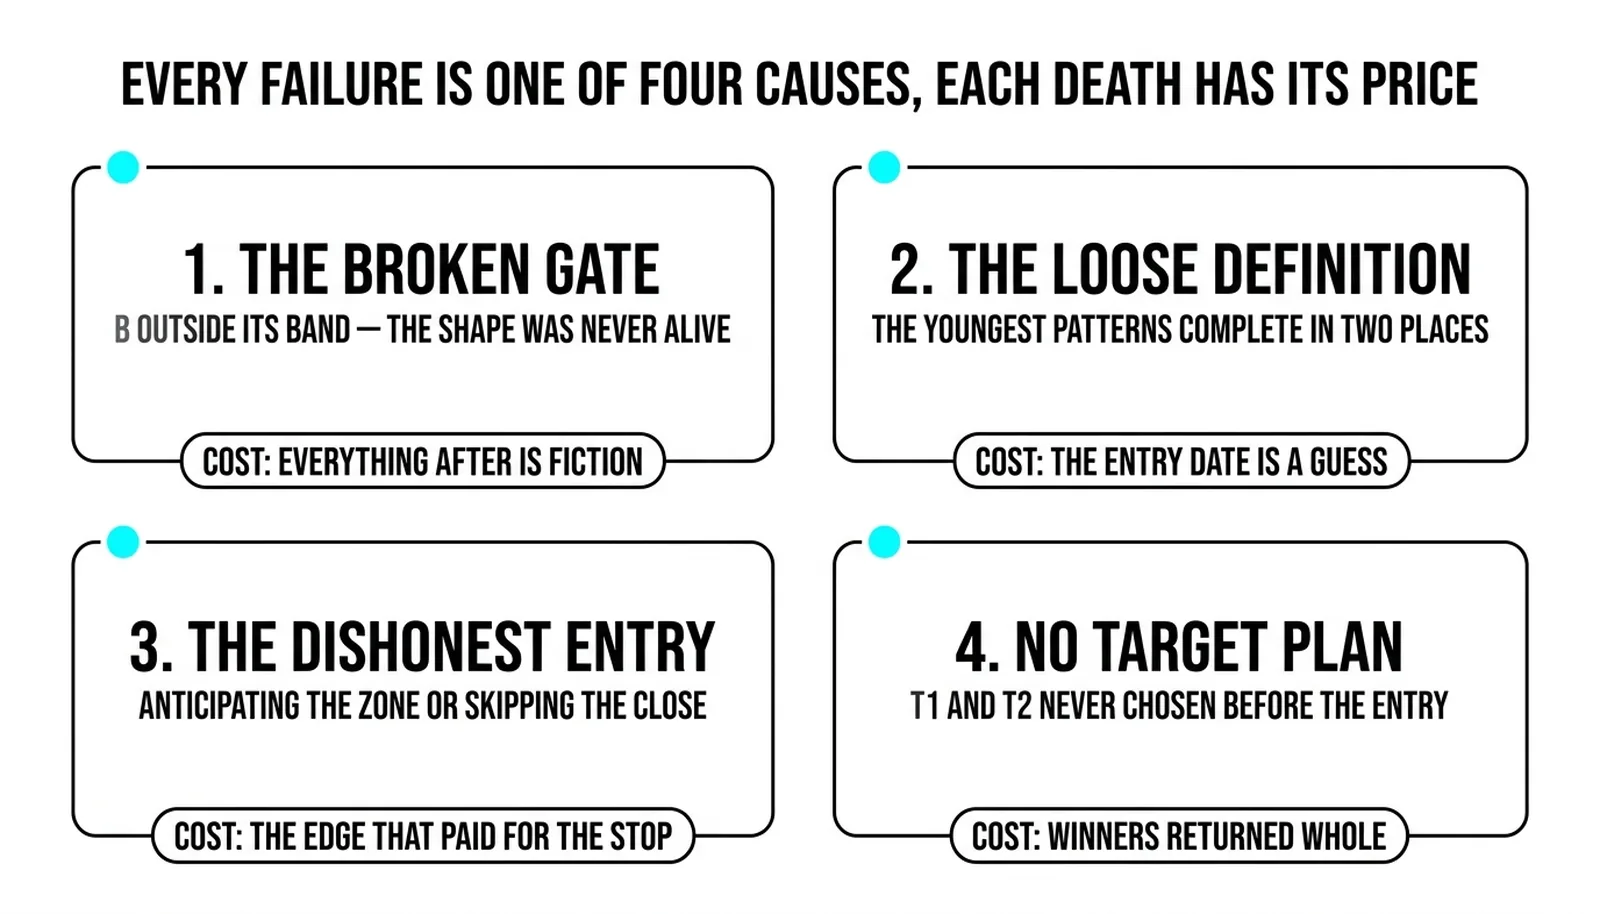
The Four Causes
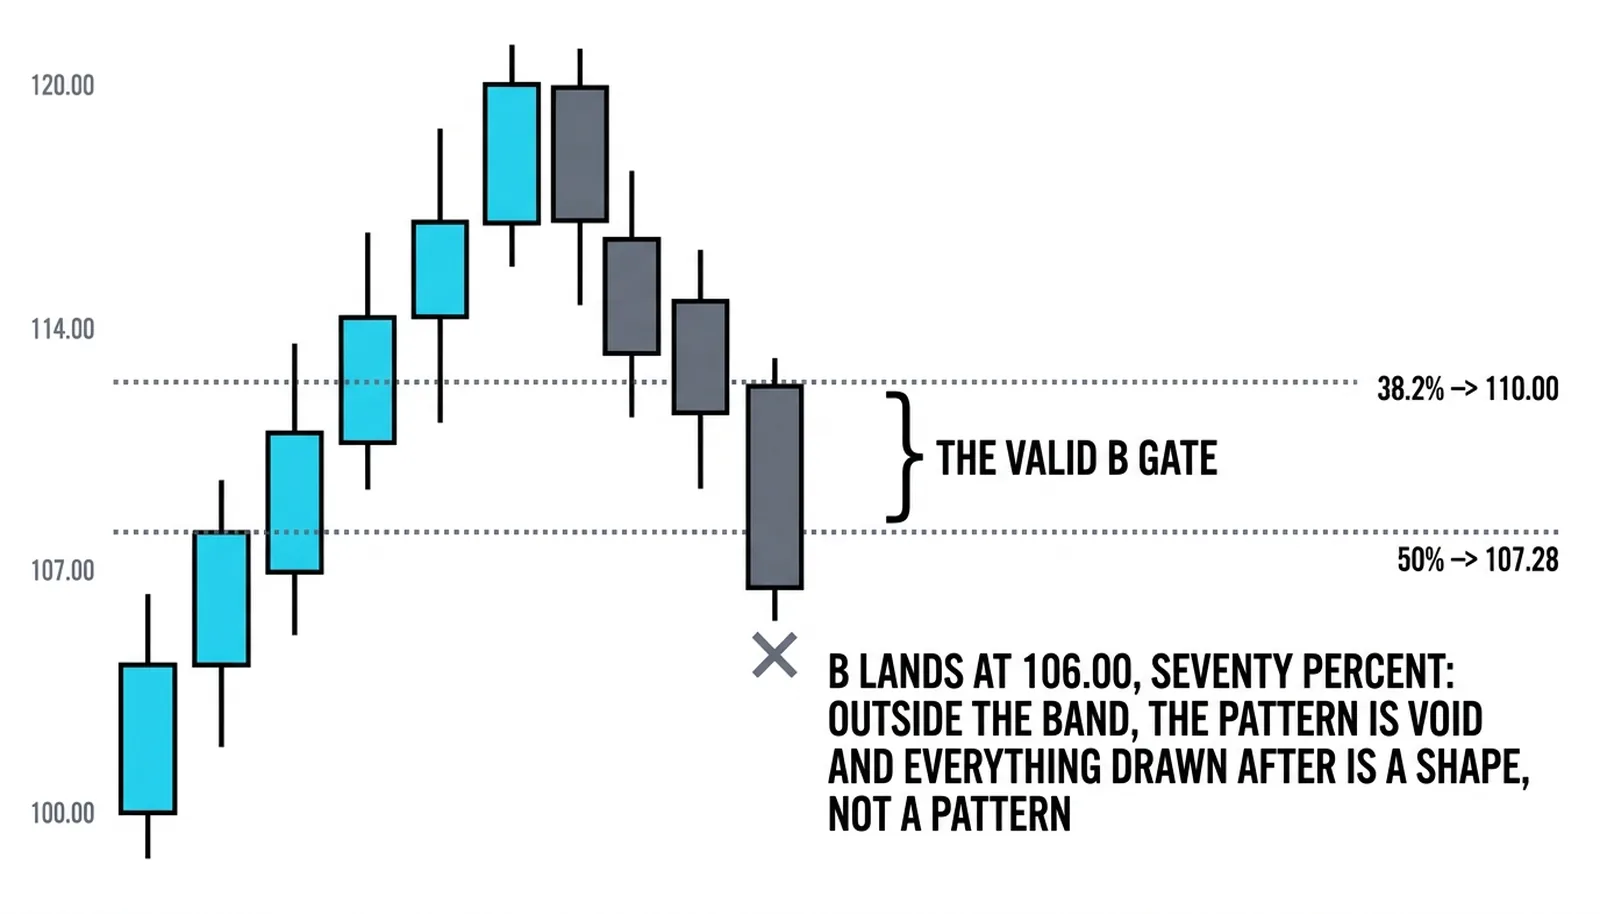
Cause one: the broken gate. Every harmonic shape has gates on the way to completion. The B point must retrace within its band, the C point within its own. When the pullback overshoots its band, the pattern is void before the zone even exists. The trader who keeps drawing it anyway has no edge. They have a shape. The cost here is total: the entire premise was falsified, so any result, win or loss, is luck.
Cause two: the broken zone. The pattern completed cleanly, every gate held, the zone was drawn correctly, and price closed beyond the void point anyway. The location was right and the exception happened. This is the method working as designed. The stop pays a small, defined cost, and that cost is the price of admission to the winners the same zone produces over a long series. No fix exists for cause two, and none is needed.
Cause three: the missing confirmation. The zone completes, price touches it, but no reversal candle prints. The patient trader waits and pays nothing. The impatient one enters on the touch and owns a position in a pattern that never finished confirming. The zone doing its job is not the same as the trade being on. Completion is location; confirmation is permission.
Cause four: the loose definition. The youngest shapes vary the most between sources. One author's ratios differ from another's, and a pattern whose completion depends on which book is open fails before price ever arrives. Harmonic trading doctrine defines the original ratios precisely for this reason: a pattern that two traders draw differently is not a pattern, it is a Rorschach test with a stop loss. If the definition floats, the edge floats with it.
The honest frame around all four: a pattern that fails by cause two was right about location. The method's profit is built from many small cause-two losses set against the larger wins the same zones produce. The failures that ruin accounts are causes one and three, and both are discipline failures dressed as analysis.
Which Failures Are the Method's and Which Are Yours
Cause two belongs to the method. A valid pattern that stops out at its void point cost exactly what the risk plan said it would cost, before entry. That loss is a business expense, identical in kind to the winner's gain. A trader who takes twenty clean cause-two losses in a row has a drawdown, not a problem.
Causes one, three, and four belong to the trader. Each one is a decision made after the market already said no. The gate broke and the drawing stayed. The confirmation never came and the entry went in anyway. The ratios were borrowed from a source the trader never checked against the original definitions. None of these are market events. All of them are choices.
The distinction matters because the fixes are different. Cause two gets accepted, sized, and repeated. Causes one, three, and four get eliminated by checklist: gate held, confirmation printed, definition fixed in writing before the session starts.
The autopsy habit is what separates the two. After every losing harmonic trade, the question is not whether the pattern worked. The question is which cause killed it. Write the cause in the journal next to the loss. After thirty trades, the journal shows a ratio: how much of the red is the method's toll, and how much is self-inflicted. Traders who skip the autopsy keep paying for causes one and three while blaming cause two.
One blunt sentence belongs here: most harmonic losses are self-inflicted.
The Autopsy at 106.00
The following numbers are hypothetical, round, and chosen to make the arithmetic visible.
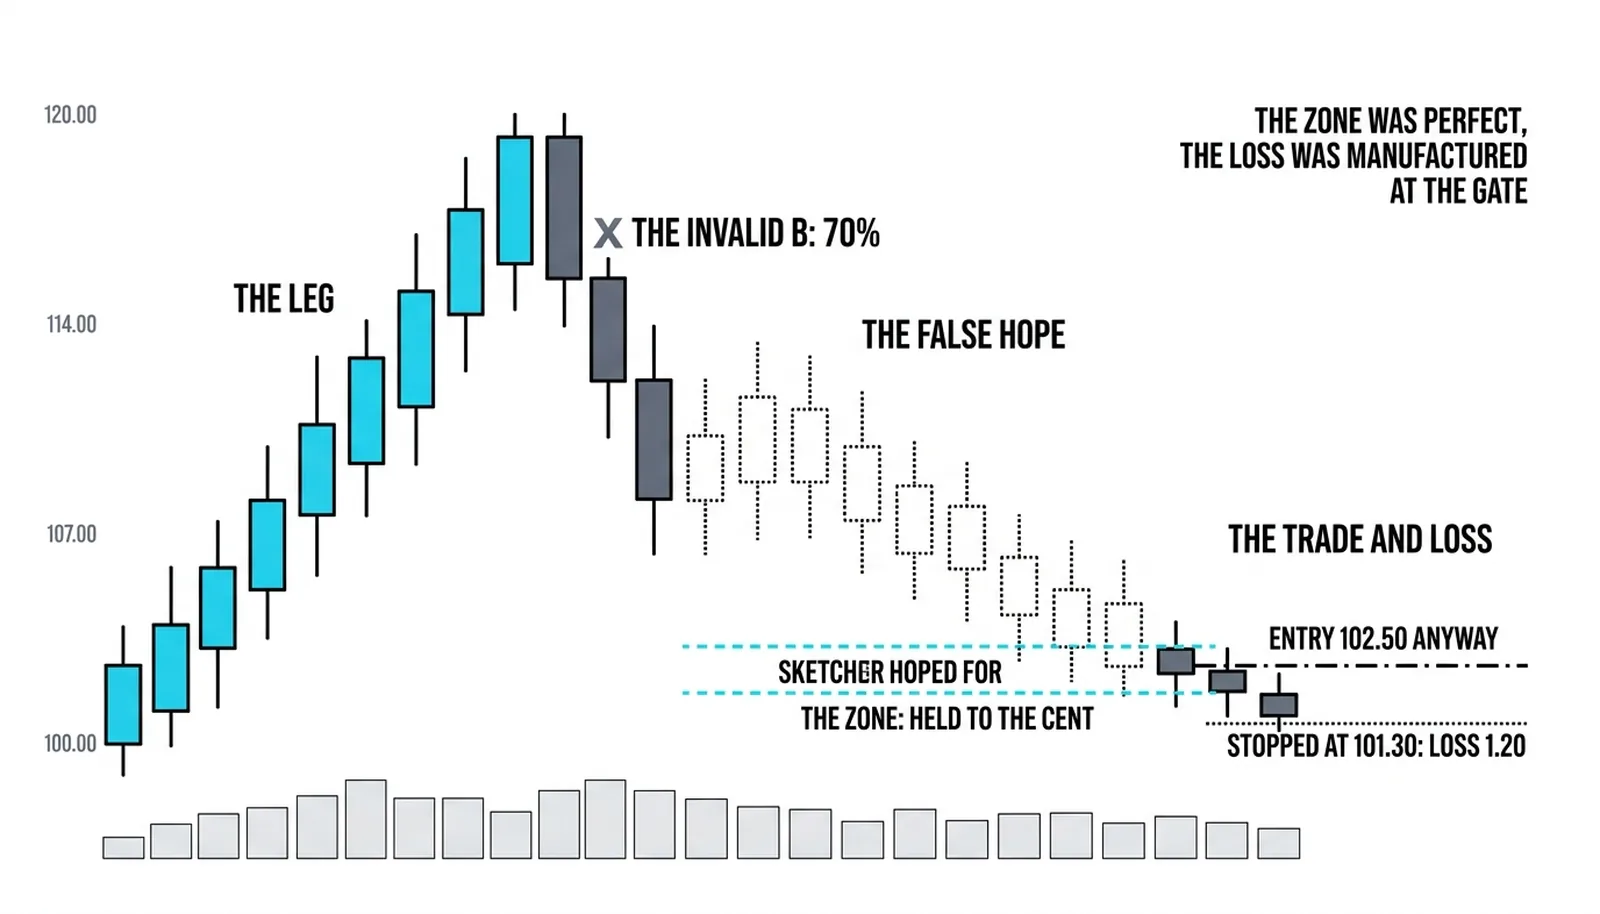
The swing runs from X at 100.00 up to A at 120.00. The pullback to B lands at 106.00. That is a retrace of 14.00 against a 20.00 swing, seventy percent of the way down. The bat's gate for B sits near the fifty percent line. Seventy percent is past the gate. The pattern is void at B.
The trader draws it anyway. C rallies to 114.65. D is projected at the 88.6 percent retracement of the XA leg, which lands at 102.28. Price falls to the zone and holds to the cent. The location work, taken alone, is flawless.
The reversal candle never prints. Price sits at 102.50, motionless at the zone, and the trader enters anyway at 102.50 with a stop at 101.30. The next session closes at 101.00. The stop takes the position out at 101.30. The loss is 1.20 per unit.
Now the autopsy. Nothing went wrong at the zone. The zone was perfect: projected at 102.28, respected to the cent. Nothing went wrong at the stop: it sat at the void point and did its job for a defined 1.20. The loss was manufactured two steps earlier, at a gate that read seventy percent. The pattern's edge was conditional on that gate. The condition failed. The edge went with it. Every pip of the trade after B was a position in a pattern that did not exist.
Cause three then piled onto cause one: even the voided drawing asked for a confirmation candle, and the entry ignored that too. One trade, two discipline failures, and a method that never got a vote.
| Cause | What Breaks | When It Is the Method's Fault | When It Is the Trader's |
|---|---|---|---|
| Broken gate | A leg overshoots its band before the zone exists | Never; a voided pattern carries no edge | Always; the drawing continued after the void |
| Broken zone | Price closes beyond the void point after clean completion | Always; the exception is priced into the method | Never, if entry and stop followed the plan |
| Missing confirmation | No reversal candle prints at the completed zone | Never; waiting costs nothing | When the entry fires on the touch alone |
| Loose definition | Ratios differ between sources, completion is ambiguous | Never; definitions are chosen before the trade | When ratios shift to fit a chart already drawn |
Failure Questions, Answered
Why do harmonic patterns fail?
They fail for four reasons: a gate broke before the zone formed, the zone broke after clean completion, confirmation never printed at the zone, or the definition was loose enough that the pattern was never real. Only the second is the method's normal cost of doing business. The other three are execution failures.
What percentage of harmonic patterns fail?
No fixed percentage exists, because the answer depends on which failures are counted. Count only clean completions stopped at the void point, and the failure rate is whatever the method's published win rate implies. Count every drawing a trader sketched, including voided gates and unconfirmed entries, and the failure rate climbs sharply. The second number measures the trader, not the pattern.
Is a failed pattern still useful?
Yes, in one specific way. A zone that completes cleanly and then breaks tells the trader the level was real and was overrun, which is information about order flow at that price. What the failed pattern is not useful for is re-entry at the same zone on the same thesis. The void point closing means the original trade is dead, full stop.
Can a voided pattern become valid again?
No. A gate broken is a gate broken for that swing. A new pattern can form later from new pivots, with fresh X, A, B, and C points measured from the new structure, but that is a different pattern, not a resurrection of the old one. Stretching the old ratios to fit the new price is cause four in action.
The next lesson steps back from single patterns entirely and asks what the geometry itself assumes, the angled lines Gann laid over charts and what a trader should realistically take from them.