W.D. Gann: The Trader Behind the Angles
Gann was a market trader and writer who worked the first half of the twentieth century, left behind a set of geometric tools still drawn on charts today, and left behind something harder to grade: a legend built on claims that were never verifiable, and a handful of rules that survived because they work. W.D. Gann is the name attached to the angles, the squares, and the retracement rules that close out this level, and the honest way to approach the material is to keep the man and the myth in separate columns from the start.

The harmonic lessons just closed taught pattern geometry built from measured legs. This lesson opens the final block of the level, the geometry Gann drew over price charts, and it starts with the operator rather than the tools, because the tools make more sense once the claims around the name have been sorted into documented and disputed. That sorting is the approach here: the record first, the legend second, the rules judged on their own.
The Documented and the Disputed
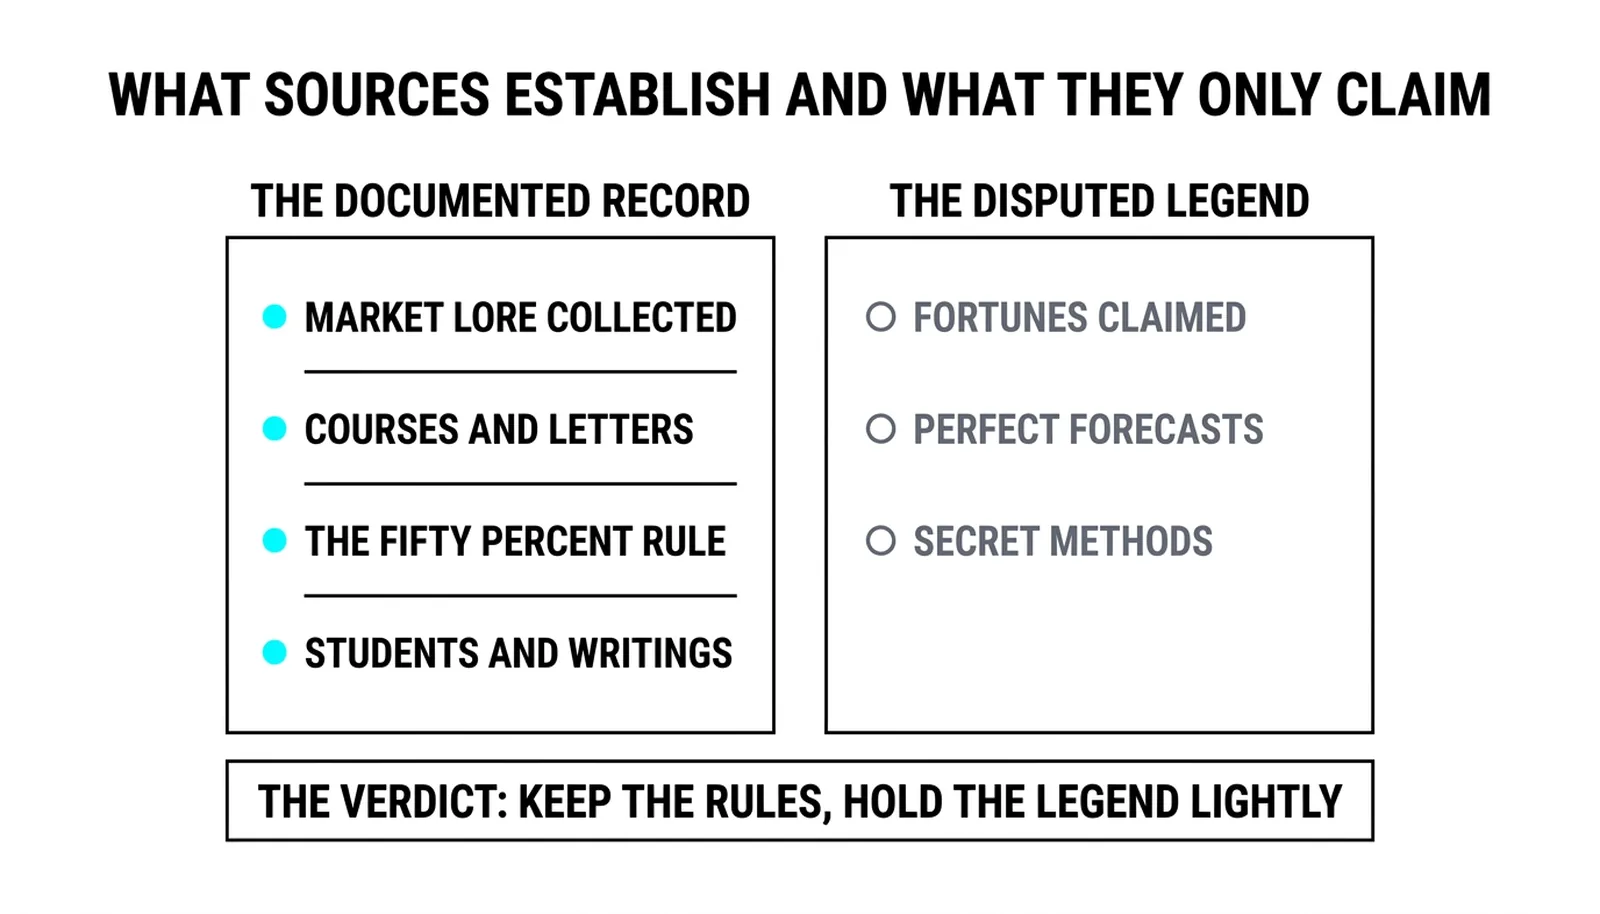
The documented record is thin but solid. Gann was born in Texas in 1878, moved into trading in the early 1900s, and spent decades working markets in New York. The written output is real and still on shelves: a 1923 book on reading the tape, a late memoir covering a half-century in the market, and a series of courses whose notes traders still study line by line. Whatever else is argued about, the books exist, the courses exist, and the trading rules inside them can be tested by anyone with a chart.
The disputed record starts with a 1909 magazine interview conducted within the classic accumulation and distribution tradition. The article described an observed run of trades with an extraordinary win count, presented as audited, and that single account became the foundation of the legend. The problem is that nothing beyond the article itself verifies the numbers. No independent account records survive, and the published description is the only source.
Then there is the fortune. Figures in the tens of millions of dollars circulate in books and courses about Gann, quoted and requoted for decades. No estate record, tax document, or brokerage statement has ever surfaced to confirm any of them. The claim is repeated, not documented.
The writing itself adds a third layer. Instructions sit beside riddles, plain trading rules beside passages that read like puzzles, and generations of readers have built theories about hidden meanings. Some of that is deliberate misdirection, some of it is the style of the era, and some of it is readers finding patterns the author never planted.
The honest reading is simple. The tools survive on their own usefulness. The fifty percent retracement rule and the angle geometry need no legend to work, and the trader who adopts the tools without the mythology loses nothing that matters.
The Rules That Survived
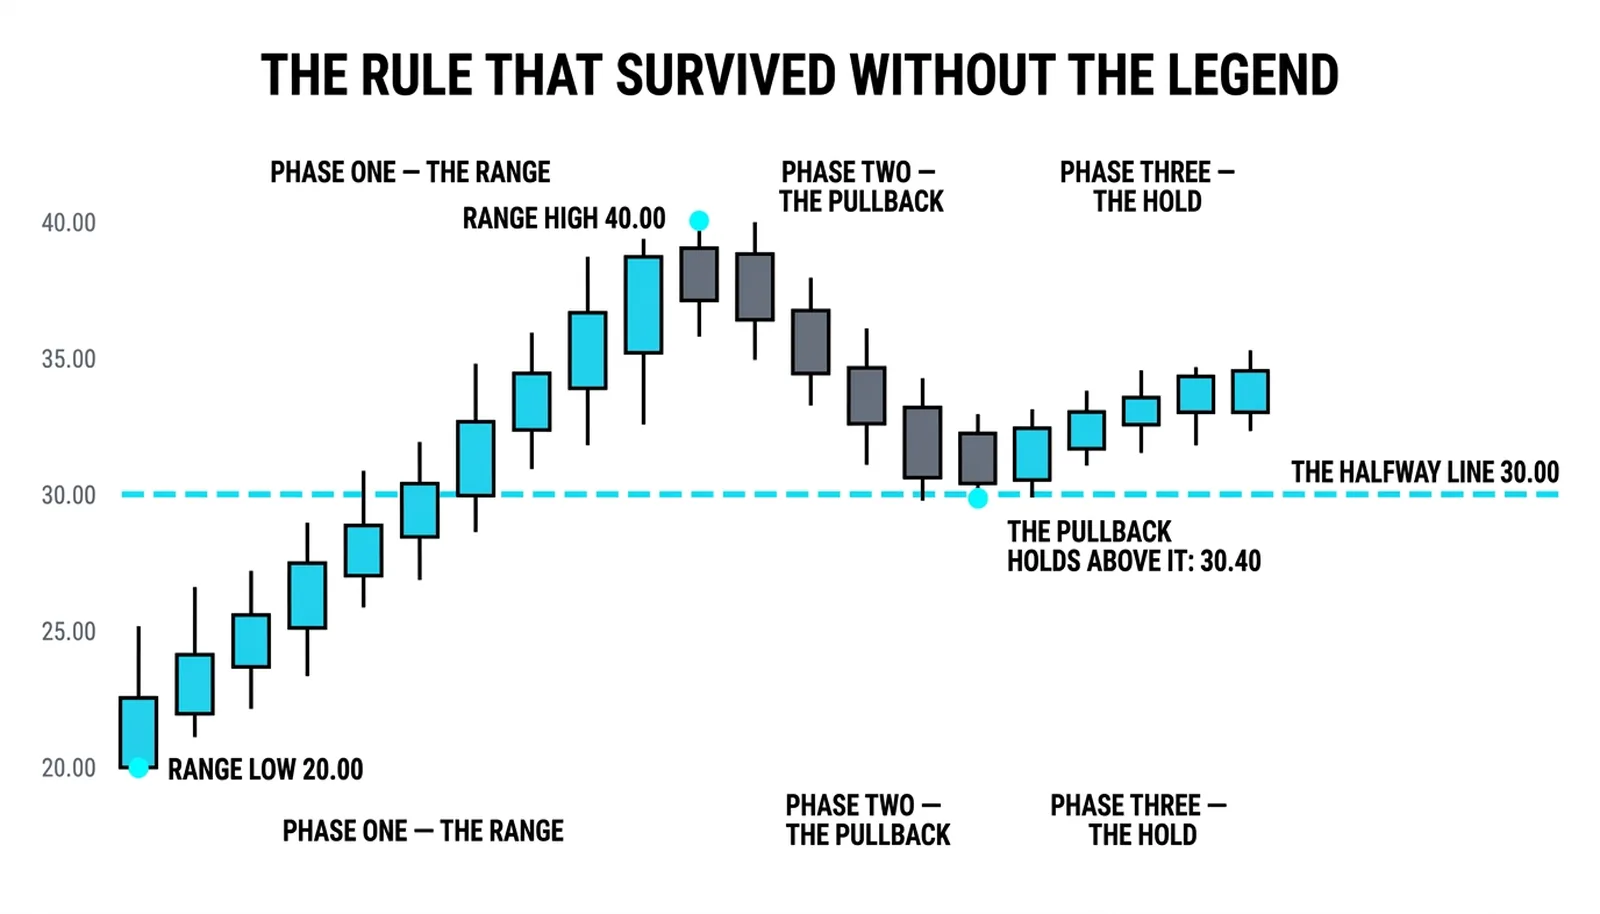
The fifty percent rule is the bridge into this whole block. The Gann framework states that the halfway point of a major range is the most important level on the chart. When price retraces half of a significant swing, that line tends to attract a decision: either the move resumes from there, or the level breaks and the structure changes. The rule is not mystical. Halfway is where the average participant in the prior move sits at breakeven, and breakeven is where conviction gets tested.
The retracement lessons earlier in this level taught the same line as the fifty percent mark, measured with different tools. That overlap is the point. A level that shows up under two independent methods, from two different traditions, earns more respect than a level that belongs to one name.
The angle geometry is the second survivor. Gann drew diagonal lines from significant highs and lows at fixed rates of price against time, the most famous being the one-to-one line, where one unit of price matches one unit of time. A market holding above a rising one-to-one line was considered strong; a market falling below it was considered to have changed character. Whether the angles carry predictive power or simply give structure to trend reading, they force a trader to define what "trend is intact" means in advance, and that discipline alone has value.
The tools outlived the legend for a plain reason: they are falsifiable. A fifty percent line either holds or it breaks. An angle either contains price or it does not. A claim about a fortune in 1909 cannot be tested at all. Markets keep what can be checked and discard what can only be believed.
The Halfway Line at 30.00
The following numbers are hypothetical, chosen round for clarity, and they run the fifty percent rule exactly as written.
- A range runs from 20.00 to 40.00, twenty points wide.
- The halfway line stands at 30.00.
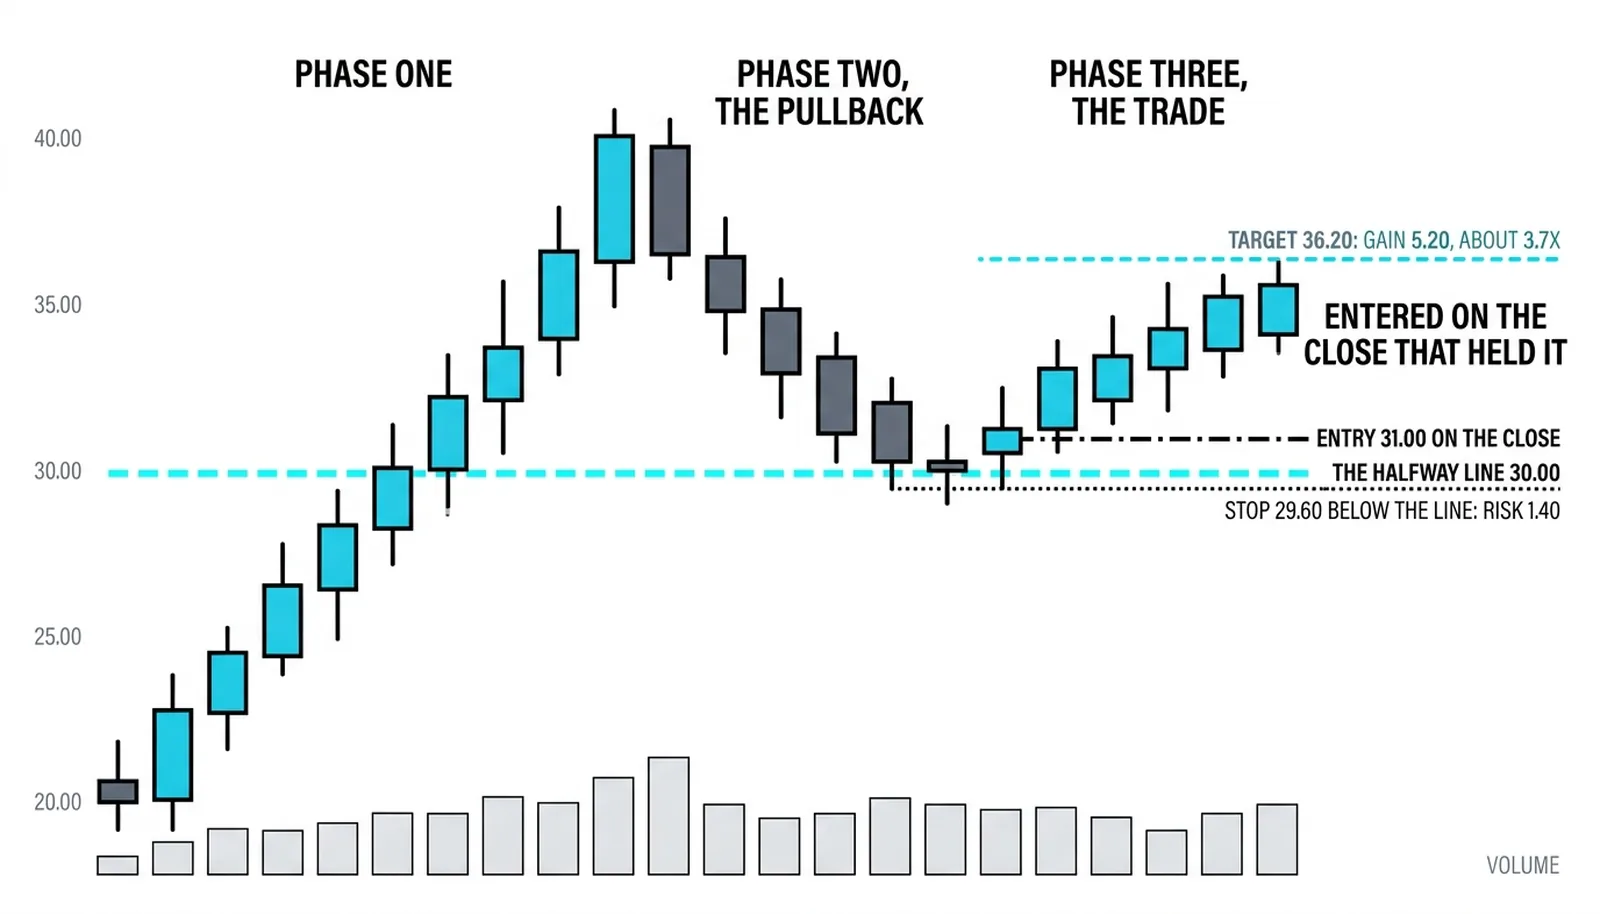
- Price pulls back to 30.40, holds above the line, and a reversal candle closes at 31.00.
- The long is taken at 31.00.
- The stop sits at 29.60, below the halfway line, risking 1.40.
- The first target is 36.20, just under the upper quarter of the old range, a gain of 5.20, about 3.7 times the risk.
The logic is mechanical. The halfway line is the level. The hold above it is the confirmation. The stop goes where the idea is proven wrong, which is a close below the line, not a random distance away. The target respects the structure above rather than hoping for a new high.
The failed version teaches the same lesson from the other side. If price closes at 29.20, below the halfway line, the trade is refused. No entry, no stop, no loss. That refusal is identical to what the fibonacci work in the retracement lessons demanded for the same setup, because the line is the same line under a different name.
That is the honesty worth stating plainly: the fifty percent level needs no attribution to earn its place. The legend adds color to the rule and nothing to its edge.
| The claim | Its source | Its status | What the trader uses |
|---|---|---|---|
| A life in the markets from the early 1900s onward | Published books, courses, and records of the era | Documented | Context for when and how the tools were built |
| An extraordinary audited win run in 1909 | A single magazine interview | Unverified beyond the article | Nothing; a story, not a setup |
| A fortune in the tens of millions | Repeated quotations with no account records | Untraced | Nothing; results claims are not a method |
| The fifty percent rule and the angle geometry | The published courses and books | Testable on any chart | Levels, trend definitions, and disciplined entries |
Gann Questions, Answered
Who was W.D. Gann?
Gann was a Texas-born trader and writer, born in 1878, who worked markets through the first half of the twentieth century and published books and courses on tape reading, retracements, and geometric chart tools. The written output is documented; parts of the personal legend are not.
Did Gann really make a fortune?
No record confirms the fortune. The figures quoted in books about Gann have never been traced to account statements, estate documents, or tax records, so the honest answer is that the claim is repeated rather than proven.
What is the fifty percent rule in the Gann framework?
The rule states that the halfway point of a major range is the most important level on the chart. Price pulling back to that line either holds and resumes the prior move, or breaks and signals a change in structure, which makes the line a natural place to plan entries and stops.
Do Gann methods still work?
The testable parts hold up as well as any structural tool: the fifty percent line and the angle geometry define levels and trend conditions that can be checked on modern charts. The parts that cannot be tested, the coded writing and the legendary results, add nothing a trader can measure.
The next lessons in this block take the geometry off the page and onto the chart: how the angles are drawn, how the squares are built, and where the lines earn a place in a trading plan.