The Gartley: Structure and Trading Rules
The gartley pattern is the oldest named structure in the harmonic family and the rootstock of the old orchard, the one trunk the later varieties were grafted onto, drawn by H.M. Gartley in 1935 and defined today by two gates: the pullback to B at 61.8 percent of the opening swing and the final point D at 78.6 percent. Everything that came after it, every named variation with its own ratios, was measured against this drawing first. Learn this shape well and the rest of the family reads as commentary on it.

The named-pattern lessons covered the codified set, the shapes with fixed modern rules. This lesson goes back to the drawing that started the naming. The structure is five points: X, A, B, C, D. X to A is the initial swing, the leg everything else is measured against. B is the first gate, and the gartley demands the deepest retracement of the family at that point. C retraces the AB leg. D completes the zone. The trade is taken at D, against the original swing, with the stop beyond it.
Two Gates and a Zone
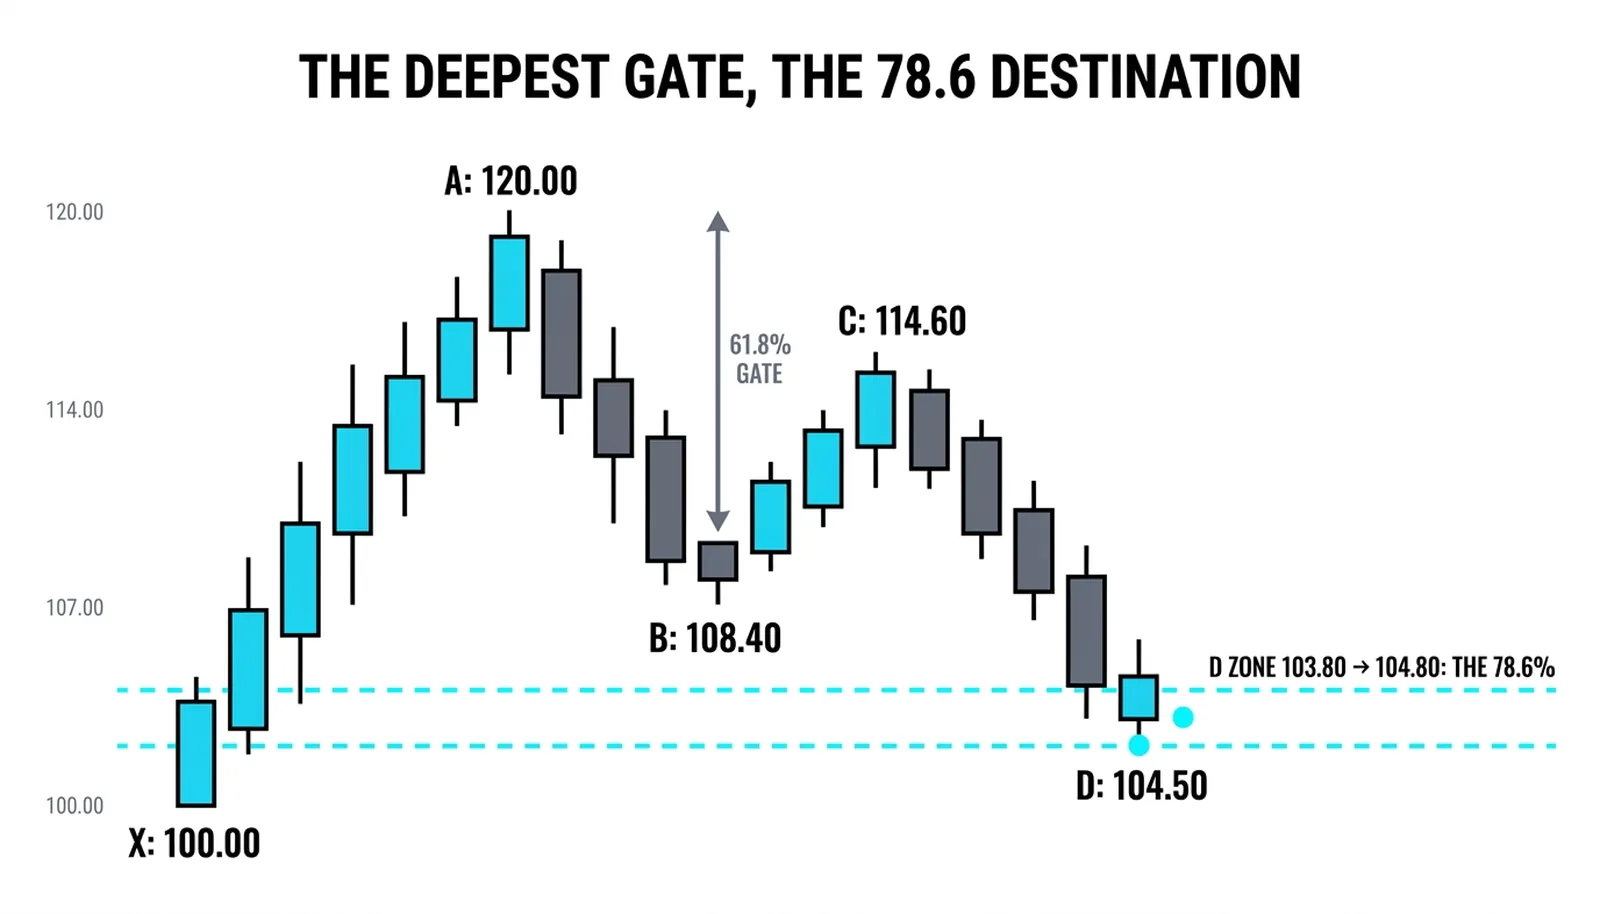
The first gate sits at B. In a bullish gartley, price rallies from X to A, then pulls back, and the pullback must reach 61.8 percent of the XA leg. Not approximately, not somewhere in the fifties. The 61.8 gate is what separates this shape from its descendants, each of which was defined partly by moving that gate.
The second gate sits at D. After B forms, price rallies again to C, which commonly retraces about 61.8 percent of the AB leg, and then declines into the completion zone at 78.6 percent of the full XA swing. That 78.6 line is the deepest gate in the pattern and the reason the shape offers such tight risk: the entry sits close to the invalidation.
Two more conditions complete the geometry. The CD leg should mirror the AB leg in length, the AB equals CD relationship, and the BC projection into the zone should land near 1.13 to 1.618. When all of these converge at the same price area, the zone is tight and the trade is clean. When they scatter, the zone widens and the edge thins.
- X to A: the initial swing, the measuring stick for everything after.
- B: the 61.8 percent retracement of XA, the defining gate.
- C: a retracement of AB, commonly near 61.8 percent.
- D: 78.6 percent of XA, confirmed by AB equals CD and a BC projection of 1.13 to 1.618.
A blunt rule follows from this. If B does not reach 61.8, the shape is not a gartley, and calling it one borrows credibility the geometry has not earned.
The 1935 Drawing and Its Restorations
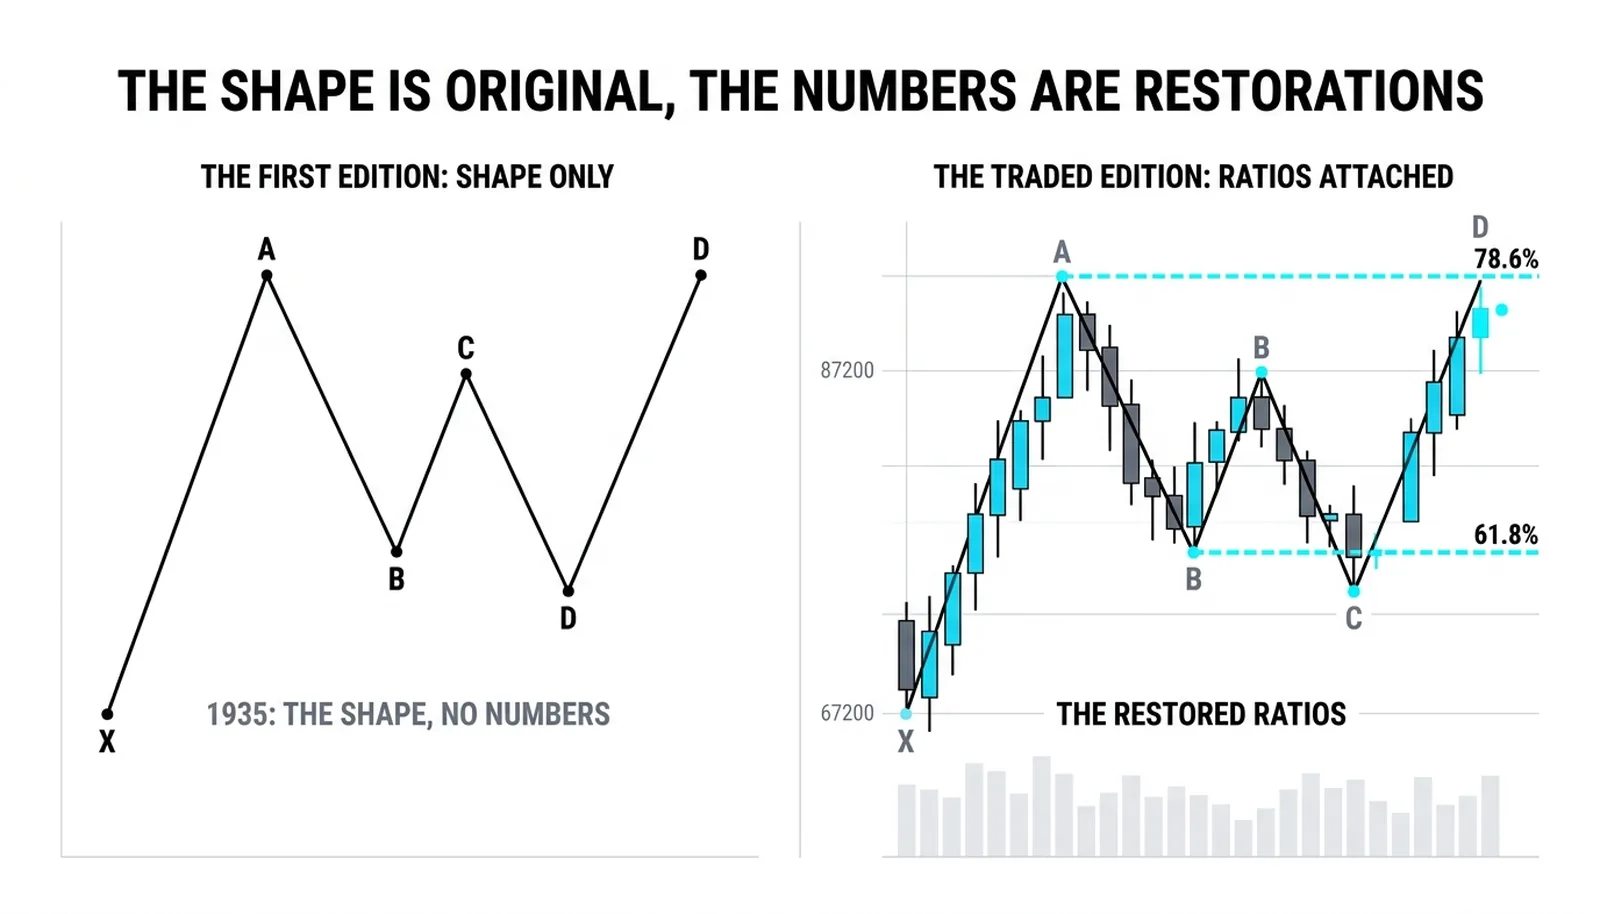
H.M. The pattern's original description presented the shape in a 1935 work on stock market analysis, and the diagram appeared on page 222, which is why older traders still call it the 222 pattern. The original drawing showed the five points and the general proportions. It did not carry the Fibonacci numbers traded today.
The precise ratios arrived decades later. Ratio analysis practice applied Fibonacci retracements to the structure and traded it for years. Harmonic trading doctrine then codified the modern version, fixing the 61.8 gate at B and the 78.6 completion at D, and those definitions are the ones most charting software now uses. This is why sources disagree about the older details: the shape is original, the numbers are restorations.
Be honest about what that means. A pattern whose defining numbers were added after the fact is a pattern with two editions. The 1935 edition is a drawing of a recurring tendency in price. The modern edition is a rule set built on that drawing. Neither is fake, but they are not the same document, and the trader should know which edition the rules come from before quoting win rates or stop logic.
The practical consequence is simple. Gartley never wrote 78.6, so the original text offers no void rule to inherit. The invalidation logic, the stop placement, the target structure, all of that belongs to the restored edition, and the trader using the restored entry owes the restored discipline that goes with it.
The Zone at 104.28
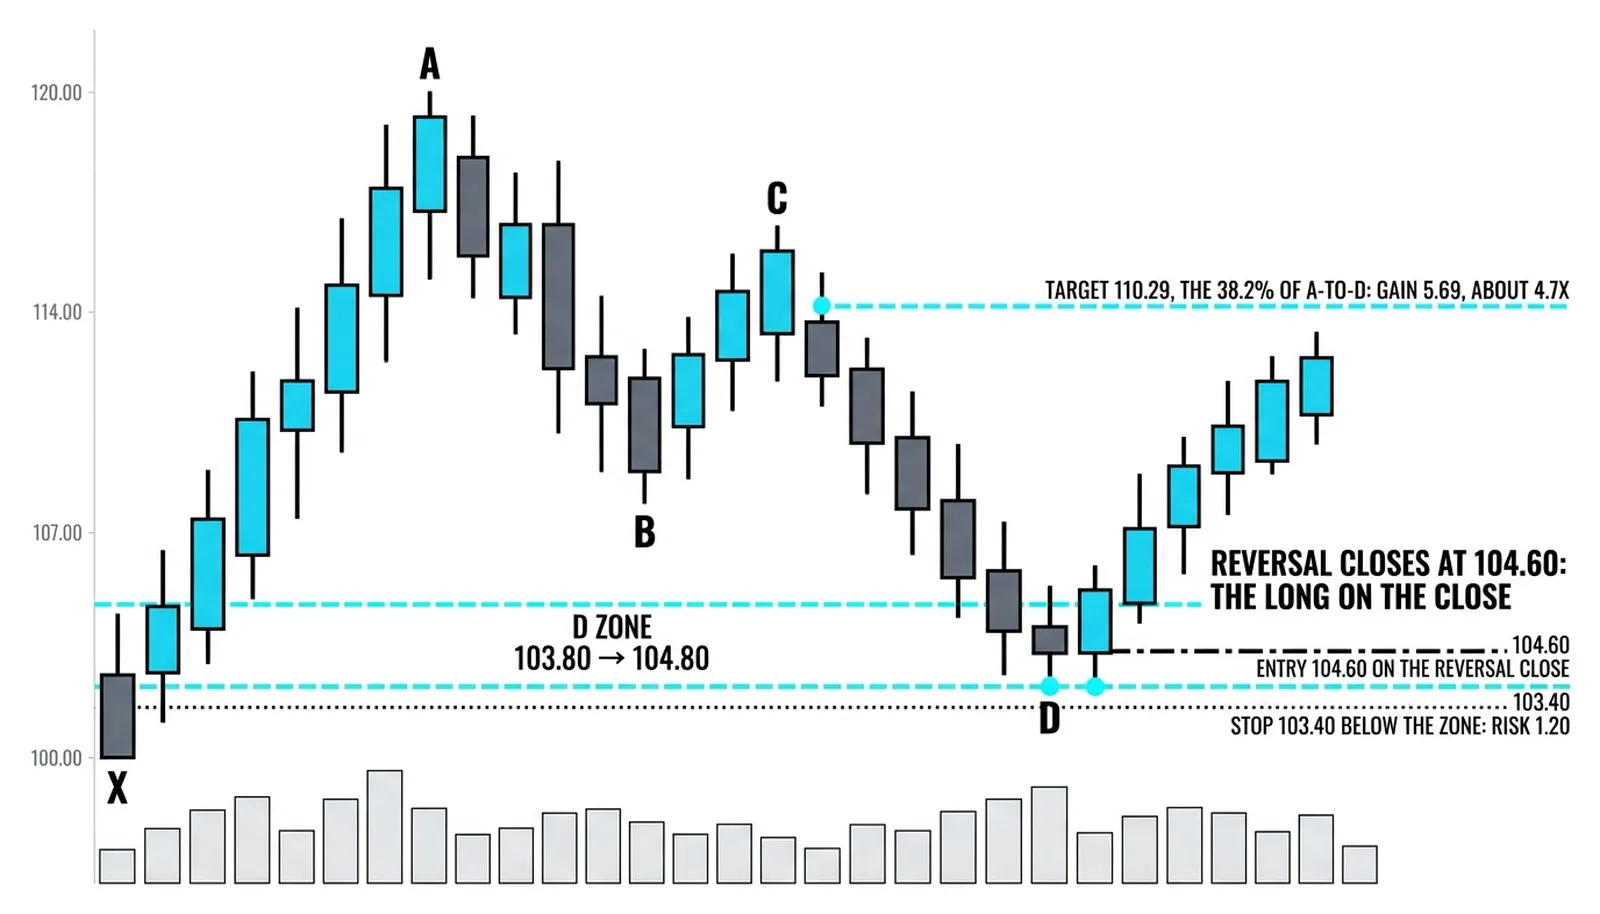
Here is a hypothetical bullish gartley with round numbers, purely an illustration. The swing runs from 100.00 at X to 120.00 at A, a twenty-point leg. Price then pulls back to B at 107.64, which is exactly the 61.8 percent retracement of XA. The first gate holds.
From B, price rallies to C at 115.28, a 61.8 percent retrace of the AB leg. Then the final decline carries price to D at 104.28, the 78.6 percent retracement of the full XA swing. The AB equals CD measurement and the BC projection cluster around the same area, so the zone is tight.
A reversal candle closes at 104.60. The long is taken there. The stop sits at 103.40, below the zone and below the point where the pattern's geometry is plainly broken. The risk is 1.20 per share.
The first target is 110.29, the 38.2 percent retracement of the A-to-D leg. From the 104.60 entry, that is a gain of 5.69, roughly 4.7 times the risk. That asymmetry is the entire argument for the pattern: deep retracement entries produce small stops against meaningful targets.
Now the honest version. Price reaches the zone and keeps falling, closing at 103.10, below the stop. The pattern failed. No re-entry on hope, no widening the stop because the ratios were pretty. The trade loses 1.20 per share, the planned amount, and the next setup gets full attention because this one was paid for properly.
| Point | Leg It Ends | Defining Ratio | Example Price |
|---|---|---|---|
| X | Start of the swing | Reference point | 100.00 |
| A | XA | Initial swing high | 120.00 |
| B | AB | 61.8% retracement of XA | 107.64 |
| C | BC | 61.8% retracement of AB | 115.28 |
| D | CD | 78.6% retracement of XA | 104.28 |
Gartley Questions, Answered
What is the gartley pattern?
The gartley pattern is a five-point harmonic structure, X-A-B-C-D, in which B retraces 61.8 percent of the XA swing and D completes at 78.6 percent of that same swing. It is the oldest named harmonic shape, drawn by H.M. Gartley in 1935, and the trade is taken at D against the original swing with a tight stop beyond the zone.
How is the gartley different from the bat?
The difference is the depth of the two gates. The gartley requires B at 61.8 percent of XA and D at 78.6 percent, while the bat uses a shallower B, near 38.2 to 50 percent, and a deeper D, near 88.6 percent. Same skeleton, different proportions, different stop distances.
Why is it called the gartley 222?
The nickname comes from the page number. The diagram appeared on page 222 of the pattern's original description, and traders shortened the reference to the 222 pattern. The name stuck long before the modern ratios were attached to the shape.
When does the gartley fail?
The gartley fails when price closes beyond the D zone instead of reversing from it. In the worked example, the close at 103.10 below the 104.28 zone was the failure signal, and the correct response was the planned 1.20 loss. A close through the 78.6 line destroys the geometry the trade was built on, so the stop is not negotiable.
Next in the level, the autopsy continues with the shapes that fail most often and the specific reasons they do, so the trader learns to recognize a dying pattern before the stop has to say it.