Why Traders React at Fibonacci Levels
Traders react at fibonacci levels because the levels are published in advance, watched by an enormous crowd running the same tools on the same obvious swings, and a price where millions of decisions are pre-committed becomes a place where the market genuinely behaves differently. The line is nothing magical: a public appointment, and price behaves differently at public appointments.

Think of a rendezvous agreed weeks ahead: everyone arrives at the same bench at the same hour, and the bench is crowded for no reason other than the invitation was public. The previous lesson made the consensus case from the outside, showing that enough watchers turn a watched price into a real event. This lesson goes inside that crowd: what the individual trader feels at the line, and what all those individuals add up to.
Four Layers of Why
The first layer is anticipation. A level computed from a completed swing exists before price arrives. That ordering matters more than anything else in this lesson. Because the 61.8 percent line can be drawn the moment the swing high is in, traders set orders, alerts, and plans at it days or weeks before price gets there. That is what separates a Fibonacci level from a line drawn after the fact to fit a move that already happened. One is a commitment made in advance. The other is a story told afterward.
The second layer is self-persuasion. A trader who has a plan at the level feels the level. They watch price approach it with more attention than they give any other part of the chart. When the reaction comes, the reaction confirms the tool, and the confirmation deepens the habit. The next swing gets the same treatment, with more conviction. The habit builds on itself: each trader who sees a hold and acts on it becomes one more reason the next hold happens.
The third layer is aggregation, and it is the one that does the actual work. None of this requires anyone to be right about anything. It requires enough people to act at the same price for the order flow to bulge there. Entries cluster at the line. Stops stack just beyond it. Limit orders from traders who never speak to each other arrive at nearly the same price because they all measured the same swing with the same ratio. The market's short-term behavior bends around that inventory of resting orders, the way a river bends around a pier that thousands of independent builders happened to place on the same line.
The fourth layer is the flip side, and it keeps the whole idea honest. The same crowding that makes a level strong makes its failure loud. When price breaks through a watched level, the stops stacked just beyond it fire together, and that burst of forced selling or buying fuels the break. The crowd that made the level hold is the crowd that makes its failure dramatic. A level nobody watched would fail quietly. A level everybody watched fails with a rush.
Orders, Stops and the Shape of a Reaction
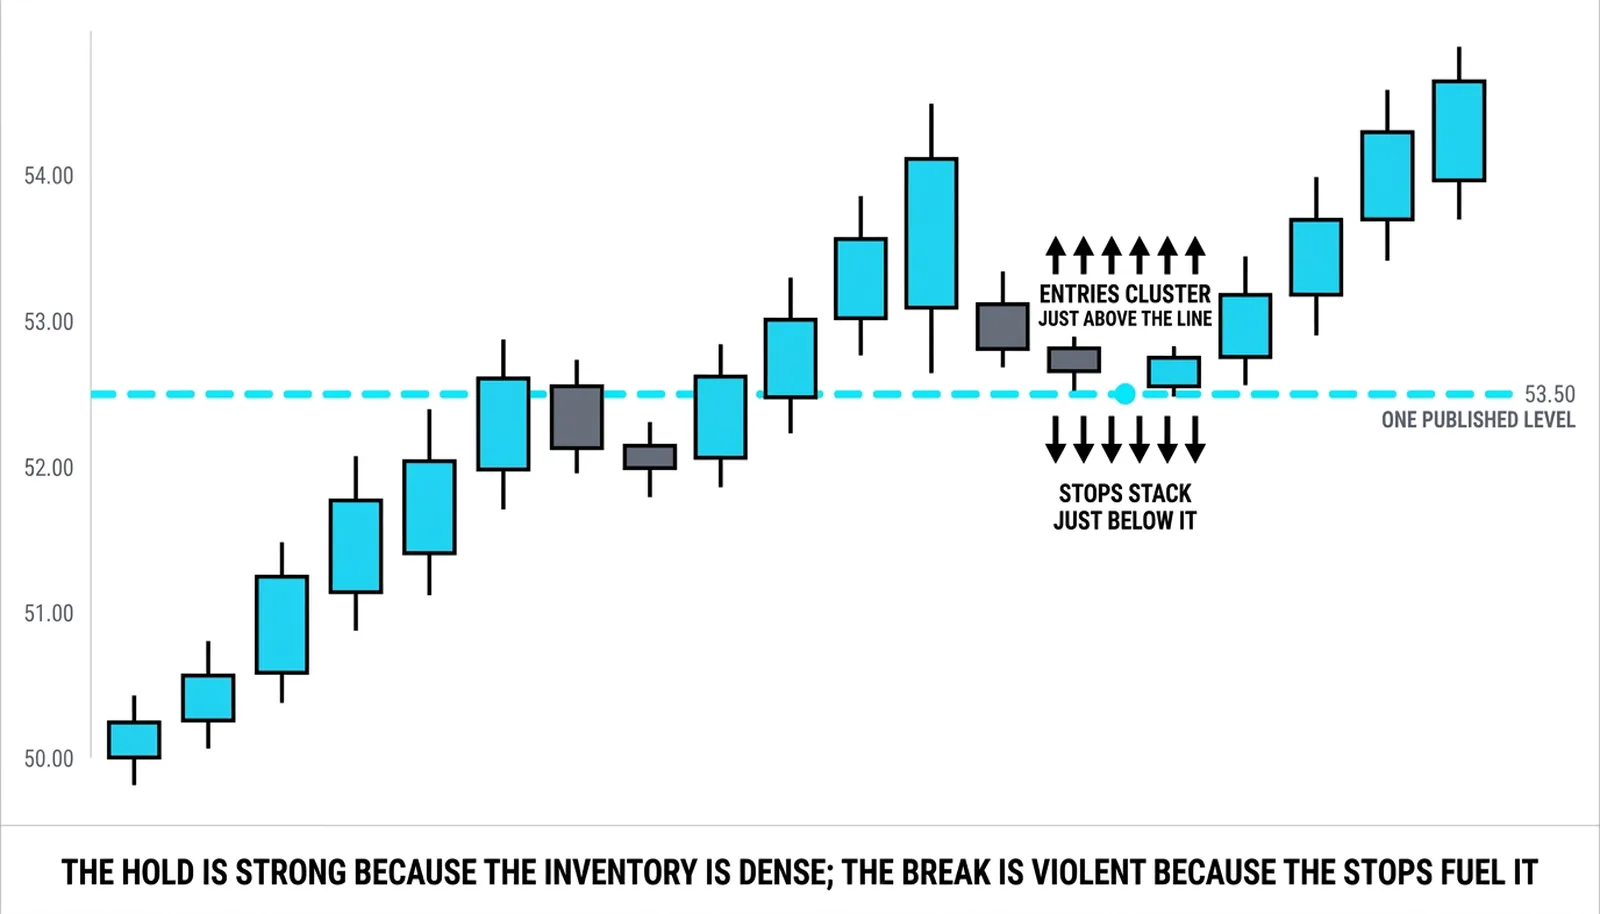
Look at where the orders actually sit. Entries cluster at the line itself and in the small zone around it, because traders disagree slightly about rounding, about which swing to measure, and about how much tolerance to allow. Stops stack just beyond the line, because nearly every trader who bought the reaction puts the exit on the other side of it. The result is a sandwich: buying interest at the line, selling interest waiting below it, and very little in between.
That structure explains the two shapes you will see over and over. A hold is strong because the clustered entries absorb the selling and the stacked stops are never touched. A break is violent because once the line gives way, the stops trigger in a wave, and the wave feeds itself. The same inventory that defended the level becomes the fuel for the move through it.
Fibonacci cluster practice holds that the levels themselves are only coordinates and that the reaction at the level is what the trader is actually paid to read. The line tells you where to pay attention. It does not tell you what will happen there. What happens there is the information.
One more pattern follows from the psychology. Each test spends some of the level's strength. The traders who intended to buy the line mostly buy it on the first touch. The second touch draws the ones who hesitated. By the third touch, much of the committed buying is already in the market, already holding, already nervous. The first hold is the strongest. This is not a law, but it is the honest expectation, and it shapes how a careful trader sizes and manages each attempt.
Trading With the Crowd, Not Behind It
The practical rule is to act at the reaction, not at the touch. A touch is just price arriving at a coordinate. A reaction is the crowd showing its hand: price reaching the line, pausing, and turning with evidence that the clustered orders are real. The trader who enters on the touch is guessing that the crowd will show up. The trader who waits for the reaction is confirming that the crowd did show up, and paying a slightly worse price for that confirmation.
The stop belongs beyond the line, in the zone where the crowd's own stops sit. This feels uncomfortable, because it places your exit among the orders that will fire if the level fails. That is exactly why it belongs there. If the level breaks, you want to be out in the first wave, not holding through it hoping the crowd returns. The stop is not a prediction that the level will fail. It is an acknowledgment of what the failure looks like when it comes.
Expect the failure pattern in advance. Most watched levels eventually break, and the break is fast for the reasons already covered. The trader who understands the psychology is not surprised by this. They take the holds while the level is fresh, keep the stop where the crowd's stops sit, and treat a clean close beyond the line as the end of the idea, not as a reason to argue with the market.
The Twice-Held Line at 22.30
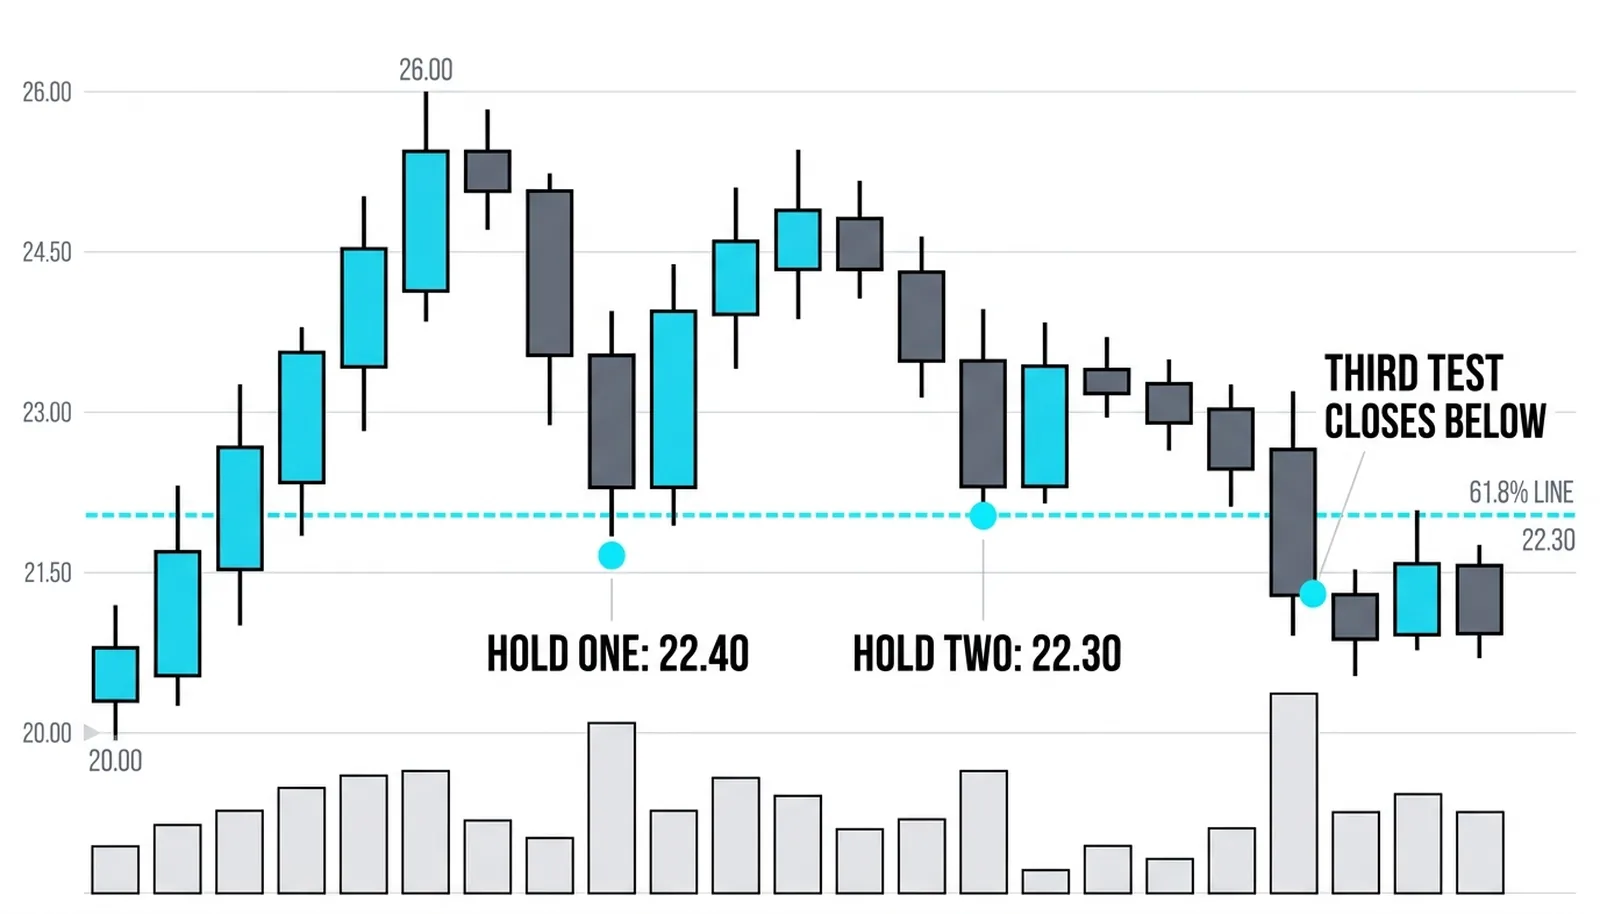
Here is a hypothetical illustration with round numbers. A leg runs from 20.00 up to 26.00, a 6.00 point swing. The 61.8 percent retracement of that leg lands at 22.29, which rounds to 22.30 at the tick. The line is drawn the moment the 26.00 high prints, weeks before price returns to it.
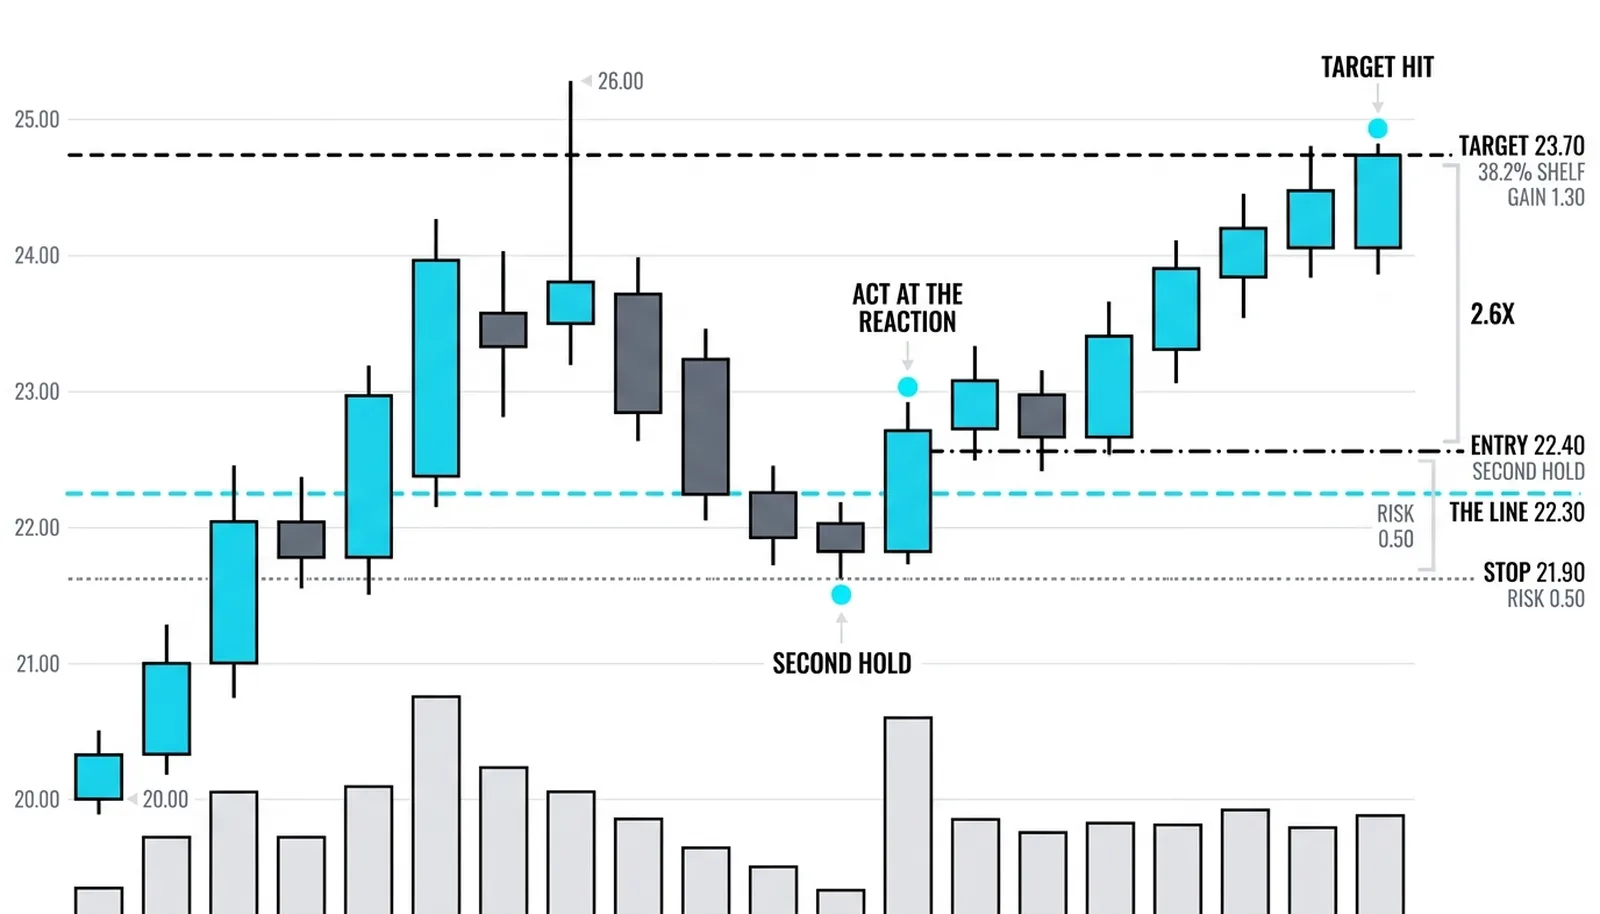
Price sags into the level and holds at 22.40, then bounces. That first test spends some of the level's strength. Price drifts back down and holds again at 22.30, the line itself. On that second hold, the trader takes the long at 22.40 as the reaction confirms, with the stop at 21.90, below the line and below the cluster of the crowd's stops. The risk is 0.50 per share.
The first target is the 38.2 percent shelf above at 23.70, where early profit-takers from the crowd are likely to sell. The trade reaches it. The gain is 1.30 against a risk of 0.50, about 2.6 times the risk.
Now the failure version. Price returns for a third test, and this time there is no hold. The bar closes at 22.00, below the line. The stops stacked under 22.30 fire together, and the drop is fast, exactly as the crowded structure predicts. The level is dead. The next honest reference on the chart is the 78.6 percent shelf near 21.30, and the disciplined trader is already flat, watching it from safety.
| The test | The low | The outcome | What it told the crowd |
|---|---|---|---|
| First touch | 22.40 | Held and bounced | The clustered bids were real |
| Second touch | 22.30 | Held at the line; long taken at 22.40 | Remaining buyers still committed |
| Third touch | 22.00 close | Level broken, stops fired | The buying was spent |
| After the break | Toward 21.30 | Fast move to the next shelf | Failure of a crowded level is loud |
Fibonacci Psychology Questions, Answered
Why do traders react at fibonacci levels?
Traders react at fibonacci levels because the levels are computed in advance from swings everyone can see, so orders, alerts, and plans accumulate at the same prices before price arrives. The reaction is the visible result of that pre-committed inventory, not a property of the ratio itself.
Are fibonacci levels self-fulfilling?
Partly, yes, and that is not a criticism. The levels work because enough traders act at them, and traders act at them because they have worked before. The mechanism is circular, but the order flow it produces is real, and real order flow is what moves price in the short term.
Do institutions use fibonacci levels?
Many institutional desks are aware of the major retracement levels on obvious swings, even when the levels are not the primary reason for a trade. Awareness alone matters, because a large participant who knows a level is crowded can choose to join it, front-run it, or exploit the stops beyond it.
What happens when a fibonacci level breaks?
When a fibonacci level breaks, the stops stacked just beyond it fire together, so the move through the level is usually fast. The failed level then becomes a reference on the other side, and the trader's attention shifts to the next level in the sequence rather than to the one that just died.
The next lesson puts the ratios to work: how to draw the retracement tool cleanly, which swings deserve a measurement and which do not, and how to read the difference between a level that is holding and one that is only pausing before it gives way.